. 2025 Mar;21(3):548-564.
doi: 10.1080/15548627.2024.2409613. Epub 2024 Oct 16.

Copper aggravated synaptic damage after traumatic brain injury by downregulating BNIP3-mediated mitophagy

Affiliations

Copper aggravated synaptic damage after traumatic brain injury by downregulating BNIP3-mediated mitophagy

Hanxiao Chang et al. Autophagy. 2025 Mar.

Abstract

Synaptic damage is a crucial pathological process in traumatic brain injury. However, the mechanisms driving this process remain poorly understood. In this report, we demonstrate that the accumulation of damaged mitochondria, resulting from impaired mitphagy, plays a significant role in causing synaptic damage. Moreover, copper induced downregulation of BNIP3 is a key player in regulating mitophagy. DMSA alleviates synaptic damage and mitochondrial dysfunction by promoting urinary excretion of copper. Mechanistically, we find that copper downregulate BNIP3 by increasing the nuclear translocation of NFKB, which is triggered by TRIM25-mediated ubiquitination-dependent degradation of NFKBIA. Our study underscores the importance of copper accumulation in the regulation of BNIP3-mediated mitophagy and suggests that therapeutic targeting of the copper-TRIM25-NFKB-BNIP3 axis holds promise to attenuate synaptic damage after traumatic brain injury.

Keywords: BNIP3; TRIM25; copper; mitophagy; traumatic brain injury.


Conflict of interest statement

No potential conflict of interest was reported by the author(s).

Figures
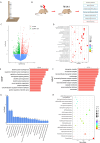
Figure 1.
Figure 1.
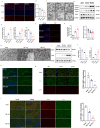
Synapse is damaged after TBI. (A) Schematic diagram of a closed traumatic brain injury model in mice. (B) On day 28 after TBI, transcriptome sequencing was performed on the hippocampal tissues of the mice (n = 3). (C) Volcano plot graph of 1975 nonredundant proteins. The upregulated proteins in TBI tissues were marked with red dots, and the downregulated proteins in TBI tissues with green dots. Blue plots represented the rest of genes with no signifcant expression change. (D) Dot plot of GO analysis. (E and F) Representative upregulated and downregulated biological pathway (BP) and cell component (CC) categories in GO analysis. (G) Representative changed categories in reactome analysis. (H) Dot plot of reactome analysis.
Figure 2.
Figure 2.
Downregulation of BNIP3 mediated mitophagy was associated with mitochondrial dysfunction and synapse damage. (A and B) immunofluorescence images of SNCA in hippocampus was used to detect synaptic damage after TBI (scale bar: 500 μm) (** p < 0.01) (n = 3). (C) Determination of synaptic damage, manifested by the reduction of vesicles (black arrow), in hippocampus after TBI by transmission electron microscopy analysis (scale bar: 2 μm) (n = 3). (D and E) Western blot analysis of cleaved CASP3, cleaved CASP9 and SNCA expression (** p < 0.01) (n = 3). (F) DHE staining was used to detect ROS levels in hippocampus after TBI (n = 6). (G and H) determination of autophagosomes in hippocampus after TBI by transmission electron microscopy analysis (scale bar: 2 μm) (** p < 0.01) (n = 5). (I and J) Western blot analysis of BNIP3 and COX4 expression (* p < 0.05,** p < 0.01) (n = 3). (K) Representative immunofluorescence images of BNIP3 in hippocampus after TBI (scale bar: 500 μm) (n = 6). (L) Dual immunofluorescence staining of LC3B with COX4 and quantitative analyses in hippocampus (scale bar: 500 μm) (** p < 0.01) (n = 3). (M) Dual immunofluorescence staining of LAMP2 with COX4 and quantitative analyses in hippocampus (scale bar: 150 μm) (** p < 0.01) (n = 3). Data in (B, E, H, J, L and M) are presented as mean ± SD. For statistics, unpaired Student t-test was used for (B, E, H, J, L and M).
Figure 3.
Figure 3.
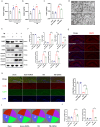
Accumulation of copper occured after TBI. (A) Copper concentration in hippocampus after TBI was detected by ICP-MS at different time points (** p < 0.01, # p > 0.05) (n = 3). (B) Copper concentration in cortex after TBI was detected by ICP-MS at different time points (** p < 0.01, # p > 0.05) (n = 3). (C) Copper concentration in hippocampus after DMSA treatment was detected by ICP-MS on day 28 after TBI (** p < 0.01, # p > 0.05) (n = 3) (D) determination of synaptic damage in hippocampus after DMSA treatment on day 28 after TBI (scale bar: 2 μm) (n = 3). (E and F) Western blot analysis of BNIP3, COX4, cleaved CASP3, cleaved CASP9 and SNCA expression (** p < 0.01) (n = 3). (G) Representative immunofluorescence images of BNIP3 in hippocampus (scale bar: 500 μm) (n = 6). (H) Dual immunofluorescence staining of LC3B with COX4 and quantitative analyses in hippocampus (scale bar: 500 μm) (n = 3) (I and J) Representative swimming tracks of the mice in all four groups of the MWM task and quantitative analyses of latency and distance (** p < 0.01) (n = 5) data in (A, B, C, F and J) are presented as mean ± SD. For statistics, unpaired Student t-test was used for (A, B, C, F and J).
Figure 4.
Figure 4.
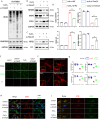
Downregulation of BNIP3 mediated mitophagy and mitochondrial dysfunction happened after copper administration in vitro. (A) CCK-8 was used to detect cell viability after copper administration (n = 3) (B) PI (red) and calcein (green) staining were used to detect cell survival in primary hippocampal neurons after copper administration (n = 6) (C) Representative photomicrographs of primary hippocampal neurons after copper administration(scale bar: 20 μm) (n = 3) (D and E) Representative immunofluorescence images and quantitative analyses of mito-tracker (red) in primary hippocampal neurons after copper administration (scale bar: 5 μm) (** p < 0.01) (n = 3) (F) flow cytometry analysis of JC-1 was used to detect mitochondrial membrane potential primary hippocampal neurons after copper administration (n = 3) (G) OCR was used to evaluate mitochondrial functions of primary neurons (n = 3) (H) Western blot analysis of BNIP3 and COX4 expression (* p < 0.05, # p > 0.05,** p < 0.01) (n = 3) (I) dual immunofluorescence staining of BNIP3 with MAP2 in primary hippocampal neurons after copper administration (scale bar: 20 μm) (n = 6) (J) dual immunofluorescence staining of LC3B with COX4 in primary hippocampal neurons after copper administration (scale bar: 10 μm) immunofluorescence was used to show the colocalization of LC3B (red) and COX4 (green) in primary hippocampal neurons (n = 6). Data in (A, E and G) are presented as mean ± SD. For statistics, unpaired Student t-test was used for (A and G), unpaired Student t-test and two-way ANOVA with multiple comparisons were used for (E).
Figure 5.
Figure 5.
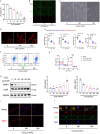
Decreased transcription level of BNIP3 was mediated by upregulation of NFKB. (A and B) Representative western blotting results of BNIP3 in primary hippocampal neurons treated with copper (200 μmol/l) and different concentrations of CQ (20 and 40 μM)/MG132 (10 and 20 μM) for 24 h (n = 3). (C) The mRNA level of BNIP3 after different concentrations copper administration (** p < 0.01) (n = 3) (D and E) western blot analysis of NFKB expression with nucleoplasmic separation after different concentrations copper administration(# p > 0.05) (** p < 0.01) (n = 3). (F) Immunofluorescence was used to detect nuclear translocation in primary hippocampal neurons after copper administration (n = 6). (G) The luciferase assays was used to detect the transcriptional regulation of NFKB to BNIP3 (** p < 0.01) (n = 3). (H) The qPCR was used to detect the transcriptional regulation of NFKB to BNIP3 (** p < 0.01) (n = 3) (I and J) western blot analysis of BNIP3 expression (** p < 0.01) (n = 3) (K) the ChIP assay results of the DNA binding with IgG and anti-nfkb antibody (n = 3) (L) the luciferase assays was used to detect the transcriptional regulation of NFKB to BNIP3 after copper administration (** p < 0.01) (n = 3) (M) the qPCR was used to detect the transcriptional regulation of NFKB to BNIP3 after copper administration (** p < 0.01)(n = 3) (N and O) western blot analysis of BNIP3 and COX4 expression (** p < 0.01) (n = 3) (P and Q) western blot analysis of cleaved CASP3 and cleaved CASP9 expression (** p < 0.01) (n = 3) (R) the ChIP assay results of the DNA binding with IgG and anti-nfkb antibody (n = 3) data in (B, C, E, G, J, L, M, O and Q) are presented as mean ± SD. For statistics, unpaired Student t-test was used for (B, C, E, G, J, L, M, O and Q).
Figure 6.
Figure 6.
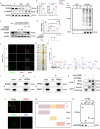
TRIM25 mediated the ubiquitination degradation of NFKBIA (A and B) Western blot analysis of NFKBIA and p-nfkbia expression with different concentrations copper administration (** p < 0.01) (n = 3) (C and D) Representative western blotting results of NFKBIA in primary hippocampal neurons treated with copper (200 μmol/l) and different concentrations of CQ (20 and 40 μM) and MG132 (10 and 20 μM) for 24 h (# p > 0.05,** p < 0.01) (n = 3) (E) IP was performed with a NFKBIA antibody, and western blot assays were used to examine the ubiquitin conjugation after different concentrations copper administration (n = 3) (F) immunofluorescence was used to show the colocalization of NFKBIA (red) and ubiquitin (green) in primary hippocampal neurons (scale bar: 10 μm) (n = 3) (G) silver staining results of all proteins bound to NFKBIA antibody (H) Mass spectrogram of TRIM25 (I and J) the interaction between NFKBIA and TRIM25 was confirmed by co-immunoprecipitation in primary hippocampal neurons (n = 3) (K) whole cell lysates from HEK 293T cells transfected with flag-tagged TRIM25 and his-tagged NFKBIA plasmids were immunoprecipitated with anti-flag, then immunoblotted with anti-his and anti-flag (n = 3) (L) confocal images showing colocalization of NFKBIA (red) and TRIM25 (green) in primary hippocampal neurons (scale bar: 5 μm) (n = 6) (M) schematic diagrams of flag-tagged full-length (FL) TRIM25 and their various deletion mutants (N) HEK 293T cells were co-transfected with flag-TRIM25 or its deletion mutants, and whole cell lysates were assessed by immunoprecipitation followed by immunoblotting with anti-nfkbia (n = 3) data in (B and D) are presented as mean ± SD. For statistics, unpaired Student t-test and two-way ANOVA with multiple comparisons were used for (B and D).
Figure 7.
Figure 7.
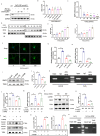
TRIM25 was crucial for Cu-induced decrease of mitophagy. (A) IP with anti-nfkbia antibody and western blot with anti-ub and anti-nfkbia antibody after copper and si-Trim25 treatment (n = 3) (B,C and D) western blot analysis of NFKBIA, BNIP3, COX4 and NFKB expression (** p < 0.01) (n = 3) (E) PI (red) and calcein (green) staining were used to detect cell survival in primary hippocampal neurons after copper and si-Trim25 treatment (n = 3) (F and G) Representative immunofluorescence images and quantitative analyses of MitoTracker (red) in primary hippocampal neurons after copper and si-Trim25 treatment (scale bar: 5 μm) (** p < 0.01) (n = 3) (H) dual immunofluorescence staining of BNIP3 with MAP2 in primary hippocampal neurons (scale bar: 20 μm) (n = 6) (I) immunofluorescence was used to show the colocalization of LC3B (red) and COX4 (green) in primary hippocampal neurons after copper and si-Trim25 treatment (scale bar: 10 μm) (n = 6) data in (B and D) are presented as mean ± SD. For statistics, unpaired Student t-test was used for (B and D).
Figure 8.
Figure 8.
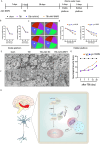
Neuroprotective effects of intracerebroventricular injection of AAV-BNIP3. (A) Schematic outlining the timeline for the morris water maze (B) quantitative analyses of latency and distance of all four groups of the MWM task during visible platform (n = 5) (C) Representative swimming tracks of the mice in all four groups of the MWM task (n = 5) (D) quantitative analyses of latency and distance of all four groups of the MWM task during hidden platform (n = 5) (E) was used to show the recovery of synapse after AAV-BNIP3 transfection (scale bar: 2 μm) (n = 3) (F) was used to show the recovery of mitochondria after AAV-BNIP3 transfection (scale bar: 2 μm) (n = 3) (G) the neurological dysfunction were analyzed by neurological severity scores (n = 5) (H) copper aggravated synaptic damage after traumatic brain injury by downregulating BNIP3- mediated-mitophagy data in (D and G) are presented as mean ± SD. For statistics, unpaired Student t-test was used for (D and G).

References

    1. Bao Z, Liu Y, Chen B, et al. Prokineticin-2 prevents neuronal cell deaths in a model of traumatic brain injury. Nat Commun. 2021;12(1):4220. doi: 10.1038/s41467-021-24469-y - DOI - PMC - PubMed
    1. Chao H, Lin C, Zuo Q, et al. Cardiolipin-dependent mitophagy guides outcome after traumatic brain injury. J Neurosci. 2019;39(10):1930–1943. doi: 10.1523/JNEUROSCI.3415-17.2018 - DOI - PMC - PubMed
    1. Lin C, Li N, Chang H, et al. Dual effects of thyroid hormone on neurons and neurogenesis in traumatic brain injury. Cell Death Dis. 2020;11(8):671. doi: 10.1038/s41419-020-02836-9 - DOI - PMC - PubMed
    1. Zhao P, Wei Y, Sun G, et al. Fetuin-A alleviates neuroinflammation against traumatic brain injury-induced microglial necroptosis by regulating nrf-2/HO-1 pathway. J Neuroinflammation. 2022;19(1):269. doi: 10.1186/s12974-022-02633-5 - DOI - PMC - PubMed
    1. Lamade AM, Anthonymuthu TS, Hier ZE, et al. Mitochondrial damage & lipid signaling in traumatic brain injury. Exp Neurol. 2020;329:113307. doi: 10.1016/j.expneurol.2020.113307 - DOI - PMC - PubMed

Publication types

MeSH terms