[Preprint]. 2024 Oct 9:2024.10.09.617487.
doi: 10.1101/2024.10.09.617487.

Amylin receptor subunit interactions are modulated by agonists and determine signaling

Affiliations

Amylin receptor subunit interactions are modulated by agonists and determine signaling

Sandra E Gostynska et al. bioRxiv. .

Update in

Abstract

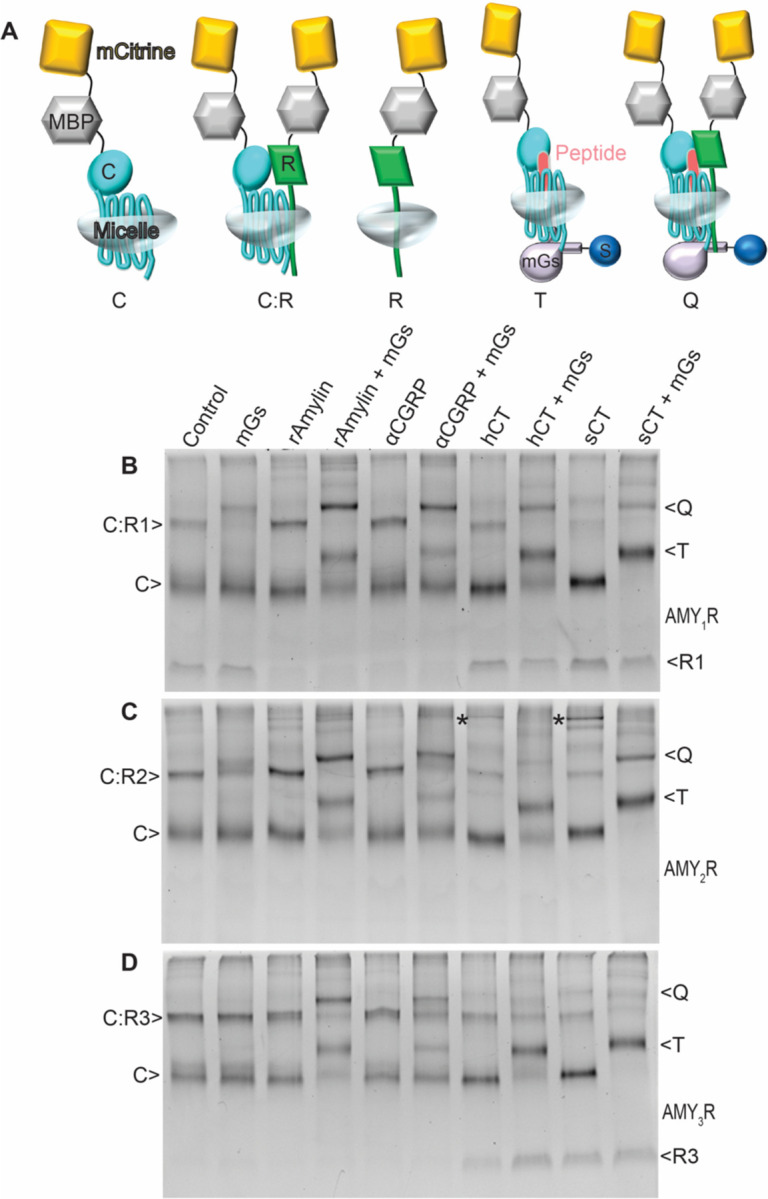
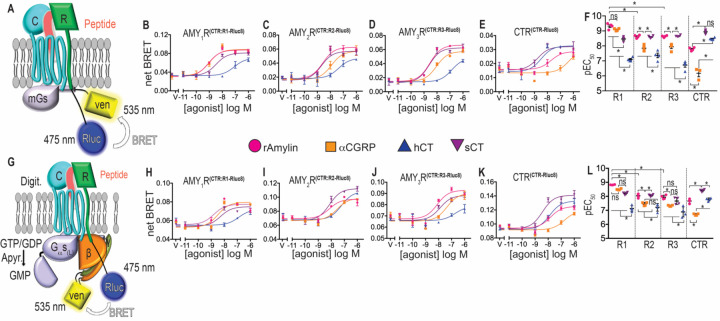
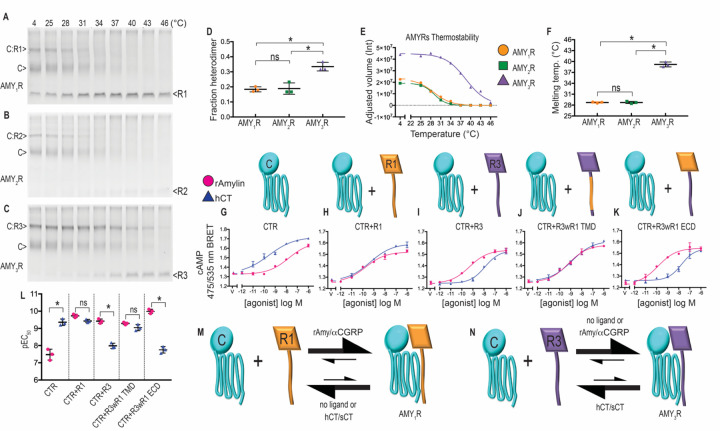
Three amylin receptors (AMYRs) mediate the metabolic actions of the peptide hormone amylin and are drug targets for diabetes and obesity. AMY1R, AMY2R, and AMY3R are heterodimers consisting of the G protein-coupled calcitonin receptor (CTR) paired with a RAMP1, -2, or -3 accessory subunit, respectively, which increases amylin potency. Little is known about AMYR subunit interactions and their role in signaling. Here, we show that the AMYRs have distinct basal subunit equilibriums that are modulated by peptide agonists and determine the cAMP signaling phenotype. Using a novel biochemical assay that resolves the AMYR heterodimers and free subunits, we found that the AMY1/2R subunit equilibriums favored free CTR and RAMP1/2, and rat amylin and αCGRP agonists promoted subunit association. A stronger CTR-RAMP3 transmembrane domain interface yielded a more stable AMY3R, and human and salmon calcitonin agonists promoted AMY3R dissociation. Similar changes in subunit association-dissociation were observed in live cell membranes, and G protein coupling and cAMP signaling assays showed how these altered signaling. Our findings reveal regulation of heteromeric GPCR signaling through subunit interaction dynamics.

Keywords: BRET; GPCR; RAMP; membrane protein native PAGE; peptide hormone.


Conflict of interest statement

Conflict of interest The authors report no conflicts of interest for this study.

Figures

Figure 1.
Figure 1.. Visualization of free RAMP and CTR subunits and AMYR heterodimers in the absence or presence of agonists and miniGs by native PAGE mobility shift assay in detergent.
A, Cartoon depicting the positions of the mCitrine-MBP tag on CTR (C) and RAMPs (R), and SUMO (S) tag on miniGs (mGs). B-D, Distribution of five molecular species C (CTR), C:R (CTR:RAMP), R (RAMP), T (ternary complex), Q (quaternary complex) formed in the presence or absence of 10 μM indicated peptide agonist and/or 50 μM purified SUMO-miniGs for co-expressed B, CTR and RAMP1 (AMY1R), C, CTR and RAMP2 (AMY2R), D, CTR and RAMP3 (AMY3R) in 7–10% gradient native gels. Representative gels for one of three replicates are shown with imaging for in-gel mCitrine fluorescence.
Figure 2.
Figure 2.. Densitometry quantitation of AMYR quaternary complexes, CTR ternary complexes, and free RAMP1/3 subunits from the agonist titration native PAGE experiments.
A, B, Agonist titrations at detergent-solubilized CTR:RAMP heterodimers and free CTR in the presence of excess SUMO–miniGs by native PAGE mobility shift assay in 7–10% gradient native gels showing fluorescent bands for the co-expressed A, CTR and RAMP1 (AMY1R) and B, CTR and RAMP3 (AMY3R). C-F, Quantification of quaternary (Q) or ternary (T) complexes band appearance by densitometry at A, AMY1R, B, AMY2R, C, AMY3R and at D, CTR. For plots C-F, the quantitated gel band volumes were normalized to the heterodimer or free CTR bands in the control lane and represented in fractions. G, Scatter plot summarizing the replicate pEC50 ± SEM values for the agonist titration in c-f. H, Scatter plot summarizing the replicate Emax ± SEM values from C-F, nd = not determinable. See Supplementary Data Table S1 for a summary of the pEC50 and Emax values. I, Quantitation of free RAMP1 band disappearance or J, free RAMP3 band appearance. K, Scatter plot showing the replicate pEC50 ± SEM values for appearance of the free RAMP1; pEC50_rAmy = 6.97±0.2 and pEC50_αCGRP = 6.63±0.07 or disappearance of RAMP3 band; pEC50_sCT = 7.21 ± 0.07 and pEC50_hCT = 5.89 ± 0.04. The plots in C-F, and I, J show a representative from a single set of gels. Scatter plots in G-H, and K show the values from 3 independent replicates. Star indicates significance as compared with all other combinations determined by one-way ANOVA with Tukey’s post hoc test.
Figure 3.
Figure 3.. CTR:RAMP cell surface subunit proximity BRET assay in live HEK293 cells.
A, Cartoon depicting the positions of the HiBiT tag at CTR and mCitrine tag at RAMP enabling signal measurement from CTR:RAMP heterodimers. B-D, Real-time kinetic CTR:RAMP proximity BRET was measured for co-expressed B, CTR and RAMP1 (AMY1R), C, CTR and RAMP2 (AMY2R), D, CTR and RAMP3 (AMY3R). Baseline was established for the first 5 min followed by agonist addition at 300 nM as indicated by the arrow. E, F, CTR:RAMP1 (AMY1R) and CTR:RAMP3 (AMY3R) in the endpoint concentration-response format. See Supplementary Data Table S3 for summary of pEC50 values. G, Real-time kinetic reversibility for co-expressed CTR:RAMP1 (AMY1R) with first addition of rAmy or hCT at 50 nM followed by second addition of 1 μM hCT/sCT or 1 μM rAmy/αCGRP respectively. All plots show a representative of three independent experiments at room temperature with duplicate technical replicates. Error bars show the SD for technical replicates.
Figure 4.
Figure 4.. miniGs and heterotrimeric G protein coupling BRET assays for the AMY1R, AMY2R, AMY3R and CTR in live 3GKO HEK293 or permeabilized HEK293 cells.
A, G, Cartoon depicting the positions of the Rluc8 donor and Venus acceptor used to isolate BRET signal from CTR:RAMP heterodimers in the two assay formats. B-E, Venus-miniGs recruitment to AMY1R (CTR:RAMP1-Rluc8), AMY2R (CTR:RAMP2-Rluc8), AMY3R (CTR:RAMP3-Rluc8) and CTR (CTR-Rluc8) in response to peptide agonist treatment; error bars show standard deviation for technical replicates. F, scatter plot summarizing pEC50 for each receptor–peptide combination as mean ± SEM from four independent replicates. H-K, Agonist mediated heterotrimeric G protein coupling to AMY1R (CTR:RAMP1-Rluc8), AMY2R (CTR:RAMP2-Rluc8), AMY3R (CTR:RAMP3-Rluc8) and CTR (CTR-Rluc8); error bars show standard deviation for technical replicates. L, Scatter plot summarizing pEC50 for each receptor–peptide combination as mean ± SEM from four independent replicates. Star indicates significance as compared with all other combinations determined by one-way ANOVA with Tukey’s post hoc test. See Supplementary Data Table 4 for summary of pEC50 values. Representative plots from a single replicate are shown for the concentration-response curves.
Figure 5.
Figure 5.. Thermostabilities of the AMYRs and cAMP signaling phenotypes in cells co-expressing CTR and wild-type or chimeric RAMPs.
A-C, Stability of AMY1R (A), AMY2R (B), AMY3R (C) by native PAGE thermostability assay. Each gel is a representative unmodified image chosen out of three independent experiments and imaged for mCitrine fluorescence. D, Scatter plot summarizing fraction heterodimer for AMY1R, AMY2R, AMY3R from A-C at 4°C (lane 1) as mean ± SEM from three independent replicates. E, Quantitation of AMY1R, AMY2R, and AMY3R band disappearance by densitometry. Representative plot from a single replicate is shown. E, Scatter plot summarizing melting temperature (Tm) for AMY1R Tm = 28.72°C ± 0.1, AMY2R Tm = 28.73°C ± 0.17, AMY3R Tm = 39.2°C ± 0.39 as mean ± SEM from three independent replicates. G-K, Concentration-response cAMP signaling phenotype in COS-7 cells transiently expressing G, CTR alone, H, CTR+RAMP1, I, CTR+RAMP3, J, CTR+RAMP3wR1 TMD, K, CTR+RAMP3wR1 ECD by cAMP CAMYEL biosensor BRET assay after 30 min agonist stimulation at 37°C. Error bars show standard deviation for technical replicates. Representative plots from a single replicate are shown. L, Scatter plot summarizing pEC50 for each receptor–peptide combination as mean ± SEM from three independent replicates. Star indicates significance as compared with all other combinations determined by one-way ANOVA with Tukey’s post hoc test. See Supplementary Data Table S5 for summary of pEC50 values. Model for M, CTR:RAMP1 and N, CTR:RAMP3 subunit equilibrium at the cell surface in the absence or presence of the indicated peptide agonists.

References

    1. Boyle C. N., Zheng Y., Lutz T. A., Mediators of Amylin Action in Metabolic Control. Journal of clinical medicine 11, (2022). - PMC - PubMed
    1. Foll C. L., Lutz T. A., Systemic and Central Amylin, Amylin Receptor Signaling, and Their Physiological and Pathophysiological Roles in Metabolism. Comprehensive Physiology 10, 811–837 (2020). - PubMed
    1. Pioszak A. A., Hay D. L., RAMPs as allosteric modulators of the calcitonin and calcitonin-like class B G protein-coupled receptors. Adv Pharmacol 88, 115–141 (2020). - PMC - PubMed
    1. Christopoulos G., Perry K. J., Morfis M., Tilakaratne N., Gao Y., Fraser N. J., Main M. J., Foord S. M., Sexton P. M., Multiple amylin receptors arise from receptor activity-modifying protein interaction with the calcitonin receptor gene product. Molecular pharmacology 56, 235–242 (1999). - PubMed
    1. Tilakaratne N., Christopoulos G., Zumpe E. T., Foord S. M., Sexton P. M., Amylin receptor phenotypes derived from human calcitonin receptor/RAMP coexpression exhibit pharmacological differences dependent on receptor isoform and host cell environment. The Journal of pharmacology and experimental therapeutics 294, 61–72 (2000). - PubMed

Publication types

LinkOut - more resources