[Preprint]. 2024 Oct 12:2024.10.11.617893.
doi: 10.1101/2024.10.11.617893.

Amplification of olfactory transduction currents implements sparse stimulus encoding

Affiliations

Amplification of olfactory transduction currents implements sparse stimulus encoding

Kai Clane Belonio et al. bioRxiv. .

Update in

Abstract

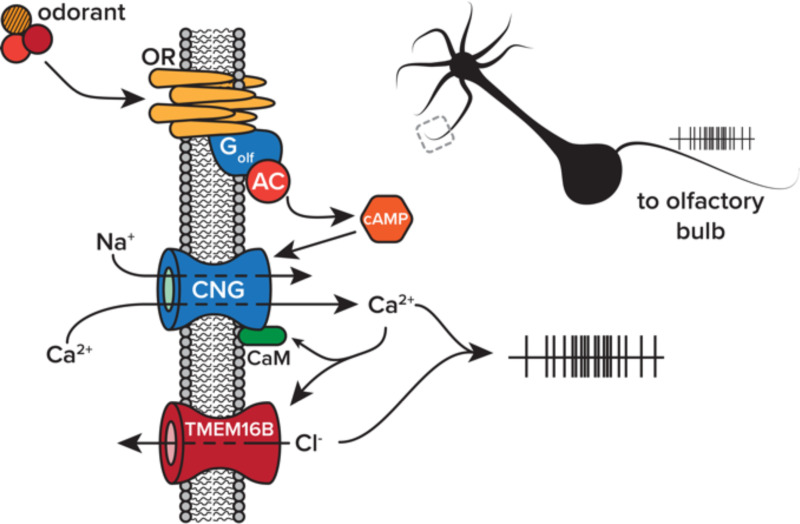
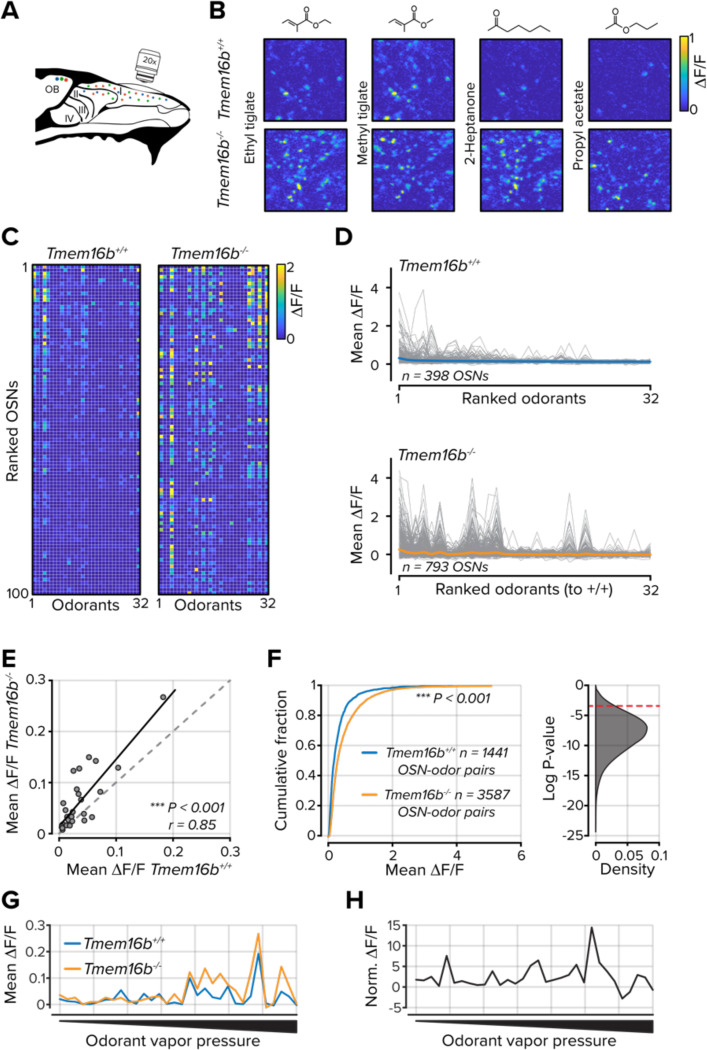
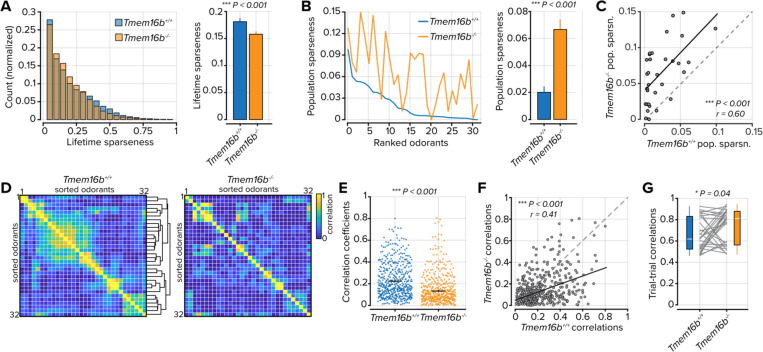
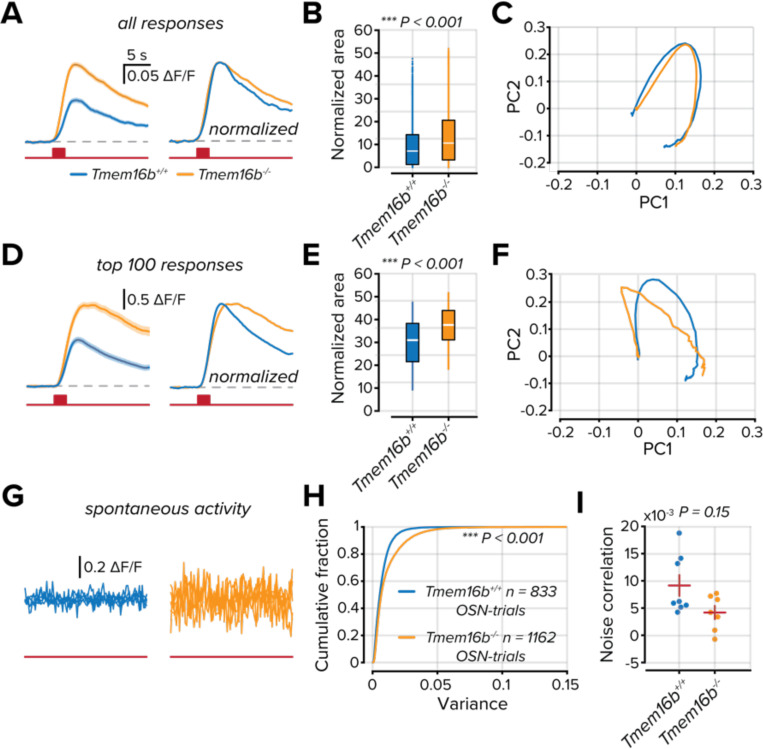
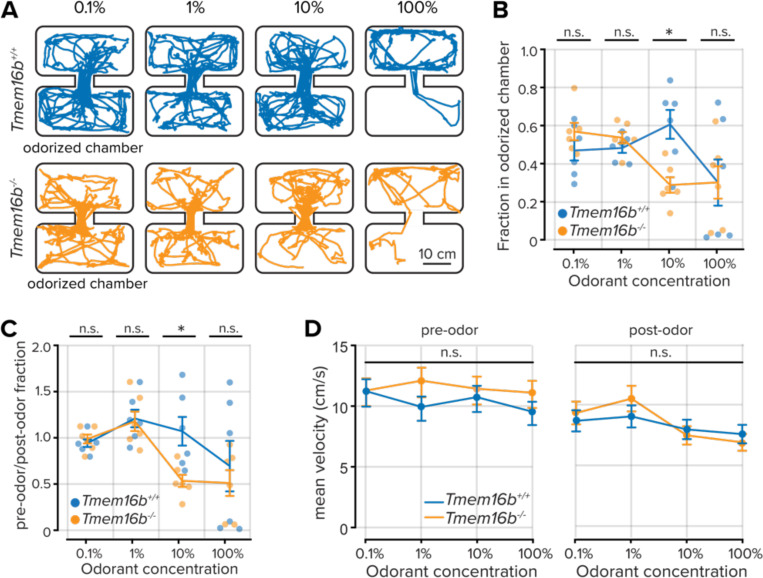
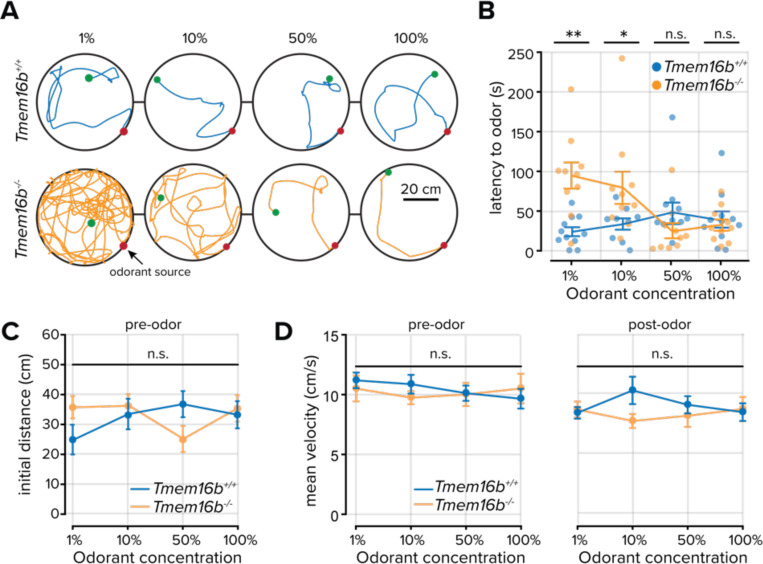
Sensory systems must perform the dual and opposing tasks of being sensitive to weak stimuli while also maintaining information content in dense and variable sensory landscapes. This occurs in the olfactory system, where OSNs are highly sensitive to low concentrations of odors and maintain discriminability in complex odor environments. How olfactory sensory neurons (OSNs) maintain both sensitivity and sparsity is not well understood. Here, we investigated whether the calcium-activated chloride channel, TMEM16B, may support these dual roles in OSNs. We used multiphoton microscopy to image the stimulus-response density of OSNs in the olfactory epithelium. In TMEM16B knockout mice, we found that sensory representations were denser, and the magnitude of OSN responses was increased. Behaviorally, these changes in sensory representations were associated with an increased aversion to the odorant trimethylamine, which switches perceptual valence as its concentration increases, and a decreased efficiency of olfactory-guided navigation. Together, our results indicate that the calcium-activated chloride channel TMEM16B sparsens sensory representations in the peripheral olfactory system and contributes to efficient integrative olfactory-guided behaviors.


Conflict of interest statement

Competing Interests Statement The authors declare no competing interests.

Figures

Figure 1.
Figure 1.. Olfactory transduction cascade.
Volatilized odorant molecules activate a biochemical and electrochemical transduction cascade in olfactory sensory neurons. The final step of the cascade, efflux of chloride through TMEM16B, amplifies transduction currents through cyclic nucleotide gate (CNG) channels. Abbreviations, olfactory receptor (OR), adynyl cyclase III (AC), cyclic adenosine monophosphate (cAMP), calmodulin (CaM).
Figure 2.
Figure 2.. TMEM16B limits OSN activity in the olfactory epithelium.
A. Schematic of olfactory epithelium imaging. B. Example ΔF/F images from the olfactory epithelium in Tmem16b+/+ and Tmem16b−/− mice for four odorants. C. Mean ΔF/F signals for each of 32 odorants in 100 randomly selected OSNs. Data are ranked to the mean of all odorants. D. Tuning curves for each OSN (gray lines). The mean of all OSNs is shown as the colored lines. E. Scatter plot of mean ΔF/F values for each of 32 odorants. F. Left, the cumulative distribution of all OSN-odorant pairs. Right, distribution of 50,000 bootstrapped P values from the distributions at left. The dashed red line indicates a P value of 0.05. G. Mean responses for each odorant rank-ordered to odorant vapor pressure. H. Tmem16b−/− OSN responses normalized to Tmem16b+/+ OSNs and ranked by odorant vapor pressure.
Figure 3.
Figure 3.. Odorant tuning and representations in OSNs.
A. Left, distribution of lifetime sparseness values for each OSN. Right, average lifetime sparseness. The error bars represent the standard error of the mean. B. Left, population sparseness for each of 32 odorants rank-ordered to Tmem16b+/+ OSNs. Right, mean population sparseness. C. Scatter plot of the relationship between population sparseness for each odorant in Tmem16b+/+ OSNs and Tmem16b−/− OSNs. D. Odorant-odorant correlations in Tmem16b+/+ OSNs and Tmem16b−/− OSNs. White lines bound individual odorants, containing three to seven trials. Hierarchical clustering was used to group similar odorants in Tmem16b+/+ OSNs, and the clusters were then used to group datasets in Tmem16b−/− OSNs. E. Odorant-odorant correlation coefficients from part D. Black lines represent the mean and the standard error of the mean. F. Scatter plot of the relationship between odorant-odorant correlations in Tmem16b+/+ and Tmem16b−/− OSNs. G. Trial-to-trial correlation values for each of the 32 odorants. The white line represents the median.
Figure 4.
Figure 4.. TMEM16B attenuates the temporal dynamics of OSN activation.
A. Mean responses of all modulated OSN responses. Right, peak normalized mean OSN responses. The solid line is the mean response, and the shaded area is the standard error of the mean. The red line below indicates the entire duration of the trial, and the red box corresponds to a 2 s odorant delivery period. B. Area measured from the peak normalized OSN responses. The white line represents the median. C. Plot of the first two principal components from peak normalized OSN responses. D-F. Same as part A-C but considering only the 100 largest responses from each group. G. Five overlaid traces from separate OSNs from no odorant trials. The red line below indicates the trial duration. H. Cumulative distribution of the variance measured in the ΔF/F signals from all OSNs in no odorant trials. I. Correlations between OSNs in each imaging field on no odorant trials. The red horizontal line represents the mean, and the vertical line represents the standard error of the mean.
Figure 5.
Figure 5.. Shifted perceptual thresholds in Tmem16b−/− mice.
A. Locomotor paths of example Tmem16b+/+ and Tmem16b−/− mice at increasing concentrations of the odorant trimethylamine. B. Plot of the fraction of time spent in the odorized chamber for each odorant concentration. Lines are the mean data, and error bars represent the standard error of the mean. C. Plot of the relative time fraction spent in the odorized chamber before and during odorant delivery for each odorant concentration. Lines are the mean data, and error bars represent the standard error of the mean. D. Mean velocity of each animal prior to and following odor onset (P > 0.05, Wilcoxon rank-sum test). Lines are the mean data, and error bars represent the standard error of the mean.
Figure 6.
Figure 6.. Odorant source localization in Tmem16b+/+ and Tmem16b−/− mice.
A. Locomotor paths of example Tmem16b+/+ and Tmem16b−/− mice at increasing concentrations of the odorant peanut oil. Green and red dots mark the initial and final position of each animal, respectively. B. Plot of the time to locate the odorant for each concentration. Lines are the mean data, and error bars represent the standard error of the mean. C. Initial distance from the odorant source (at odor onset) across all animals (P > 0.05, Wilcoxon rank-sum test). Lines are the mean data, and error bars represent the standard error of the mean. D. Mean velocity of each animal prior to and following odor onset (P > 0.05, Wilcoxon rank-sum test) Lines are the mean data, and error bars represent the standard error of the mean.

Similar articles

References

    1. Albeanu DF, Provost AC, Agarwal P, Soucy ER, Zak JD, Murthy VN. Olfactory marker protein (OMP) regulates formation and refinement of the olfactory glomerular map. Nature Communications 9: 5073, 2018. - PMC - PubMed
    1. Arevian AC, Kapoor V, Urban NN. Activity-dependent gating of lateral inhibition in the mouse olfactory bulb. Nature Neuroscience 11: 80–87, 2008. - PMC - PubMed
    1. Aungst JL, Heyward PM, Puche AC, Karnup SV, Hayar A, Szabo G, Shipley MT. Centre-surround inhibition among olfactory bulb glomeruli. Nature 426: 623–629, 2003. - PubMed
    1. Betkiewicz R, Lindner B, Nawrot MP. Circuit and Cellular Mechanisms Facilitate the Transformation from Dense to Sparse Coding in the Insect Olfactory System. eneuro 7: ENEURO.0305-18.2020, 2020. - PMC - PubMed
    1. Billig GM, Pál B, Fidzinski P, Jentsch TJ. Ca2+-activated Cl− currents are dispensable for olfaction. Nature neuroscience 14: 763–769, 2011. - PubMed

Publication types

LinkOut - more resources