[Preprint]. 2024 Oct 12:2023.02.19.529146.
doi: 10.1101/2023.02.19.529146.

Evolution of promoter-proximal pausing enabled a new layer of transcription control

Affiliations

Evolution of promoter-proximal pausing enabled a new layer of transcription control

Alexandra G Chivu et al. bioRxiv. .

Abstract

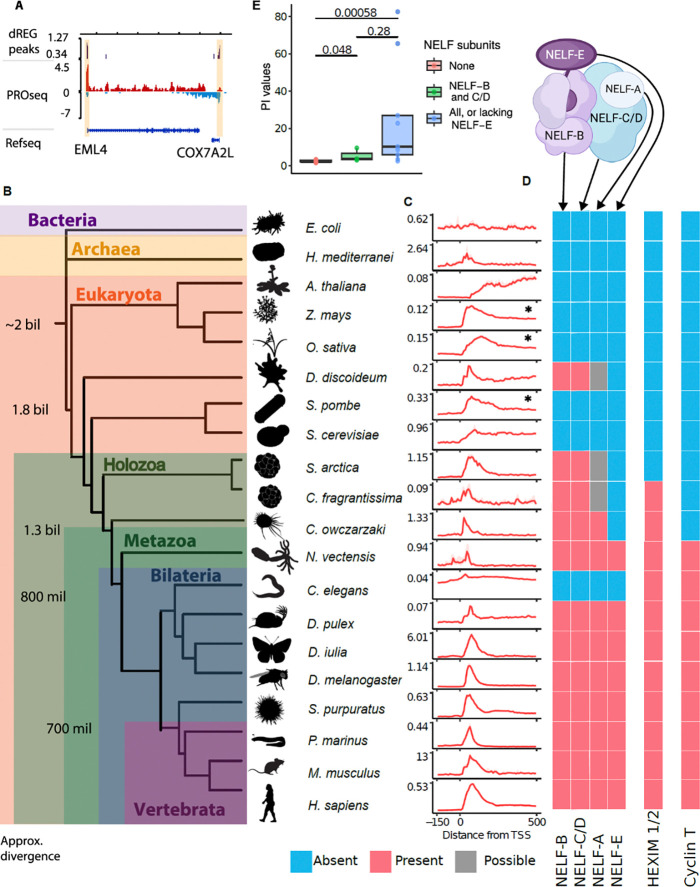
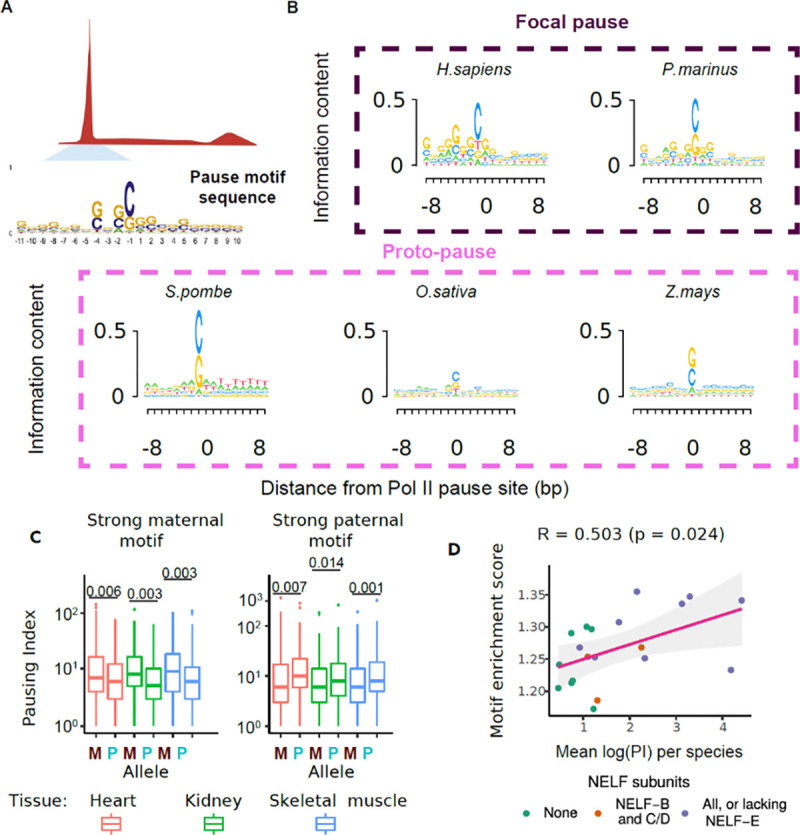
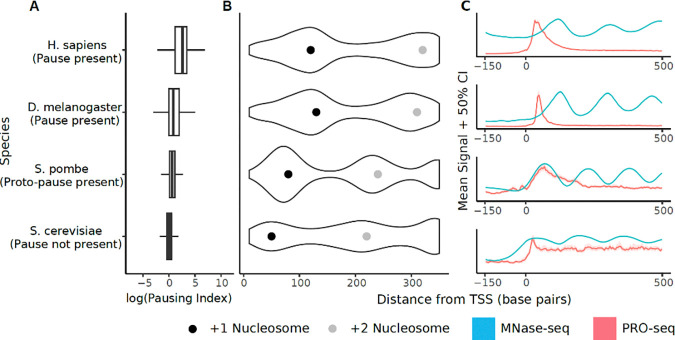
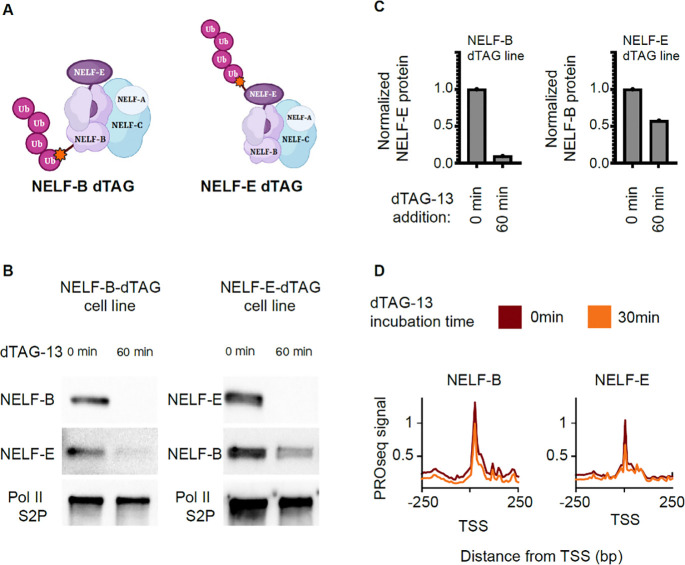
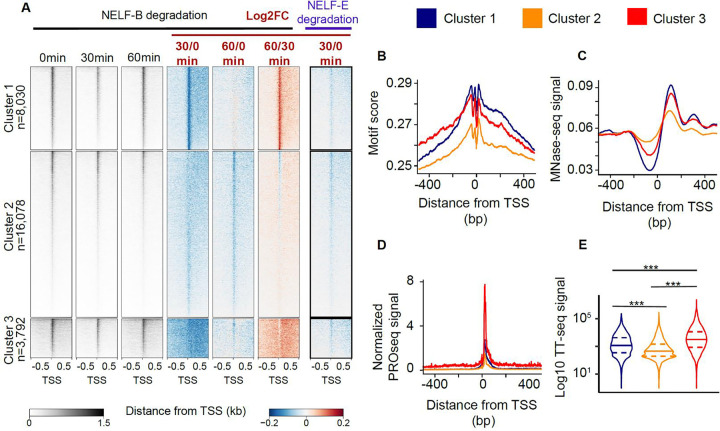
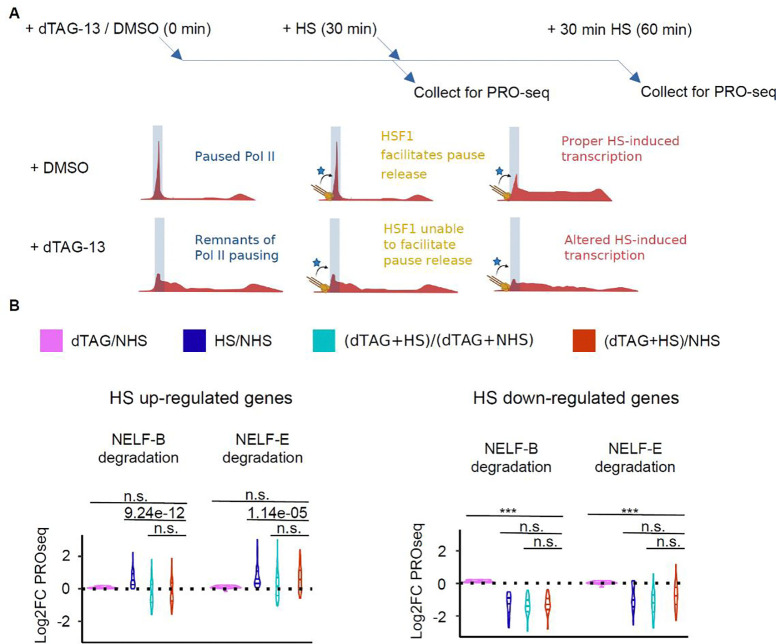
Promoter-proximal pausing of RNA polymerase II (Pol II) is a key regulatory step during transcription. Despite the central role of pausing in gene regulation, we do not understand the evolutionary processes that led to the emergence of Pol II pausing or its transition to a rate-limiting step actively controlled by transcription factors. Here we analyzed transcription in species across the tree of life. Unicellular eukaryotes display a slow acceleration of Pol II near transcription start sites that transitioned to a longer-lived, focused pause in metazoans. This event coincided with the evolution of new subunits in the NELF and 7SK complexes. Depletion of NELF in mammals shifted the promoter-proximal buildup of Pol II from the pause site into the early gene body and compromised transcriptional activation for a set of heat shock genes. Our work details the evolutionary history of Pol II pausing and sheds light on how new transcriptional regulatory mechanisms evolve.


Conflict of interest statement

Competing Interests Statement The authors declare no competing interests.

Figures

Figure 1:
Figure 1:. The evolution of NELF subunits is associated with pausing.
(A) Depiction of a PRO-seq track where red and blue represent reads mapped to the plus and minus strands, respectively. dREG peaks are marked in purple and pause regions are highlighted in yellow. (B) Schematic depicting the relationships between the 20 species included in this study. Divergence times were taken from Parfrey et al. and Roger et al.. (C) Metaprofiles of PRO-seq data were collected in each species. The dotted line marks the position of TSSs. The 25–75% confidence intervals are depicted in transparent red. Species which show proto-pausing indicated by *, vertical axis represents the mean PRO-seq signal. (D) Cartoon depicting internal interactions in the NELF complex based on the crystal structure in above colored blocks denote the presence (red), absence (blue), or possible presence (gray) of the human orthologues of NELF subunits in each species as inferred from reciprocal blast searches. (E) Box and whiskers plot of pausing indexes in each species. Boxes are clustered by the number of NELF subunits in each species. A Mann-Whitney test was used to compute p-values.
Figure 2:
Figure 2:. Genomic features are associated with pausing.
(A) Schematic of a motif search at the Pol II pause site including the human pause motif sequence as published in Watts et al. (B) DNA sequence motif under the active site of paused Pol II in organisms with a focal pause or a proto-pause. The size of each base is scaled by information content. (C) Boxplot of pausing indexes for genes with stronger pause motif on the maternal (left) or paternal (right) alleles in F1 hybrid mice. (D) Scatter plot denotes the enrichment of the motif score relative to flanking DNA and the mean pausing index in each species. Each dot is colored by the number of NELF subunits found in each sample. We fit a linear regression to derive the R2 and the p-value.
Figure 3:
Figure 3:. Nucleosome positioning is associated with pausing.
(A) Boxplot of pausing indexes for selected species representative of paused (H. sapiens, D. melanogaster), proto-paused (S. pombe), and unpaused (S. cerevisiae) (B) Violin plot of MNase-Seq data with the most common +1 (black) and +2 (gray) nucleosome positions marked with a dot. Species with a high pausing index show downstream +1 nucleosome positioning. Species with no pausing or proto-pausing show further upstream +1 nucleosome. (C) Metaplot of PRO-seq signal (red) alongside MNase signal (blue). The pause in H. sapiens and D. melanogaster occurs at a position distinct from the +1 nucleosome while the position of a proto-pause coincides with the +1 nucleosome. In S. cerevisiae, the +1 nucleosome overlaps with the TSS.
Figure 4:
Figure 4:. NELF degradation destabilized RNA Pol II pausing.
(A) Schematic of NELF-B or NELF-E degradation mESC cell lines. (B) Western blots depict NELF-B, NELF-E and Pol II after the degradation of either NELF-B (left) or NELF-E (right) using 500nM dTAG-13. (C) Quantification of NELF-E western blot signal after NELF-B degradation (left) and NELF-B after NELF-E degradation (right). (D) Meta profiles of PRO-seq signal at 0min (red) and 30min (orange) after the degradation of NELF-B (left) or NELF-E (right).
Figure 5:
Figure 5:. NELF degradation leads to different pause recovery profiles.
(A) Heat maps of spike-in normalized PRO-seq signal after NELF-B or NELF-E degradation (left). Log2 fold changes of normalized PRO-seq signal relative to untreated controls are also depicted. (B-D) Pause motif enrichment scores (B), Meta profile of MNase-seq signal (C) and normalized PRO-seq signal (D) are depicted for three clusters of genes defined in panel (A). (E) Violin plots of log10 TT-seq signal in the three clusters defined in (A). A two-sided Mann-Whitney test was used to compute p-values. (***) defines p-values < 2.2e-16
Figure 6:
Figure 6:. Removing paused Pol II prevents activation of genes by HSF1 after HS stimulation.
(A) Time course of dTAG-13 drug treatment followed by heat shock (HS) (left) and cartoon depicting mechanisms of HSF1 action on Pol II pausing (right). HSF1 is depicted in yellow, while other cofactors that assist in pause release are depicted by the blue star. (B) Violin plots of log2 fold changes in PRO-seq signal in the gene-bodies (TSS +300, TES −300) for HS-upregulated (left) and downregulated (right) genes. A two-sided Mann-Whitney test was used to compute p-values, where n.s. Defines non-significant p-values, and (***) p-values < 2.2e-16.

References

    1. Scholes C., DePace A.H., and Sánchez Á. (2017). Combinatorial Gene Regulation through Kinetic Control of the Transcription Cycle. Cell Syst 4, 97–108.e9. - PMC - PubMed
    1. Mikhailov K.V., Konstantinova A.V., Nikitin M.A., Troshin P.V., Rusin L.Y., Lyubetsky V.A., Panchin Y.V., Mylnikov A.P., Moroz L.L., Kumar S., et al. (2009). The origin of Metazoa: a transition from temporal to spatial cell differentiation. Bioessays 31, 758–768. - PubMed
    1. Arenas-Mena C. (2010). Indirect development, transdifferentiation and the macroregulatory evolution of metazoans. Philos. Trans. R. Soc. Lond. B Biol. Sci. 10.1098/rstb.2009.0253. - DOI - PMC - PubMed
    1. Arenas-Mena C. (2017). The origins of developmental gene regulation. Evol. Dev. 19, 96–107. - PubMed
    1. Core L., and Adelman K. (2019). Promoter-proximal pausing of RNA polymerase II: a nexus of gene regulation. Genes Dev. 33, 960–982. - PMC - PubMed

Publication types

LinkOut - more resources