[Preprint]. 2025 Mar 27:2024.10.10.617517.
doi: 10.1101/2024.10.10.617517.

Cardiolipin deficiency disrupts electron transport chain to drive steatohepatitis

Affiliations

Cardiolipin deficiency disrupts electron transport chain to drive steatohepatitis

Marisa J Brothwell et al. bioRxiv. .

Abstract

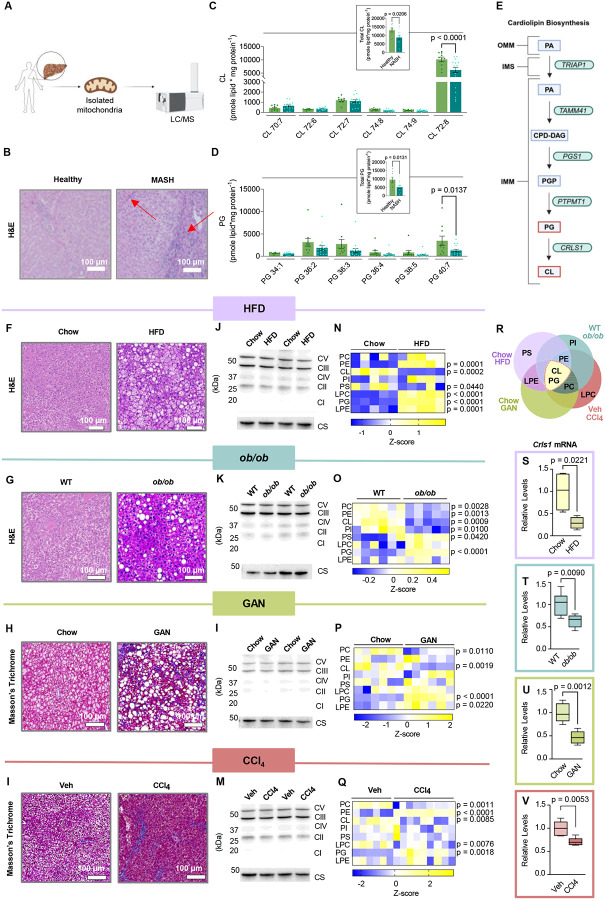
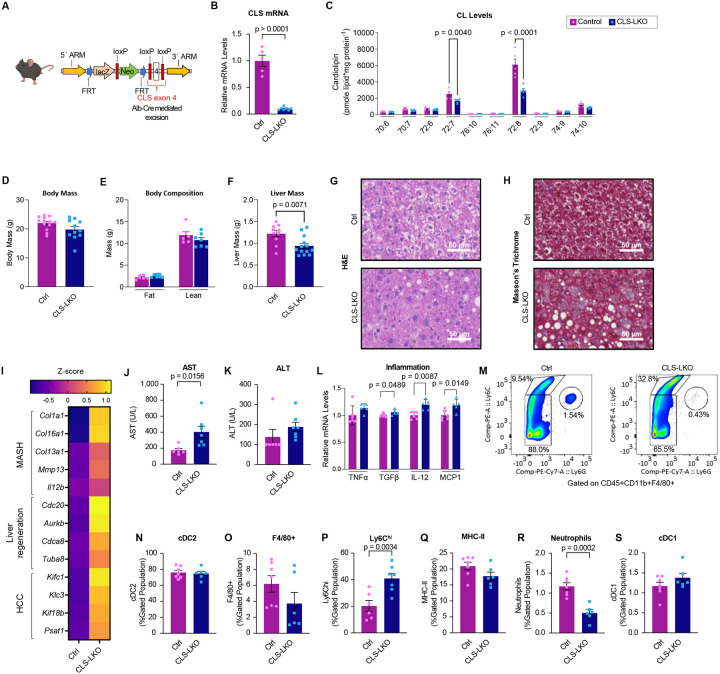
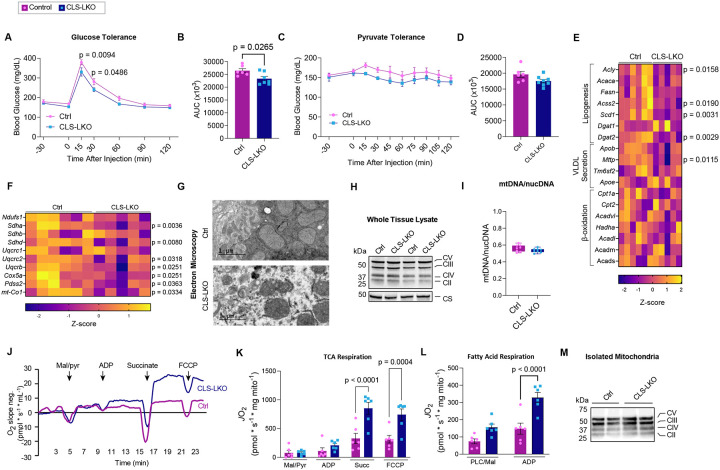
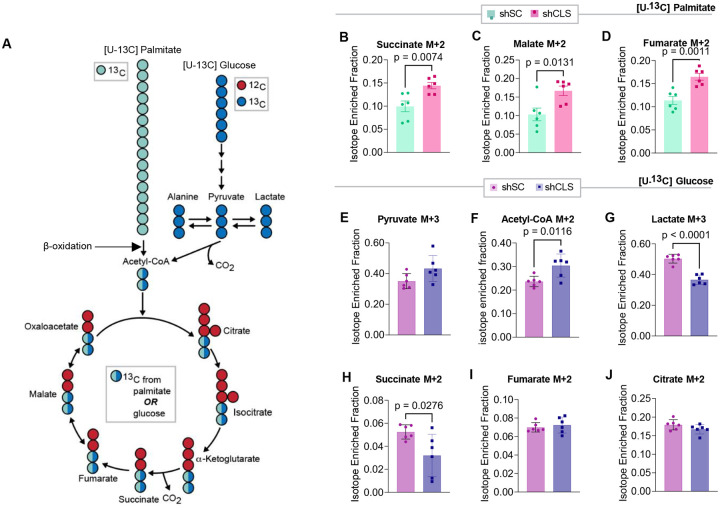
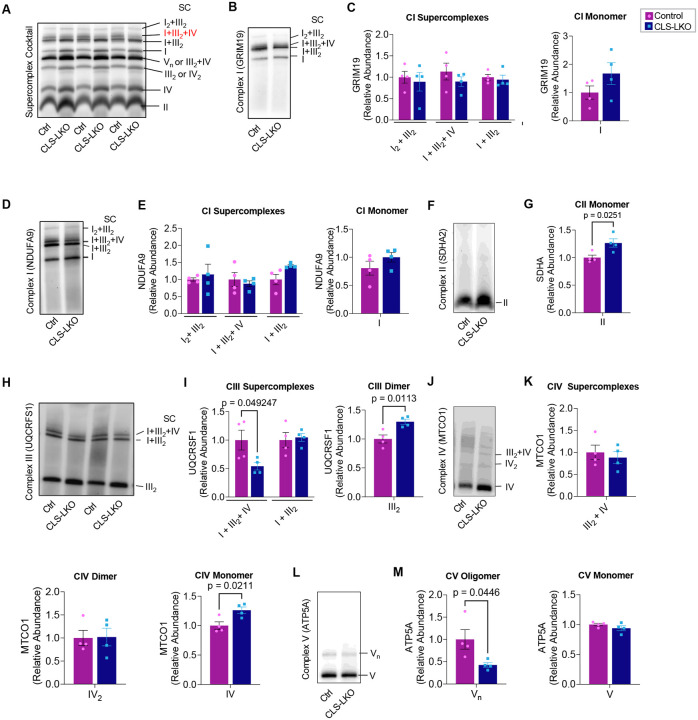
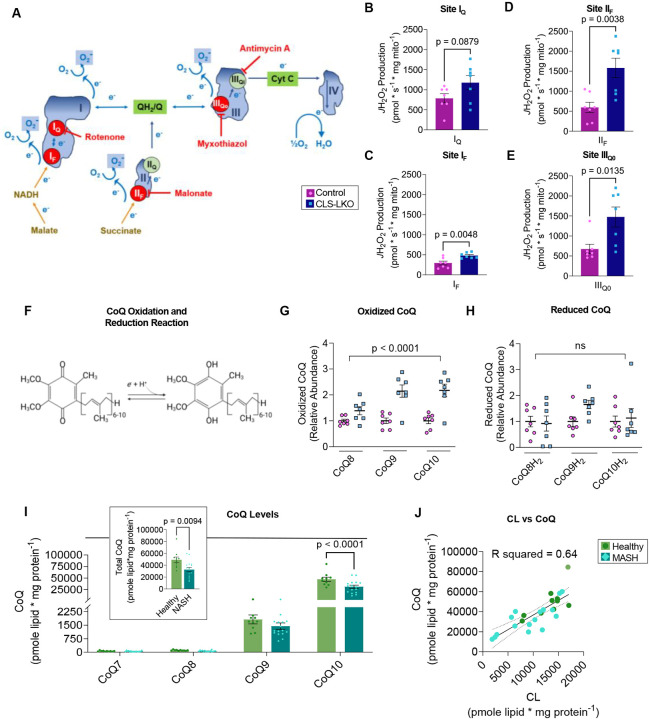
Metabolic dysfunction-associated steatotic liver disease (MASLD) is a progressive disorder marked by lipid accumulation, leading to metabolic dysfunction-associated steatohepatitis (MASH). A key feature of the transition to MASH involves oxidative stress resulting from defects in mitochondrial oxidative phosphorylation (OXPHOS). Here, we show that pathological alterations in the lipid composition of the inner mitochondrial membrane (IMM) directly instigate electron transfer inefficiency to promote oxidative stress. Specifically, mitochondrial cardiolipin (CL) was downregulated with MASLD/MASH in humans and in mice. Hepatocyte-specific CL synthase knockout (CLS-LKO) led to spontaneous and robust MASH with extensive steatotic and fibrotic phenotype. Loss of CL paradoxically increased mitochondrial respiratory capacity but also reduced the formation of I+III2+IV respiratory supercomplex, promoted electron leak primarily at sites IIIQO and IIF of the electron transport chain, and disrupted the propensity of coenzyme Q (CoQ) to become reduced. Thus, low mitochondrial CL disrupts electron transport chain to promote oxidative stress and contributes to pathogenesis of MASH.


Conflict of interest statement

Competing interests: the authors declare no competing interests.

Figures

Figure 1.
Figure 1.. Hepatic mitochondrial phospholipidome in models of MASLD/MASH
(a) Schematic for mitochondrial phospholipidomic analyses in human liver samples. (b) Representative H&E staining of healthy or MASH livers. Arrows indicate fibrotic liver tissue. (c, d) Hepatic mitochondrial CL and PG levels in healthy controls or individuals with MASH (n=10 and 16 per group). (e) Pathway for CL biosynthesis. (f–i) Representative H&E and Masson’s Trichrome staining of livers from mice under various MAFLD conditions: chow vs. Western HFD (16 wks), wildtype vs. ob/ob (20 wks), chow vs. GAN diet (30 wks), and vehicle vs. carbon tetrachloride (6 wks). (j–m) Western blot of OXPHOS subunits and citrate synthase in liver tissues from the same MAFLD models. (n–q) Heatmaps of hepatic mitochondrial phospholipidomes from the same MAFLD models. (r) Venn diagram comparing hepatic mitochondrial phospholipidomes across all four MASLD models. (s–v) CLS mRNA levels in livers from the same MAFLD models (n=4–6 per group). Statistical significance was determined by 2-way ANOVA with within-row pairwise comparison (c, d, n–q) and unpaired, two-sided Student’s t-test (c, d total lipid panels, s–v). All measurements were taken from distinct samples.
Figure 2.
Figure 2.. Hepatocyte-specific deletion of CLS induces MASLD/MASH
(a) Schematic for hepatocyte-specific deletion of CLS in mice. (b, c) CLS mRNA and mitochondrial CL levels in livers from control or CLS-LKO mice (n=5–7 per group). (d–f) Body mass, body composition, and liver mass of control or CLS-LKO mice (n=6–13 per group). (g, h) Representative H&E and Masson’s Trichrome staining of livers from control or CLS-LKO mice. (i) RNAseq-derived heatmap of select genes associated with MASH, liver regeneration, and HCC (n=5–7 per group). (j, k) Serum AST and ALT levels (n=6–7 per group). (l) mRNA levels of TNFα, TGFβ, IL-12, and MCP1 in livers from control or CLS-LKO mice (n=5–7 per group). (m) Representative flow cytometry gating for liver cell populations in control or CLS-LKO mice. (n–s) Quantification of cDC2, F4/80+, Ly6Chi inflammatory monocytes, MHC-II+, neutrophils, and cDC1 cell populations in livers (n=5–7 per group). All results are from mice fed standard chow. Statistical significance was determined by 2-way ANOVA with within-row pairwise comparison (c, l) and unpaired, two-sided Student’s t-test (b, d–f, i [adjusted for FDR], and j–s). Data represent mean ± SEM (b–f, j–l, n–s). All measurements were taken from distinct samples.
Figure 3.
Figure 3.. CLS deletion increases mitochondrial respiratory capacity
(a, b) Glucose tolerance test (IPGTT) and area under the curve (AUC) for control or CLS-LKO mice fed standard chow (n=6–7 per group). (c, d) Pyruvate tolerance test (PTT) and AUC (n=6–8 per group). (e, f) RNAseq-derived heatmaps of genes associated with lipogenesis, VLDL, β-oxidation, and ETS complex structure/function (n=5–6 per group). (g) Representative electron microscopy images of liver mitochondria from control or CLS-LKO mice. (h) Western blot of whole liver lysate using OXPHOS cocktail and citrate synthase for control or CLS-LKO mice. (i) Mitochondrial-to-nuclear DNA ratio in liver tissue from control or CLS-LKO mice (n=8 per group). (j) Representative tracing from high-resolution respirometry during maximal respiration using TCA cycle intermediates. (k, l) JO2 consumption in isolated liver mitochondria from control or CLS-LKO mice in response to malate, pyruvate, ADP, succinate, FCCP (k), or palmitoyl-carnitine, malate, and ADP (l) (n=6 per group). (m) Western blot of isolated mitochondria from livers of control or CLS-LKO mice using OXPHOS cocktail. All results are from mice fed standard chow. Statistical significance was determined by 2-way ANOVA with within-row pairwise comparison (a, c, k, l) and unpaired, two-sided Student’s t-test (b, d, e, f [adjusted for FDR], and i). Data represent mean ± SEM (a–d, k, l). Data in box-and-whiskers plot (i) represent median with min-to-max. All measurements were taken from distinct samples.
Figure 4.
Figure 4.. Stable isotope tracing with [U-13C] palmitate and [U-13C] glucose in hepa1–6 cells with or without CLS deletion
(a) Schematic of stable isotope tracing with [U-13C] palmitate or [U-13C] glucose, showing key intermediates in β-oxidation and the TCA cycle. (b–d) Levels of labeled succinate, malate, and fumarate from palmitate tracing in hepa1–6 cells without (shSC) or with CLS deletion (shCLS) (n=6 per group). (e–j) Levels of labeled pyruvate, acetyl-CoA, lactate, succinate, fumarate, and citrate from glucose tracing in hepa1–6 cells without or with CLS deletion (n=6 per group). Statistical significance was determined by unpaired, two-sided Student’s t-test. Data represent mean ± SEM. All measurements were taken from distinct samples.
Figure 5.
Figure 5.. CL deficiency promotes mitochondrial electron leak
(a) Representative electron microscopy images of liver fibrosis in control or CLS-LKO mice (red arrows). (b) mRNA levels of fibrotic markers (Col1a1 and Desmin) in liver tissues (n=5–7 per group). (c–f) Levels of cleaved caspase-3, cleaved caspase-7, mitochondrial cytochrome c, and cytosolic cytochrome c in liver tissues (n=4–7 per group). (g) H2O2 emission in isolated liver mitochondria stimulated with succinate, or succinate with auranofin and BCNU (n=3–4 per group). (h) Schematic of small unilamellar vesicles (SUVs) containing cardiolipin (CL) or phosphatidylcholine (PC) for mitochondrial enrichment. (i) H2O2 production in liver mitochondria enriched with CL or PC SUVs (n=4 per group). All results are from mice fed standard chow. Statistical significance was determined by 2-way ANOVA with within-row pairwise comparison (b, g, i) and unpaired, two-sided Student’s t-test (c–f). Data represent mean ± SEM. All measurements were taken from distinct samples.
Figure 6.
Figure 6.. Influence of CL deficiency on respiratory supercomplex formation
(a–j) Representative western blots of respiratory supercomplexes in isolated liver mitochondria from control or CLS-LKO mice, detected using antibodies for supercomplexes, monomers, dimers, or oligomers, GRIM19/complex I (b), NDUFA9/complex I (d), SDHA2/complex II (f), UQCRFS1/complex III (h), MTCO1/complex IV (j), and ATP5A/complex V (l). Complex II is not thought to form respiratory supercomplexes. (c, e, g, i, k, m) Quantification of blots (n=4 per group). All results are from mice fed standard chow. Statistical significance was determined by 2-way ANOVA with within-row pairwise comparison (first panels in c, e, i, k) and unpaired, two-sided Student’s t-test (second panels in c, e, g, i, k, and both panels in m). Data represent mean ± SEM. All measurements were taken from distinct samples.
Figure 7.
Figure 7.. CL deficiency disrupts coenzyme Q homeostasis in humans and mice
(a) Schematic of site-specific electron leak. (b–e) Electron leak at sites IQ, IF, IIF, and IIIQ0 in liver mitochondria from control or CLS-LKO mice (n=7 per group). (f) Oxidized CoQ (ubiquinone) can be reduced to CoQH2 (ubiquinol). (g, h) Oxidized and reduced CoQ levels in isolated liver mitochondria from control or CLS-LKO mice (n=7 per group). (i) CoQ levels in liver mitochondria from healthy human controls or patients with advanced steatohepatitis (n=10 and 16 per group). (j) Pearson correlation of CL and CoQ levels in human liver samples (R2 = 0.64). Data in (b–e, g, h) are from mice fed standard chow. Statistical significance was determined by unpaired, two-sided Student’s t-test (b–e, panel of total levels in i) and 2-way ANOVA with within-row pairwise comparison (g, h, i). Data represent mean ± SEM (b–e, g, h, i). All measurements were taken from distinct samples.

References

    1. Younossi Z.M., et al. Global epidemiology of nonalcoholic fatty liver disease—Meta-analytic assessment of prevalence, incidence, and outcomes. Hepatology 64, 73–84 (2015). - PubMed
    1. Miao L.T., Giovanni; Byrne, Christopher D; Cao, Ying-Ying; Zheng, Ming-Hua. Current status and future trends of the global burden of MASLD. Trends in Endocrinology & Metabolism 29, 1043–2760 (2024). - PubMed
    1. Saito K., et al. Characterization of hepatic lipid profiles in a mouse model with nonalcoholic seatohepatitis and subsequent fibrosis. Scientific Reports 5(2015). - PMC - PubMed
    1. John B.S.S. Nonalcoholic Steatohepatitis (NASH). in StatPearls (StatPearls Publishing, Treasure Island, 2023). - PubMed
    1. Vigano L., Lleo A. & Aghemo A. Non-alcoholic fatty liver disease, non-alcoholic steatohepatitis, metabolic syndrome and hepatocellular carcinoma—a composite scenario. Hepatobiliary Surgery and Nutrition 7, 130–133 (2018). - PMC - PubMed

Publication types

LinkOut - more resources