[Preprint]. 2024 Oct 9:2024.10.09.617407.
doi: 10.1101/2024.10.09.617407.

Mesoscale regulation of MTOCs by the E3 ligase TRIM37

Affiliations

Mesoscale regulation of MTOCs by the E3 ligase TRIM37

Zhong Y Yeow et al. bioRxiv. .

Update in

Abstract

Centrosomes ensure accurate chromosome segregation during cell division. Although the regulation of centrosome number is well-established, less is known about the suppression of non-centrosomal MTOCs (ncMTOCs). The E3 ligase TRIM37, implicated in Mulibrey nanism and 17q23-amplified cancers, has emerged as a key regulator of both centrosomes and ncMTOCs. Yet, the mechanism by which TRIM37 achieves enzymatic activation to target these mesoscale structures had remained unknown. Here, we elucidate TRIM37's activation process, beginning with TRAF domain-directed substrate recognition, progressing through B-box domain-mediated oligomerization, and culminating in RING domain dimerization. Using optogenetics, we demonstrate that TRIM37's E3 activity is directly coupled to the assembly state of its substrates, activating only when centrosomal proteins cluster into higher-order assemblies resembling MTOCs. This regulatory framework provides a mechanistic basis for understanding TRIM37-driven pathologies and, by echoing TRIM5's restriction of the HIV capsid, unveils a conserved activation blueprint among TRIM proteins for controlling mesoscale assembly turnover.


Conflict of interest statement

Declaration of interests The authors declare no competing interests.

Figures

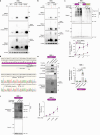
Extended Data Figure 1.
Extended Data Figure 1.. Effect of TRIM37 mutations on the regulation of the centrosome and Centrobin assemblies. (related to Figure 1)
(A) Immunoblot showing TRIM37 protein levels in parental and CRISPR–Cas9 edited TRIM37−/− RPE-1 cells. Ponceau-stained blot indicates loading. Representative data; n = 3 biological replicates. (B) Left, Tracking of Indels by Decomposition (TIDE) analysis histogram reveals a one base pair insertion (+1 bp) adjacent to the predicted cut site in the TRIM37−/− RPE-1 cell line. Right, representative Sanger sequencing traces used for TIDE analysis, highlighting the +1 bp insertion. (C) Representative images of RPE-1 TRIM37−/− cells and those expressing the indicated HA-tagged TRIM37 variants. Inset #1 denotes the centrosome, marked by CEP192, and inset #2 denotes the Centrobin assembly, identified by intense Centrobin staining that is non-centrosome localized. Representative data; n = 3 biological replicates. Scale bars, 5 μm. (D) Schematic representation of TRIM37 HA-tagged domain-specific deletion constructs compared to full-length (FL) protein. (E) Immunoblot showing expression levels of FL TRIM37 and the respective deletion mutants in RPE-1 tet-on TRIM37 cells. Ponceau-stained blot indicates loading. Representative data; n = 3 biological replicates.
Extended Data Figure 2.
Extended Data Figure 2.. Characterization of higher molecular weight (HMW) TRIM37 species. (related to Figure 4)
(A) Immunoblot showing expression levels of wild-type (WT) TRIM37 and indicated mutants in RPE-1 tet-on TRIM37 cells. Higher molecular weight (HMW) TRIM37 species are prominently formed in the C18R mutant and indicated with an arrow. β-Actin, loading control. Representative data; n = 3 biological replicates. (B) Same as in (A) but with MG132 (10 μM) treatment to achieve proteasomal inhibition and stabilization of WT TRIM37. β-Actin, loading control. Representative data; n = 3 biological replicates. (C) Top, immunoblot showing detection of various higher molecular weight (HMW) species of TRIM37 upon treatment with increasing concentrations of DSS crosslinker. Vinculin is used as a loading and oligomerization control. Dotted lines indicate separate cropped sections of the same immunoblot. Representative data; n = 3 biological replicates. Bottom, Densitometric analysis of immunoblot with a graph depicting normalized HMW TRIM37 intensity upon increasing DSS concentrations relative to DMSO control (−DSS). Mean ± s.e.m. (D) Representative Sanger sequencing traces of the TRIM37 locus in parental and CRISPR–Cas9 edited RPE-1 TRIM37C18R cells, highlighting the mutation (TGT>CGT) responsible for the biallelic C18R residue substitution, denoted by an asterisk. (E) Left, immunoblot showing endogenous TRIM37 protein levels across the indicated cellular fractions from RPE-1 TRIM37C18R cells. Validation markers include CEP192, Centrobin, and SAS6 for centrosomal proteins, and Lamin A/C for the nuclear fraction. Ponceau-stained blot indicates loading. Representative data; n = 3 biological replicates. WCE, whole-cell extract; exp, exposure. Right, Densitometric analysis of immunoblot in with a graph depicting endogenous TRIM37 enrichment in indicated fractions relative to WCE. P values, one-way ANOVA with post hoc Dunnett’s multiple comparisons test to evaluate enrichment of TRIM37 in each cellular fraction relative to WCE. Mean ± s.e.m. (F) Left, immunoblot showing detection of various higher molecular weight (HMW) species of endogenous TRIM37 upon treatment of RPE-1 TRIM37C18R cells with increasing concentrations of DSG crosslinker. Vinculin is used as a loading and oligomerization control. Representative data; n = 3 biological replicates. Right, Densitometric analysis of immunoblot with a graph depicting normalized HMW TRIM37 intensity upon increasing DSG concentrations relative to DMSO control (−DSG). Mean ± s.e.m.
Extended Data Figure 3.
Extended Data Figure 3.. Endogenous TRIM37 localization at the centrosome is revealed by E3 ligase inactivation.
(A) Schematic of the TRIM37 protein, highlighting epitopes recognized by two distinct commercial antibodies. (B-D) The commercial TRIM37 antibody (Bethyl, A301–173A) was utilized for the following experiments. (B) Immunoblot showing endogenous TRIM37 protein levels across a panel of cell lines with the indicated TRIM37 status. Ponceau-stained blot indicates loading. Representative data; n = 3 biological replicates. KI, knock-in; KO, knock-out; exp, exposure. (C) Representative images showing the immunostaining pattern of endogenous TRIM37 in the cell line panel. Arrows indicate the location of centrosomes. Representative data; n = 3 biological replicates. Scale bars, 5 μm. (D) Quantification of endogenous TRIM37 signal at the centrosomes of the cell line panel. n = 3 biological replicates, each with >100 cells. P values, one-way ANOVA with post hoc Tukey’s multiple comparisons test. Mean ± s.e.m. (E-G) Same as in (B-D), but with a second commercial antibody (Cell Signaling Technology, D7U2L).
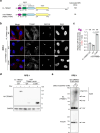
Extended Data Figure 4.
Extended Data Figure 4.. Defining the minimal TRIM37 domain architecture required for centrosome regulation.
(A) Schematic of the miniTRIM37 (RBCC-TRAF) construct compared to full-length TRIM37. (B) Representative images of the localization and effect of indicated HA-tagged TRIM37 constructs on centrosomal CEP192 levels in RPE-1 tet-on TRIM37 cells. Arrows indicate the location of centrosomes. Representative data; n = 3 biological replicates. Scale bars, 5 μm. (C) Quantification of centrosomal CEP192 signal upon doxycycline-induced expression of indicated HA-tagged TRIM37 constructs in RPE-1 tet-on TRIM37 cells from (B). n = 3 biological replicates, each with >100 cells. P values, one-way ANOVA with post hoc Tukey’s multiple comparisons test. Mean ± s.e.m. (D) Immunoblot showing total protein levels of indicated HA-tagged TRIM37 constructs in RPE-1 tet-on TRIM37 cells from (B-C). GAPDH, loading control. Representative data; n = 3 biological replicates. (E) Immunoblot showing detection of various higher molecular weight (HMW) species of miniTRIM37 upon treatment with increasing concentrations of DSG crosslinker. Vinculin is used as a loading and oligomerization control. Representative data; n = 3 biological replicates.
Extended Data Figure 5.
Extended Data Figure 5.. Impairment of TRIM37 oligomerization attenuates synthetic lethality in 17q23-amplified cells with PLK4 inhibition.
(A) Immunoblot showing TRIM37 protein levels in TP53−/− MCF-7 cells. TRIM37 wild-type (WT), TRIM37 knockdown (KD) via shRNA, and cells harboring the C109S mutation in approximately half of the TRIM37 alleles present (TRIM37C109S) were used. Vinculin, loading control. Representative data; n = 3 biological replicates. (B) Left, Representative data of a 10-d clonogenic survival of indicated MCF-7 cell lines from (A) treated with DMSO (control) or PLK4 inhibitor (PLK4i) (125 nM). Right, Quantification of relative growth in the presence PLK4i relative to DMSO. P values, one-way ANOVA with post hoc Dunnett’s multiple comparisons test to evaluate differences between each experimental condition (KD and C109S) and WT. Mean ± s.e.m (C) Quantification of mitotic CEP192 foci in PLK4i-treated TP53−/− MCF-7 cells that lack centrosomes. n = 3, biological replicates, each comprising >30 cells. P values, one-way ANOVA with post hoc Dunnett’s multiple comparisons test to evaluate differences between each experimental condition (KD and C109S) and WT. Mean ± s.e.m (D) Representative images for (C). Scale bars, 5 μm. (E) Representative Sanger sequencing traces for the TRIM37 locus in parental TP53−/− MCF-7 cells subjected to TRIM37 knockdown (KD) via shRNA, and CRISPR–Cas9 edited TRIM37C109S KI cells. The mutation (TGT>TCT) leading to the C109S residue substitution is denoted by an asterisk. Silent mutations introduced to prevent re-editing are highlighted.
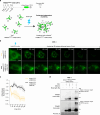
Extended Data Figure 6.
Extended Data Figure 6.. Substrate-independent clustering is sufficient to activate TRIM37. (related to Figure 6)
(A) Top, schematic of the TRIM37G322V-mNeonGreen-CRY2 optogenetic fusion construct. The star denotes the TRAF domain mutation (G322V). Bottom, illustration of the blue light (BL)-activated optogenetic system enabling TRIM37 clustering independent of binding to a centrosome substrate. (B) Representative time-lapse images of RPE-1 cells expressing the optogenetic construct detailed in (A) incubated in the presence or absence of MG132. Timestamps indicate minutes post blue light exposure. Scale bar = 10 μm. (C) Quantification of mNeonGreen fluorescence intensity from (B), with each condition comprising >30 cells. Mean ± s.d. (D) RPE-1 cells expressing optogenetic constructs detailed in (A) were incubated with or without doxycycline (Dox) and MG132 (10 μM) in the absence or presence blue light for 3 h before immunoblotting for the indicated proteins. Higher molecular weight (HMW) TRIM37 species were prominently formed only in MG132 and BL-stimulated conditions and are indicated with an arrow. Ponceau-stained blot indicates loading. Representative data; n = 3 biological replicates. exp, exposure
Figure 1.
Figure 1.. Domain-specific impact of Mulibrey nanism (MUL) TRIM37 mutations on MTOC regulation.
(A) A diagram depicting TRIM37 dysregulation in MUL and 17q23-amplified cancers. In MUL, TRIM37 loss-of-function mutations result in the aberrant formation of Centrobin assemblies, which act as ectopic MTOCs during mitosis. Conversely, in 17q23-amplified cancers, elevated expression of TRIM37 leads to excessive degradation of centrosomal CEP192. (B) Centre, domain architecture of TRIM37 (UniProt ID 094972) highlighting the common RBCC motif (RING, B-box, Coiled-coil domains) and unique C-terminal TRAF domain. Surrounding panels, localization pattern and effect of HA-tagged TRIM37 variants (domain-specific mutations and deletions) on centrosomal CEP192 levels in RPE-1 tet-on TRIM37 cells. MUL indicates Mulibrey nanism patient-derived mutations. Representative data; n = 3 biological replicates. Scale bars, 5 μm. (C) Quantification of Centrobin assembly occurrence in RPE-1 TRIM37−/− cells expressing the indicated HA-tagged TRIM37 variants. n = 3 biological replicates, each with >100 cells. P values, one-way ANOVA with post hoc Dunnett’s multiple comparisons test to evaluate differences between the TRIM37 variants and wild-type (WT). Mean ± s.e.m. (D) Quantification of centrosomal CEP192 signal in RPE-1 tet-on TRIM37 cells from (B). n = 3 biological replicates, each with >100 cells. P values, unpaired two-tailed t-test. Mean ± s.e.m. (E) Left, AlphaFold-predicted monomer of TRIM37. The RING, B-box, Coiled-coil, and TRAF domains are shown, with mutated residues highlighted in red. Right, AlphaFold Multimer-predicted model of a TRIM37 dimer. For both models, the unstructured C-terminal tail of TRIM37 (residues 449–964) is not shown due to the lack of a high-confidence prediction.
Figure 2.
Figure 2.. Proximity-dependent biotin identification (BioID) identifies TRAF domain interactors of TRIM37.
(A) Top, schematic of miniTurbo-TRIM37 construct used for BioID labelling experiments. Bottom, depiction of the approach to isolate TRAF domain-specific interactors of TRIM37. (B) Immunofluorescence images of biotin-labelled proteins in RPE-1 cells expressing the indicated mTurbo constructs. Streptavidin staining indicates biotinylated proteins, with centrosomes marked by CEP192 staining. Representative data; n = 2 biological replicates. Scale bars, 5 μm. (C) Thresholded mass spectrometry results displaying the top 34 proximity interactors (TRAF-domain specific) by spectral count. Interactors were identified using filters detailed in the Methods section, highlighting differential labelling by TRIM37 mutants after background subtraction. (D) Venn diagram illustrating the overlap between TRIM37 TRAF domain-specific proximity interactome (this study) and two published centrosome proximity interactomes. Accompanying list specifies hits common to the TRAF-domain interactome. (E) Gene ontology analysis of mass spectrometry data from BioID experiments.
Figure 3.
Figure 3.. Chimeric TRIM5 bearing the TRIM37 TRAF domain regulates MTOCs.
(A) Schematic overview of the domain swap strategy, which replaces the TRIM5 SPRY domain with the TRIM37 TRAF domain to generate a chimeric TRIM5-TRAF protein. (B) Immunoblot showing total protein expression levels of indicated HA-tagged TRIM5 constructs in RPE-1 tet-on TRIM5 cells. Actin, loading control. Representative data; n = 3 biological replicates. (C) Representative images of the localization and effect of indicated HA-tagged TRIM5 constructs on centrosomal CEP192 levels in RPE-1 tet-on TRIM5 cells. Representative data; n = 3 biological replicates. Scale bars, 5 μm. (D) Quantification of centrosomal CEP192 signal upon doxycycline-induced expression of indicated constructs in RPE-1 tet-on TRIM5 cells from (C), with TRIM37 included as a benchmark. n = 3 biological replicates, each with >100 cells. P values, one-way ANOVA with post hoc Tukey’s multiple comparisons test. Mean ± s.e.m. (E) Representative images of RPE-1 TRIM37−/− cells expressing the indicated HA-tagged TRIM5 constructs. Inset #1 denotes the centrosome, marked by CEP192, and inset #2 denotes the Centrobin assembly, identified by intense Centrobin staining that is non-centrosome localized. Representative data; n = 3 biological replicates. Scale bars, 5 μm. (F) Quantification of Centrobin assembly occurrence in RPE-1 TRIM37−/− cells expressing the indicated HA-tagged TRIM5 constructs from (E). n = 3 biological replicates, each with >100 cells.
Figure 4.
Figure 4.. TRAF-directed higher-order assembly of TRIM37 at the centrosome.
(A) Experimental schematic of the centrosome-enrichment assay used to separate nuclear, cytoplasmic, and centrosomal fractions, as analysed in (C-D). (B) Representative images of RPE-1 cells expressing the TRIM37 RING domain mutant (C18R) or TRIM37 RING-TRAF double mutant (C18R-G322V). n = 3 biological replicates. Scale bars, 5 μm. (C) Immunoblot showing TRIM37 protein levels across the indicated cellular fractions. Validation markers include CEP192, Centrobin, and SAS6 for the centrosomal fraction and Lamin A/C for the nuclear fraction. Ponceau-stained blot indicates loading. Representative data; n = 3 biological replicates. WCE, whole-cell extract; exp, exposure. (D) Densitometric analysis of immunoblot in (C) with graph depicting TRIM37 enrichment in indicated fractions relative to WCE. n = 3 biological replicates. P values, one-way ANOVA with post hoc Dunnett’s multiple comparisons test to evaluate enrichment of TRIM37 in each cellular fraction relative to WCE. Mean ± s.e.m. (E) Schematic of the in vivo crosslinking protocol applied to RPE-1 cells using membrane-permeable crosslinkers to elucidate TRIM37 oligomerization dynamics. (F) Top, immunoblot showing detection of various higher molecular weight (HMW) species of TRIM37 upon treatment with increasing concentrations of DSG crosslinker. Vinculin is used as a loading and oligomerization control. Representative data; n = 3 biological replicates. Bottom, Densitometric analysis of immunoblot with a graph depicting normalized HMW TRIM37 intensity upon increasing DSG concentrations relative to DMSO control (−DSG). Mean ± s.e.m.
Figure 5.
Figure 5.. B-box domain mutations impair TRIM37 higher-order assembly.
(A) Left, diagram illustrating the B-box trimerization interface of TRIM5 dimers on the HIV capsid. Trimers are stabilized by W117 residues within the hydrophobic core, as shown in the magnified top-down view of the TRIM5 B-box crystal structure (PDB 5VA4). Right, analogous diagram representing a putative oligomer formed by TRIM37 dimers at the centrosome, where B-box domain trimerization is hypothesized to be stabilized by W120 residues, the synonymous counterpart to TRIM5's W117. A magnified top-down view shows the putative TRIM37 B-box trimer modelled by fitting AlphaFold-predicted TRIM37 monomers onto the TRIM5 crystal structure. (B) Comparative alignment of the B-box domains from human TRIM37 and human and rhesus macaque (Macaca mulatta) TRIM5. Residue Cys109, mutated in MUL disease, is pivotal for zinc (Zn) coordination. The highlighted region in grey denotes the sequence alignment where W115/W117 residues in TRIM5 correspond to the W120 residue in TRIM37, signifying a conserved structural motif critical for higher-order assembly. (C) Immunoblot showing total protein expression levels of TRIM37 variants in RPE-1 tet-on TRIM37 cells from (D). Vinculin, loading control. Representative data; n = 3 biological replicates. (D) Representative images of RPE-1 tet-on TRIM37 cells expressing the RING domain mutant TRIM37(C18R) or RING-B-box double mutants (C18R-C109S and C18R-W120E). Cells were treated with DMSO (control) or nocodazole (3.3 μM) 30 min before doxycycline induction to depolymerize microtubules. n = 3 biological replicates. Scale bars, 5 μm. (E) Quantification of centrosomal TRIM37 signal in DMSO-treated RPE-1 tet-on TRIM37 cells expressing the indicated TRIM37 variants from (D). n = 3 biological replicates, each with >100 cells. P values, one-way ANOVA with post hoc Dunnett’s multiple comparisons test to evaluate differences between each of the TRIM37 RING-B-box double mutants (C18R-C109S and C18R-W120E) and the RING mutant (C18R). Mean ± s.e.m. (F) Left, immunoblot showing detection of higher molecular weight (HMW) species of indicated TRIM37 variants upon in vivo DSG crosslinking. Vinculin is used as a loading and oligomerization control. Representative data; n = 3 biological replicates. Right, Densitometric analysis of immunoblot with graph depicting normalized HMW TRIM37 intensity with DSG crosslinker (+) relative to DMSO control (−DSG). Mean ± s.e.m. (G) Evaluation of cytoplasmic TRIM37 puncta prevalence in nocodazole (Noc)-treated RPE-1 tet-on TRIM37 cells expressing the indicated TRIM37 variants from (D). n = 3 biological replicates, each with >100 cells. P values, one-way ANOVA with post hoc Dunnett’s multiple comparisons test to evaluate differences between each of the TRIM37 RING-B-box double mutants (C18R-C109S and C18R-W120E) and the RING mutant (C18R). Mean ± s.e.m.
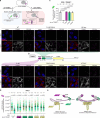
Figure 6.
Figure 6.. Optogenetic clustering of centrosomal substrates triggers recognition and activation of TRIM37.
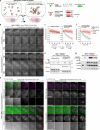
(A) Left, schematic depicts the blue light (BL)-triggered optogenetic system designed to cluster TRIM37’s cognate centrosomal substrates, enabling the investigation of TRIM37 recognition and activation requirements. Right, schematic of constructs used in the optogenetic experiments, including mNeonGreen-tagged TRIM37 for visualizing recruitment to centrosomal substrates, mCherry-CRY2 fused to Centrobin’s C-terminal unstructured region (residues 567–836) and a mCherry-CRY2 control. (B) Representative time-lapse images of RPE-1 TRIM37−/− cells integrated with optogenetic constructs detailed in (A), incubated with or without doxycycline (Dox), in the absence or presence blue light. Timestamps indicate minutes post blue light exposure. Representative data; n = 3 biological replicates. Scale bar = 10 μm. (C) Quantification of mCherry fluorescence intensity from (B), with each condition comprising >30 cells. Mean ± s.d. (D) RPE-1 TRIM37−/− cells integrated with optogenetic constructs detailed in (A) were incubated with or without doxycycline (Dox), in the absence or presence blue light for 3 h prior to immunoblotting for the indicated proteins. GAPDH, loading control. Representative data; n = 3 biological replicates. (E) Representative time-lapse images of RPE-1 TRIM37−/− cells integrated with optogenetic constructs and co-expressing different TRIM37 mutants with or without MG132 (10 μM) in the absence or presence blue light. Timestamps indicate minutes post blue light exposure. Representative data; n = 3 biological replicates. Scale bar = 10 μm. mCh, mCherry. (F) Quantification of mCherry fluorescence intensity from (E), with each condition comprising >30 cells. Mean ± s.d. (G) RPE-1 TRIM37−/− cells expressing indicated optogenetic constructs and different TRIM37 mutants were treated with or without MG132 (10 μM) in the absence or presence of blue light for 3 h prior to immunoblotting for the indicated proteins. GAPDH, loading control. Representative data; n = 3 biological replicates.
Figure 7.
Figure 7.. TRIM37 regulates MTOC function via substrate-templated higher-order assembly.
(A) Model illustrating how TRIM37 regulates MTOCs through substrate-templated higher-order assembly, demonstrated here using centrosomes, highlighting a conserved mechanism reminiscent of TRIM5's role in HIV capsid restriction.

References

    1. Conduit P. T., Wainman A. & Raff J. W. Centrosome function and assembly in animal cells. Nat Rev Mol Cell Biol 16, 611–624, doi:10.1038/nrm4062 (2015). - DOI - PubMed
    1. Gould R. R. & Borisy G. G. The pericentriolar material in Chinese hamster ovary cells nucleates microtubule formation. J Cell Biol 73, 601–615, doi:10.1083/jcb.73.3.601 (1977). - DOI - PMC - PubMed
    1. Schnackenberg B. J., Khodjakov A., Rieder C. L. & Palazzo R. E. The disassembly and reassembly of functional centrosomes in vitro. Proc Natl Acad Sci U S A 95, 9295–9300, doi:10.1073/pnas.95.16.9295 (1998). - DOI - PMC - PubMed
    1. Mennella V., Agard D. A., Huang B. & Pelletier L. Amorphous no more: subdiffraction view of the pericentriolar material architecture. Trends in Cell Biology 24, 188–197, doi:10.1016/j.tcb.2013.10.001 (2014). - DOI - PMC - PubMed
    1. Woodruff J. B., Wueseke O. & Hyman A. A. Pericentriolar material structure and dynamics. Philos Trans R Soc Lond B Biol Sci 369, doi:10.1098/rstb.2013.0459 (2014). - DOI - PMC - PubMed

Publication types

LinkOut - more resources