[Preprint]. 2025 Jan 24:2024.10.07.617066.
doi: 10.1101/2024.10.07.617066.

Metastatic organotropism in small cell lung cancer

Affiliations

Metastatic organotropism in small cell lung cancer

Manan Krishnamurthy et al. bioRxiv. .

Abstract

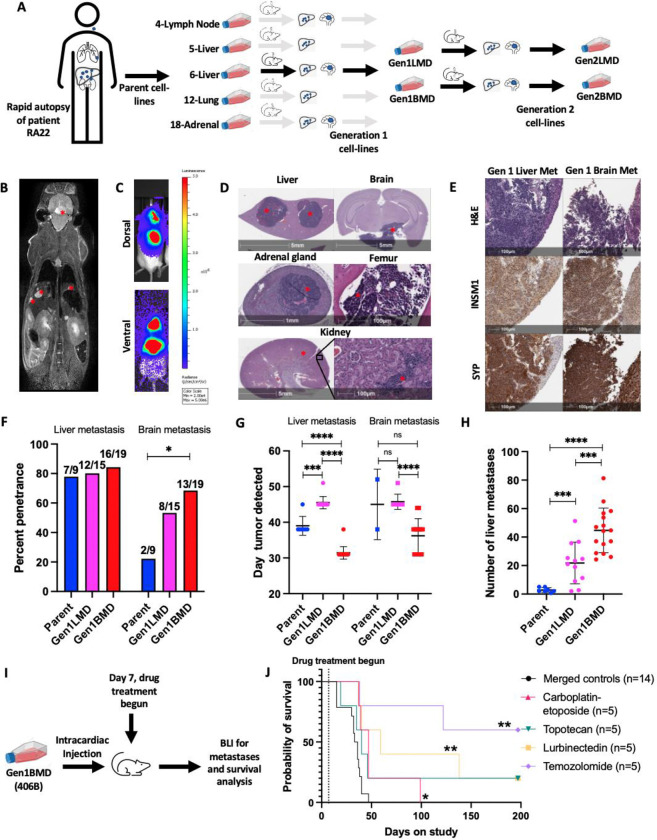
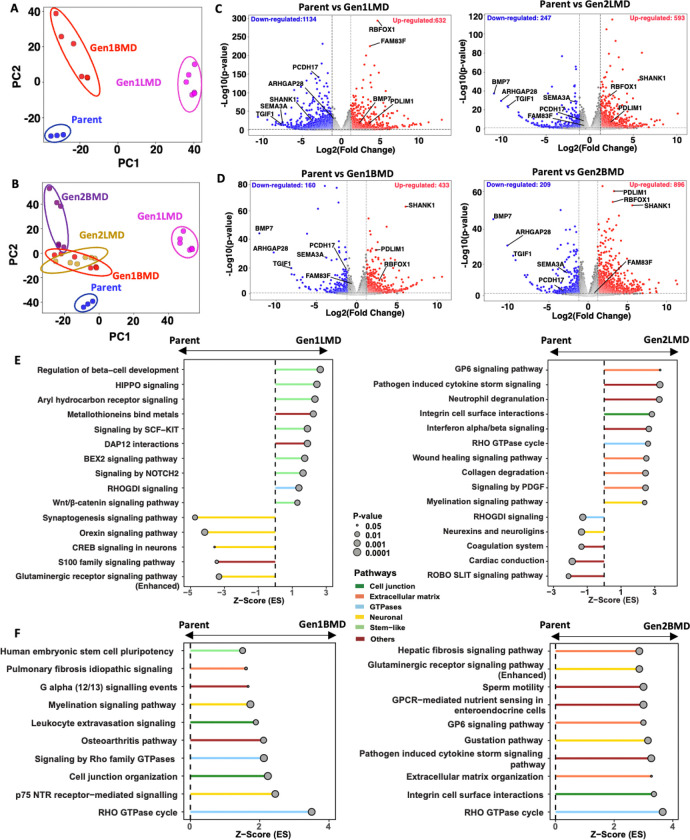
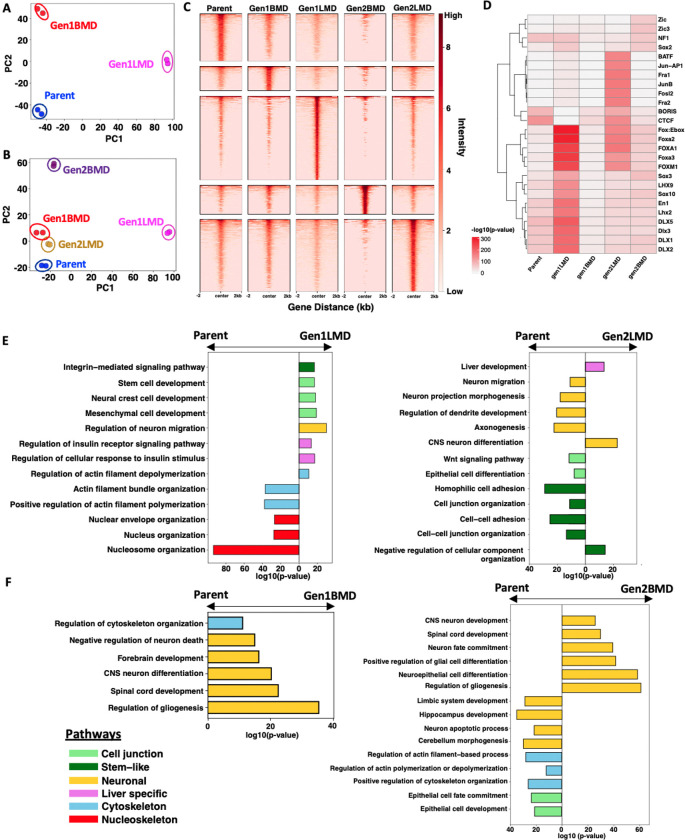
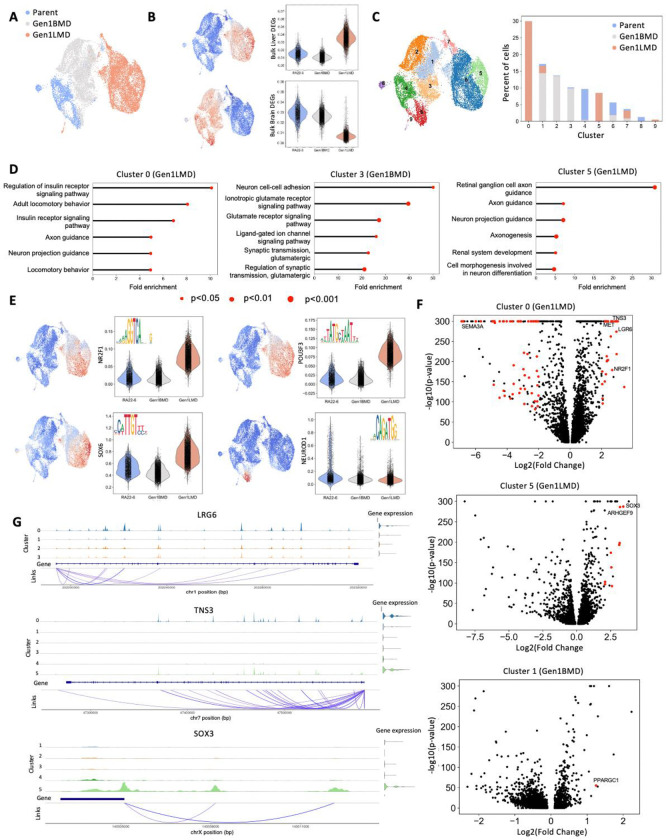
Metastasis is the leading cause of cancer-related deaths, yet its regulatory mechanisms are not fully understood. Small-cell lung cancer (SCLC) is the most metastatic form of lung cancer, with most patients presenting with widespread disease, making it an ideal model for studying metastasis. However, the lack of suitable preclinical models has limited such studies. We utilized rapid autopsy-derived tumors to develop xenograft models that mimic key features of SCLC, including histopathology, rapid and widespread development of metastasis to the liver, brain, adrenal, bone marrow, and kidneys within weeks, and response to chemotherapy. By integrating in vivo lineage selection with comprehensive bulk and single cell multiomic profiling of transcriptomes and chromatin accessibility, we identified critical cellular programs driving metastatic organotropism to the liver and brain, the most common sites of SCLC metastasis. Our findings reveal the key role of nuclear-cytoskeletal interactions in SCLC liver metastasis. Specifically, the loss of the nuclear envelope protein lamin A/C, encoded by the LMNA gene, increased nuclear deformability and significantly increased the incidence of liver metastasis. Human liver metastases exhibited reduced LMNA expression compared to other metastatic sites, correlating with poorer patient outcomes and increased mortality. This study introduces novel preclinical models for SCLC metastasis and highlights pathways critical for organ-specific metastasis, offering new avenues for the development of targeted therapies to prevent or treat metastatic disease.


Figures

Fig. 1:
Fig. 1:. Establishment and characterization of a patient-derived model of SCLC metastases and organotropism.
A: Schematic representation of model derivation. B: MRI depicting liver and brain metastases (red asterisks) C: BLI showing brain and liver metastases. D: H&E staining illustrating liver, brain, adrenal, bone marrow, and kidney metastases (red asterisk) E: H&E and IHC staining for neuroendocrine markers F: Percentage penetrance (% of mice that formed tumors) of brain and liver metastases across parental and in vivo selected liver and brain-tropic cell lines, assessed by MRI. Mice numbers indicated above each bar. Statistics by Fisher’s exact test. G: Time to develop liver and brain metastasis in days, assessed by MRI. Error bars: mean and standard deviation. H: Number of liver metastases, assessed by MRI. Error bars: mean and standard deviation. I: Schematic representation of drug assessment experiment J: Survival post intracardiac cell injection with and without treatment with standard SCLC therapeutics, Gen1BMD cell line 406B, n=5 per treatment group, n=14 merged controls (see Fig. S1R (merged control) and Table 1 for details). Statistics by Mantel-Cox test. X axes of figures F-H refer to the cell line injected. Significance tests used parametric unpaired T-tests with Welch’s correction and error bars are mean with standard deviation unless mentioned otherwise. *p<0.05, **p<0.01, ***p<0.001, ****p<0.0001. Abbreviations: LMD: Liver metastasis derived; BMD: Brain metastasis derived; BLI: bioluminescent Imaging; MRI: magnetic resonance imaging; SCLC: small cell lung cancer; Gen1LMD includes cell lines 400L and 404L; Gen1BMD includes cell lines 406B and 408B; Gen2LMD includes cell lines 431L and 431L; Gen2BMD includes cell lines 438L and 438B.
Figure 2:
Figure 2:. Transcriptomic alterations in SCLC liver and brain metastases
A: PCA of Parent and Gen1 differentially expressed genes, RNA-seq B: PCA of Parent, Gen1, and Gen2 differentially expressed genes, RNA-seq C: Pathways enriched in Gen1LMD (left) and Gen2LMD (right) compared to Parent D: Pathways enriched in Gen1BMD (left) and Gen2BMD (right) compared to Parent E: Volcano plots illustrating differentially expressed genes in Gen1LMD and Gen2LMD relative to Parent F: Volcano plots illustrating differentially expressed genes in Gen1BMD and Gen2BMD relative to Parent Abbreviations: PCA: Principal component analysis; IPA: Ingenuity pathway analysis; gen: generation; LMD: Liver metastasis derived; BMD: Brain metastasis derived
Figure 3:
Figure 3:. Epigenomic alterations in SCLC liver and brain metastases.
A: Principal component analysis (PCA) of differential peaks from ATAC-seq in Parent and Gen1. B: PCA of differential peaks from ATAC-seq across Parent, Gen1, and Gen2. C: Heatmap of unique peaks in Parent, Gen1, and Gen2. D: Top 10 unique transcription factor motifs enriched in Parent, Gen1, and Gen2 E: Pathways potentially impacted by newly opened regions in Gen1LMD (left) and Gen2LMD (right) compared to Parent, GREAT analysis of differentially accessible peaks. n = number of observed peaks; arrows indicate which cell line had greater peak enrichment. F: Pathways potentially impacted by newly opened regions in Gen1BMD (left) and Gen2BMD (right) compared to Parent, GREAT analysis of differentially accessible peaks. n = number of observed peaks; arrows indicate which cell line had greater peak enrichment. Abbreviations: PCA: Principal component analysis; Gen, generation; LMD: Liver metastasis derived; BMD: Brain metastasis derived, GREAT, Genomic Regions Enrichment of Annotations Tool
Fig 4.
Fig 4.. Single cell multiomic profiling of transcriptomes and chromatin accessibility in liver and brain metastases.
A: UMAP of single cell multiome ATAC+ gene expression, Parent, Gen1LMD, and Gen1BMD. B: GSEA of Gen1LMD- and Gen1BMD-signatures from bulk RNA-seq. C: Cluster analysis and distribution of cells (shown as percent of all cells) within each cluster. D: Top gene ontology signatures of Gen1LMD (Cluster 0, 5) and Gen1BMD (Cluster 3). Gen1BMD Clusters 1 and 2 not yield significant pathway signatures; clusters 8 and 9 had few cells. Clusters 3, 6, and 7 in Fig S4A. E: Selected genes that showed differentially open peaks and elevated expression in multiple Gen1LMD clusters and in Cluster 6 that was shared between Parent and Gen1BMD cells. Gen1BMD did not have any factors that fit these criteria. F: Volcano plots of differentially expressed genes in Gen1LMD and Gen1BMD. Red dots indicate genes that also show epigenetic linkage. y cut off at −log10(p-value) = 300 and all remaining genes represented in one line. G: Representative coverage plots for LRG6, TNS3, and SOX3. Full coverage plots for all called out genes in Fig. S4
Fig 5:
Fig 5:. Lamin A knockout enhances SCLC liver metastatic burden.
A: RNA-seq of LMNA gene in Parent, generation 1, and generation 2. t-tests only shown compared to Parent. B: ATAC-seq of LMNA locus in Parent and generation 1, two replicates each sample C: Schematic of mouse experiment D: Percentage penetrance (% of mice that formed tumors) of brain and liver metastases in 406B and 406BLMNAKO cell lines, assessed by MRI. Mice numbers indicated above each bar. E: Time to develop liver and brain metastasis in days, assessed by MRI. Error bars: mean and standard deviation. F: Representative images of liver metastases in control and LMNAKO, assessed by MRI. G: Quantification of number of liver metastases on day 33 assessed by MRI. Error bars: mean and standard deviation H: Percent of the 54,523 human SCLC cells [68] expressing LMNA, stratified by site of metastasis. Chi-squared tests only shown compared to liver. J: LMNA expression and survival (n=77 patients) [69], stratified lower 15th percentile of LMNA expression compared to the rest. Significance tests used parametric unpaired T-tests with Welch’s correction and error bars are mean with standard deviation unless mentioned otherwise. *p<0.05, **p<0.01, ****p<0.0001.
Figure 6:
Figure 6:. Lamin A loss increases nuclear deformability and migration through confined spaces.
A: Schema of confinement assay B: Representative IF image with pairwise tracing of control and LMNAKO nuclei pre and post confinement C: Change in nuclear perimeter pre and post confinement D: Representative image of micropipette aspiration assay in DMS114 control and LMNA KO cells E: Nuclear protrusion of DMS114 control and LMNA KO over time, Errors bars are standard error of mean. F: Quantification of nuclear protrusion at t=60s Significance tests used parametric unpaired T-tests with Welch’s correction. **p<0.01, ****p<0.0001. Error bars are mean with standard deviation unless otherwise indicated.

References

    1. Chambers A.F., Groom A.C., and MacDonald I.C., Dissemination and growth of cancer cells in metastatic sites. Nature Reviews Cancer, 2002. 2(8): p. 563–572. - PubMed
    1. Priestley P., et al. , Pan-cancer whole-genome analyses of metastatic solid tumours. Nature, 2019. 575(7781): p. 210–216. - PMC - PubMed
    1. Zehir A., et al. , Mutational landscape of metastatic cancer revealed from prospective clinical sequencing of 10,000 patients. Nat Med, 2017. 23(6): p. 703–713. - PMC - PubMed
    1. Obenauf A.C. and Massague J., Surviving at a Distance: Organ-Specific Metastasis. Trends Cancer, 2015. 1(1): p. 76–91. - PMC - PubMed
    1. Quinn J.J., et al. , Single-cell lineages reveal the rates, routes, and drivers of metastasis in cancer xenografts. Science, 2021. 371(6532). - PMC - PubMed

Publication types

LinkOut - more resources