[Preprint]. 2024 Oct 13:2024.10.12.618047.
doi: 10.1101/2024.10.12.618047.

Synergistic Role of Amino Acids in Enhancing mTOR Activation Through Lysosome Positioning

Affiliations

Synergistic Role of Amino Acids in Enhancing mTOR Activation Through Lysosome Positioning

Oralia M Kolaczkowski et al. bioRxiv. .

Abstract

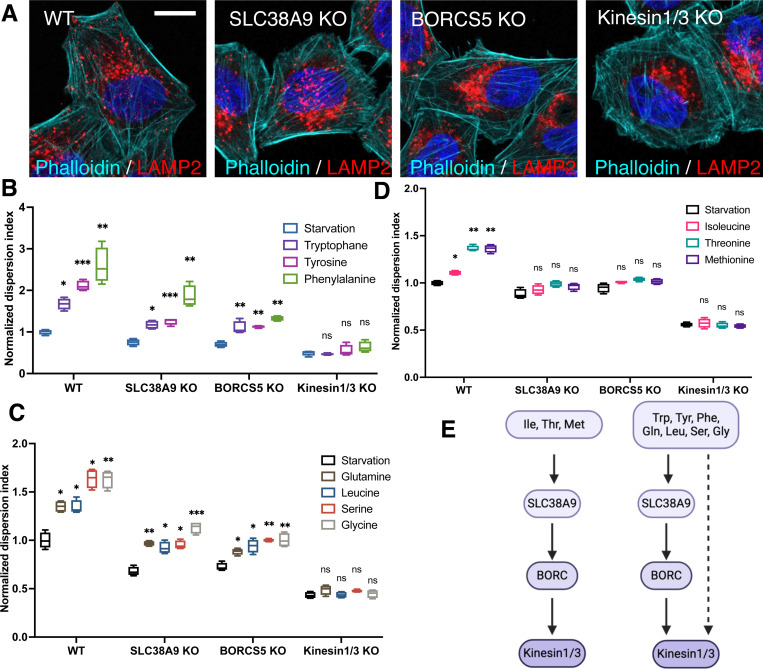
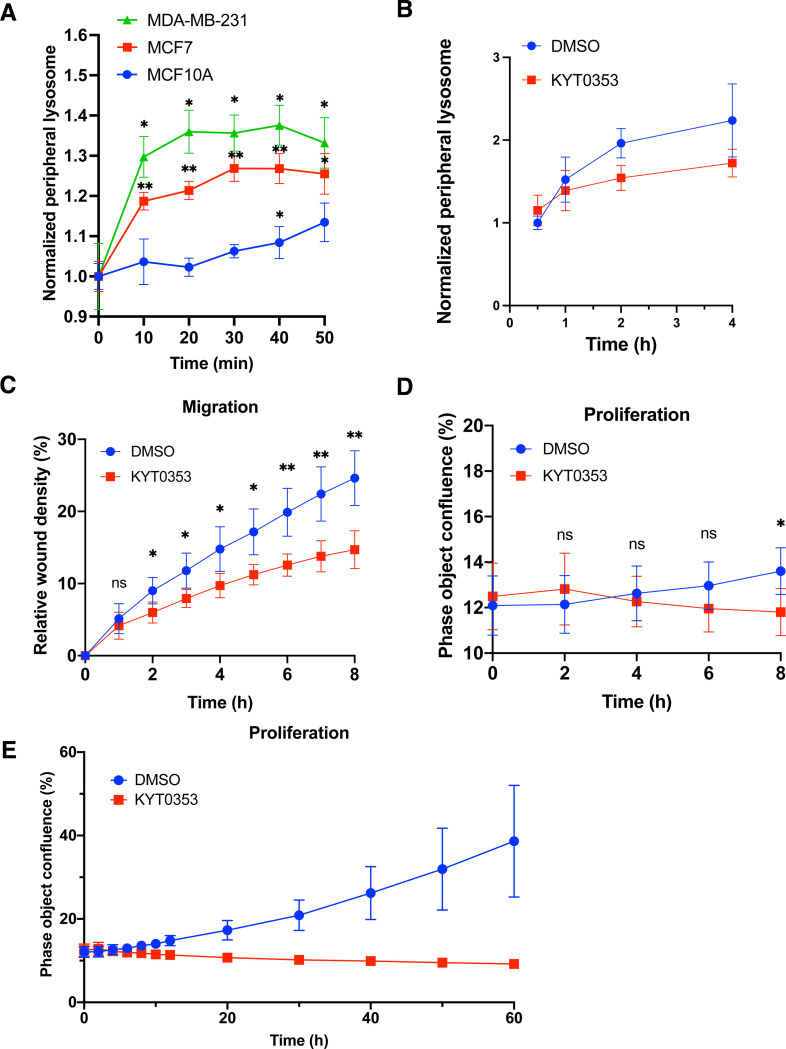
Lysosome positioning, or lysosome cellular distribution, is critical for lysosomal functions in response to both extracellular and intracellular cues. Amino acids, as essential nutrients, have been shown to promote lysosome movement toward the cell periphery. Peripheral lysosomes are involved in processes such as lysosomal exocytosis, cell migration, and metabolic signaling-functions that are particularly important for cancer cell motility and growth. However, the specific types of amino acids that regulate lysosome positioning, their underlying mechanisms, and their connection to amino acid-regulated metabolic signaling remain poorly understood. In this study, we developed a high-content imaging system for unbiased, quantitative analysis of lysosome positioning. We examined the 15 amino acids present in cell culture media and found that 10 promoted lysosome redistribution toward the cell periphery to varying extents, with aromatic amino acids showing the strongest effect. This redistribution was mediated by promoting outward transport through SLC38A9-BORC-kinesin 1/3 axis and simultaneously reducing inward transport via inhibiting the recruitment of Rab7 and JIP4 onto lysosomes. When examining the effects of amino acids on mTOR activation-a central regulator of cell metabolism-we found that the amino acids most strongly promoting lysosome dispersal, such as phenylalanine, did not activate mTOR on their own. However, combining phenylalanine with arginine, which activates mTOR without affecting lysosome positioning, synergistically enhanced mTOR activity. This synergy was lost when lysosomes failed to localize to the cell periphery, as observed in kinesin 1/3 knockout (KO) cells. Furthermore, breast cancer cells exhibited heightened sensitivity to phenylalanine-induced lysosome dispersal compared to noncancerous breast cells. Inhibition of LAT1, the amino acid transporter responsible for phenylalanine uptake, reduced peripheral lysosomes and impaired cancer cell migration and proliferation, highlighting the importance of lysosome positioning in these coordinated cellular activities. In summary, amino acid-regulated lysosome positioning and mTOR signaling depend on distinct sets of amino acids. Combining lysosome-dispersing amino acids with mTOR-activating amino acids synergistically enhances mTOR activation, which may be particularly relevant in cancer cells.

Keywords: High-content imaging; LAT1 (SLC7A5); amino acid signaling; bidirectional transport; breast cancer cells.


Figures

Fig. 1
Fig. 1. Identification of lysosome-dispersing amino acids by high-content imaging analysis
A. HeLa cells were starved in different nutrient-depleted media for 1 h and fixed immediately for immunostaining with an antibody against LAMP1. Fluorescence confocal microscopy was performed to visualize lysosome cellular distribution. Yellow doted lines were added to indicate the cell boundaries. B. An image example of high-content imaging analysis by CellInsight for lysosome positioning. CellMask was applied to identify cell boundaries, and a shell was made by shrinking cell boundary inward with a 15-micron gap (cell peripheral area). The signal of immunostaining of TGN46 was smoothened and identified as a circle to define juxtanuclear area. Lysosomes were immunostained with a LAMP1 antibody. All the masks were automatedly generated by the software. C. Cells were starved in amino acid- and serum-free media for 1 h and then refed with 2 mM individual amino acid or DMEM (no serum) for 30 min, followed by the lysosome positioning analysis as described in B. Lysosome Dispersion Index is defined as the ratio of cell peripheral to juxtanuclear lysosome fluorescence intensity and normalized to the average value of starvation group. The percentages of increased cell peripheral (D) or intermediate (E) lysosomes out of total lysosomes were shown for the 10 amino acids that increased the Lysosome Dispersion Index in C. Example images obtain by CellInsight were shown in F. Note that phenylalanine accumulated lysosomes at cell protrusions pointed by arrows. G. Cells were starved as in C and refed with the indicated 7 amino acids at the concentrations of 0.02, 0.1, 0.5, and 2 mM. H. A schematic cartoon showing different types of amino acids disperse lysosomes to different cell areas. Floating bar graphs are presented as min-max and mean ± SD. Points in the curve graph are presented as mean ± SD. p values were determined using One-way ANOVA test. *, p<0.05, **, p<0.001, ***, p<0.001, ****, p<0.0001, n.s., not significant (vs. Starvation). Scale bars, 5 μm.
Fig. 2
Fig. 2. Structural basis of aromatic amino acids in dispersing lysosomes
A. Partial phenylalanine metabolism pathways and metabolites’ structures. The compound code and pictures of molecular structure were from KEGG Pathway or manufactures. B. & C. Cells were starved for 1 h and treated with phenylalanine, its metabolites, or a derivative at 2 mM for 30 min. Cells were fixed and immunostained for lysosome positioning analysis with CellInsight. Floating bar graphs are presented as min-max and mean ± SD. p values were determined using t-Student’s test or One-way ANOVA test. *, p<0.05, **, p<0.001, ****, p<0.0001, n.s., not significant (vs. Starvation).
Fig. 3
Fig. 3. Characterization of the mechanisms regulating lysosome anterograde transport in response to amino acids
A. Wild-type and CRISPR-gene KO HeLa cells were immunostained with LAMP2 antibody to visualize lysosomes and stained with phalloidin (for actin) to visualize cell boundaries. B-D, Wildtype and CRISPR-gene KO cells were starved for 1 h and refed with indicated amino acids for 30 min. Lysosome positioning was analyzed and presented as the Lysosome Dispersion Indexes. E. Schematic illustration of the pathways that mediated lysosome anterograde transport in response to different amino acids. Floating bar graphs are presented as min-max and mean ± SD. p values were determined using One-way ANOVA test. *, p<0.05, **, p<0.001, ***, p<0.001, ****, p<0.0001, n.s., not significant (vs. Starvation in the same cell group). Scale bars, 5 μm.
Fig. 4
Fig. 4. Characterization of the mechanisms regulating lysosome retrograde transport in response to amino acids
A. Immunoblotting with the indicated antibodies for wildtype (WT), Rab7-KO, and SLC38A9-KO cells. Three replicate samples were examined and quantified using FIJI. B-H, WT and indicated KO cells were starved for 1 h and refed with indicated amino acids for 30 min. When the p38 inhibitor Adezmapimod (Ade) was applied, cells were starved and refed along with the drug at 10 μM. Cells were fixed and immunostained with LAMP2, TGN46, and Rab7 or JIP4 antibodies. Lysosome positioning was analyzed and presented as lysosome dispersing indexes. LAMP2-positive Rab7 or JIP4 was identified and quantified using the “colocalization” function in the software of CellInsight. Numbers on the bars represent the fold of Rab7-KO group vs. WT group. I. Schematic illustration of the pathways that mediated lysosome retrograde transport in response to amino acids. Dotted arrows present potential regulation at gene expression-levels. Bar graphs are presented as mean ± SD. p values were determined using t-Student’s test or one-way ANOVA test. *, p<0.05, **, p<0.001, ***, p<0.001, ****, p<0.0001, n.s., not significant (in B, G, and H, vs. WT; in C, E, and F, vs. Starvation in the same cell group).
Fig. 5
Fig. 5. Amino acid regulation of mTOR activation
A & B, HeLa cells were starved and then refed with 2 mM amino acids or DMEM as indicated, lysed directly by adding 2X SDS sample buffer, and subjected to immunoblotting with the antibodies indicated. The ratio of phosphorylated S6K (p-S6K) to total S6K in each treatment was normalized to the value in starvation group. The mean± SD was plotted from 3 independent experiments. C. Normalized Lysosome Dispersion Indexes from Fig. 1C and mTOR activity from Fig. 5B were plotted on a coordination plane, with the X-axis representing lysosome dispersion and the Y-axis representing mTOR activity. D & E, Cells were treated as described in A with the indicated amino acids or amino acid combinations. Total proteins were extracted and subjected to immunoblotting. The ratio of p-S6K to total S6K for each treatment was normalized to the values in the starvation group. Data represent the mean ± SD from three independent experiments. F-H, The normalized values of p-S6K/S6K from individual amino acid treatments in E were summed (labeled as “+”) and compared to the corresponding values from the combination of the two amino acids (labeled as “&”). Paired values from three independent experiments were shown with lines connecting the data points. I & J, Wild-type (WT) and indicated gene-KO cells were treated with combined arginine and phenylalanine, and cell lysates were subjected to immunoblotting as in A. The normalized values of p-S6K/S6K from 3 independent experiments were presented as mean± SD.
Fig. 6.
Fig. 6.. Amino acid-cell migration and proliferation in breast cancer cells
A. Indicated breast noncancerous (blue) and cancer cells (green and red) were starved in amino acid- and serum-free media, followed by refeeding with 2 mM phenylalanine for the indicated times. Cells were fixed, immunostaining, and analyzed by CellInsight microscope platform. Cell peripheral lysosomes were quantified from at least 1,000 cells per well, 3 wells per condition, and two independent experiments. B. MDA-MB-231 cells were treated with DMSO or 10 μM KYT0353 in complete media for the indicated periods and then subjected to lysosome positioning analysis as described in A. C. Collective cell migration assay with MDA-MB-231 cells. Cells were treated with DMSO or 10 μM KYT0353 for 60 hours. Scratch wound area was imaged hourly. Three replications were included in the assays. The data from first 8 hours were shown. D & E. MDA-MB-231 cells were treated with DMSO or 10 μM KYT0353 for 60 hours and imaged hourly. Cell confluency mask was quantified by using IncuCyte Zoom software. Three replications were included in the assays. The data from first 8 hours and entire treatment were shown separately. Data are presented as mean ± SD. p values were determined using t-Student’s test or one-way ANOVA test. *, p<0.05, **, p<0.001, n.s., not significant (vs. time point 0 in A. Compared between groups in B, C, and D).

References

    1. Pu J., Guardia C.M., Keren-Kaplan T., Bonifacino J.S., Mechanisms and functions of lysosome positioning, J Cell Sci 129(23) (2016) 4329–4339. - PMC - PubMed
    1. Ballabio A., Bonifacino J.S., Lysosomes as dynamic regulators of cell and organismal homeostasis, Nat Rev Mol Cell Biol 21(2) (2020) 101–118. - PubMed
    1. Jongsma M.L., Berlin I., Wijdeven R.H., Janssen L., Janssen G.M., Garstka M.A., Janssen H., Mensink M., van Veelen P.A., Spaapen R.M., Neefjes J., An ER-Associated Pathway Defines Endosomal Architecture for Controlled Cargo Transport, Cell 166(1) (2016) 152–66. - PMC - PubMed
    1. Starling G.P., Yip Y.Y., Sanger A., Morton P.E., Eden E.R., Dodding M.P., Folliculin directs the formation of a Rab34-RILP complex to control the nutrient-dependent dynamic distribution of lysosomes, EMBO Rep 17(6) (2016) 823–41. - PMC - PubMed
    1. Encarnacao M., Espada L., Escrevente C., Mateus D., Ramalho J., Michelet X., Santarino I., Hsu V.W., Brenner M.B., Barral D.C., Vieira O.V., A Rab3a-dependent complex essential for lysosome positioning and plasma membrane repair, J Cell Biol 213(6) (2016) 631–40. - PMC - PubMed

Publication types