[Preprint]. 2024 Oct 9:2024.10.08.617275.
doi: 10.1101/2024.10.08.617275.

Independent effects of testosterone, estradiol, and sex chromosomes on gene expression in immune cells of trans- and cisgender individuals

Affiliations

Independent effects of testosterone, estradiol, and sex chromosomes on gene expression in immune cells of trans- and cisgender individuals

Rebecca M Harris et al. bioRxiv. .

Abstract

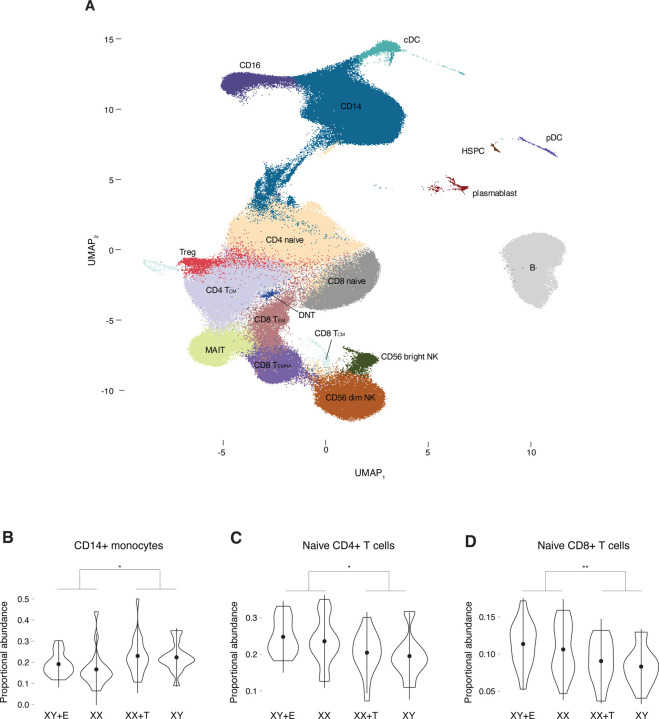
The origins of sex differences in human disease are elusive, in part because of difficulties in separating the effects of sex hormones and sex chromosomes. To separate these variables, we examined gene expression in four groups of trans- or cisgender individuals: XX individuals treated with exogenous testosterone (n=21), XY treated with exogenous estradiol (n=13), untreated XX (n=20), and untreated XY (n=15). We performed single-cell RNA-sequencing of 358,426 peripheral blood mononuclear cells. Across the autosomes, 8 genes responded with a significant change in expression to testosterone, 34 to estradiol, and 32 to sex chromosome complement with no overlap between the groups. No sex-chromosomal genes responded significantly to testosterone or estradiol, but X-linked genes responded to sex chromosome complement in a remarkably stable manner across cell types. Through leveraging a four-state study design, we successfully separated the independent actions of testosterone, estradiol, and sex chromosome complement on genome-wide gene expression in humans.

Keywords: Sex hormones; X chromosome; estradiol; gender; peripheral blood mononuclear cell; sex chromosomes; sex differences; single-cell RNA-sequencing; testosterone; transgender.


Conflict of interest statement

Declaration of interests: The authors declare no competing interests.

Figures

Figure 1.
Figure 1.. Human cohort with four combinations of sex hormones and sex chromosomes.
In our study we included 34 transgender individuals receiving either exogenous testosterone (T) or estradiol (E) as part of their gender-affirming medical treatment for at least one year (XX+T and XY+E) and 35 cisgender individuals (XX and XY). We investigated the effects of testosterone, estradiol, and sex chromosome complement on peripheral blood mononuclear cell (PBMC) abundances and, within each cell type, differential gene expression at the single-cell level. See also Figure S1.
Figure 2.
Figure 2.. Testosterone influences abundances of CD14+ monocytes and naïve CD4+ and CD8+ T cells.
(A) Uniform manifold approximation projection (UMAP) showing 18 distinct PBMC cell types. (B-D) Violin plots showing median (dot) and interquartile range (vertical lines) of the proportional abundances of CD14+ monocytes (B), naïve CD4+ T cells (C), and naïve CD8+ T cells (D) separated by group. Significant differences noted by asterisks (* p-adj <0.05; ** p-adj <0.01). See also Table S1 and Figure S2.
Figure 3.
Figure 3.. Autosomal responses to testosterone, estradiol, and sex chromosome complement are cell-type-specific.
(A-C) Volcano plots of the autosomal responses (log2 fold change (log2FC) in expression) to testosterone in CD8+ Temra cells (A), estradiol in CD4+ Tcm cells (B), and sex chromosome complement (XX/XY) in MAIT cells (C). Genes with a significant response (FDR <0.05) are noted in blue. Heatmaps of Pearson correlation coefficients of the autosomal responses to testosterone (D), estradiol (E), and sex chromosome complement (F) between every pair of cell types. See also Tables S2-S4.
Figure 4.
Figure 4.. Interferon response pathways are altered by testosterone, estradiol, and sex chromosome complement.
(A-C) Heatmaps of normalized enrichment scores (NES) for Hallmark gene sets in all 18 cell types based on the effects of testosterone (A), estradiol (B), and sex chromosome complement (C). Significant enrichments noted by asterisks (* p-adj <0.05; ** p-adj <0.01; *** p-adj <0.001). (D) Venn diagrams of the number of interferon gamma response leading edge genes specific to testosterone, estradiol, or sex chromosome complement, or shared, in CD14+ monocytes (left), CD16+ monocytes (middle), and MAIT cells (right).
Figure 5.
Figure 5.. Responses of X-chromosomal genes to sex chromosome complement are preserved across 18 cell types.
(A-B) Volcano plots of the responses of non-PAR X-chromosomal (NPX) genes to sex chromosome complement in CD56 dim natural killer (NK) (A) and mucosal associated invariant T (MAIT) (B) cells. Genes with a significant response (FDR <0.05) are noted in orange. (C) Violin plots showing the median (dot) and interquartile range (vertical lines) of normalized read counts of two representative NPX genes, KDM6A and EIF2S3, separated by group. FDR calculated from unpaired t-tests; significant differences noted by asterisks (*** p-adj <0.001). (D) Dot plot of the responses of significant NPX genes to sex chromosome complement. Each dot is the log2 fold change (log2FC) in expression of a significant gene (FDR<0.05) within a specific cell type; horizontal line is the median. (E) Heatmap of Pearson correlation coefficients of NPX responses to sex chromosome complement between every pair of cell types ( excluded). (F) Violin plot showing the median (dot) and interquartile range (IQR; vertical lines) of the Pearson correlation coefficients comparing the responses of autosomal and NPX genes to testosterone, estradiol, and sex chromosome complement between every pair of cell types. Significant differences noted by asterisks (*** p-adj <0.001). See also Tables S5-S6.
Figure 6.
Figure 6.. Responses of broadly expressed Xi-expressed genes to sex chromosome complement are preserved across cell types.
(A) Variation in gene-by-gene responses to sex chromosome complement across all 18 cell types in which the gene was expressed. Variation was calculated using the coefficient of variation (CV = standard deviation in effect size across cell types / absolute mean effect size across cell types). Box plots show median (line), interquartile range (IQR; top and bottom of box), and 1.5 * IQR (whiskers) of CV values for non-pseudoautosomal region X-chromosomal (NPX) (orange) and autosomal (blue) genes. Gene sets restricted by absolute mean effect sizes above the indicated thresholds. FDR calculated from unpaired t-tests and asterisks indicate significance (** p-adj <0.01; *** p-adj <0.001). (B) Variation in responses to sex chromosome complement for genes expressed from the inactive and active X chromosomes (Xi-expressed; light orange), only the active X chromosome (Xa-only expressed; dark orange), or autosomes (blue). Analysis limited to genes expressed in at least 5 cell types. Box plots show median (line), interquartile range (IQR; top and bottom of box), and 1.5 * IQR (whiskers) of CV values. FDR calculated from unpaired t-tests and asterisks indicate significance (*** p-adj <0.001). (C) Variation in responses to sex chromosome complement for genes expressed from the indicated groups that are broadly expressed in 17 or 18 cell types. Box plots show median (line), interquartile range (IQR; top and bottom of box), and 1.5 * IQR (whiskers) of CV values. FDR calculated from unpaired t-tests and asterisks indicate significance (* p-adj <0.05; *** p-adj <0.001).

References

    1. Gray JP, Wolfe LD. Height and sexual dimorphism of stature among human societies. Am J Phys Anthropol. 1980;53(3):441–456. doi:10.1002/ajpa.1330530314 - DOI - PubMed
    1. Brix N, Ernst A, Lauridsen LLB, et al. Timing of puberty in boys and girls: A population-based study. Paediatr Perinat Epidemiol. 2019;33(1):70–78. doi:10.1111/ppe.12507 - DOI - PMC - PubMed
    1. Regitz-Zagrosek V. Sex and gender differences in health. EMBO Rep. 2012;13(7):596–603. doi:10.1038/embor.2012.87 - DOI - PMC - PubMed
    1. Morrow EH. The evolution of sex differences in disease. Biol Sex Differ. 2015;6(1):1–7. doi:10.1186/s13293-015-0023-0 - DOI - PMC - PubMed
    1. Ober C, Loisel DA, Gilad Y. Sex-specific genetic architecture of human disease. Nat Rev Genet. 2008;9(12):911–922. doi:10.1038/nrg2415 - DOI - PMC - PubMed

Publication types

LinkOut - more resources