[Preprint]. 2024 Oct 11:2024.10.09.617441.
doi: 10.1101/2024.10.09.617441.

Gender- and Age-Based Characterization and Comparison of the Murine Primary Peritoneal Mesothelial Cell Proteome

Affiliations

Gender- and Age-Based Characterization and Comparison of the Murine Primary Peritoneal Mesothelial Cell Proteome

Zhikun Wang et al. bioRxiv. .

Abstract

Organs in the abdominal cavity are covered by a peritoneal membrane, which is comprised of a monolayer of mesothelial cells (MC). Diseases involving the peritoneal membrane include peritonitis, primary cancer (mesothelioma), and metastatic cancers (ovarian, pancreatic, colorectal). These diseases have gender- and/or age-related pathologies; however, the impact of gender and age on the peritoneal MC is not well evaluated. To address this, we identified and characterized gender- and age-related differences in the proteomes of murine primary peritoneal MC. Primary peritoneal MC were isolated from young female (FY) or male (MY) mice (3-6 months) and aged female (FA) or male (MA) mice (20-23 months), lysed, trypsin digested using S-Traps, then subjected to bottom-up proteomics using an LC-Orbitrap mass spectrometer. In each cohort, we identified >1000 protein groups. Proteins were categorized using Gene Ontology and pairwise comparisons between gender and age cohorts were conducted. This study establishes baseline information for studies on peritoneal MC in health and disease at two physiologic age/gender points. Segregation of the data by gender and age could reveal novel factors to specific disease states involving the peritoneum. [This in vitro primary cell model has utility for future studies on the interaction between the mesothelium and foreign materials.].

Keywords: aging; mesothelial cell; mesothelium; peritoneal proteomics.


Conflict of interest statement

CONFLICT OF INTEREST The authors have no financial or commercial conflicts of interest to declare.

Figures

Figure 1.
Figure 1.. The role of mesothelial cells in peritoneal disease etiology.
Several common peritoneal diseases directly involve mesothelial cells. Peritonitis is caused by bacterial infection triggering an inflammatory response on the mesothelium. Mesothelioma is a primary malignancy resulting from direct malignant transformation of mesothelial cells, commonly resulting from asbestos exposure. Secondary malignancies result from adhesion to and metastatic implantation of the mesothelium by disseminating tumor cells, often resulting in mesothelial cell retraction and anchoring of metastases in the sub-mesothelial matrix.
Figure 2.
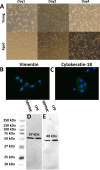
Figure 2.. Validation of murine primary peritoneal mesothelial cells (MPPMC).
(A) Representative morphology of MPPMC cultures collected from young (top panels) or aged (lower panels) mice shown at day 1, 2, and 4, as indicated (100X magnification). (B) Immuno-fluorescent staining of MPPMCs using anti-vimentin antibody (1:100 dilution) in 3% BSA for 1h at 37°C, followed by Alexa-Fluor conjugated secondary antibody (1:300) for 30 minutes at 37°C. Slides were mounted with VECTASHIELD Mounting Media with DAPI. (C) Immunofluorescent staining of MPPMC using anti-cytokeratin-18 antibody (1:100 dilution) in 3% BSA for 1h at 37°C, followed by processing as in (B). (D&E) Western blots of MPPMC and LP9 (human mesothelial cell line) cell lysates (10 ug protein). Lysates were electrophoresed on 9% SDS-PAGE and electroblotted to Immobilon membranes. After blocking with 5% milk/TBST, blots were probed with antibodies directed against (D) vimentin (1:1000 dilution) or (E) cytokeratin-18 (1:500 dilution), washed and incubated with horseradish peroxidase-conjugated secondary antibodies (1:4000) for 1 hour at room temperature. Blots were developed using Super Signal West Dura Extended Duration Substrate (Thermo) and visualized using ImageQuant LAS4000.
Figure 3.
Figure 3.. Overview of proteomic data.
(A) A Venn diagram showing common/unique protein groups between cohorts FA, FY, MA, and MY, having 150, 17, 66, 137 protein groups unique to their individual group, respectively. (B) An upset plot (UpSetR Shiny App) comparing the protein groups identified from the 4 cohorts (49).
Figure 4.
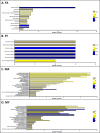
Figure 4.. Gene Ontology Enrichment (GOE) analysis on proteins exclusively to each cohort showing their corresponding biological processes.
Results show histograms listing biological processes that proteins unique to (A) FA, aged female; (B) FY, young female; (C) MA, aged male; (D) MY, young male; are involved. The number of genes involved in each process is shown on the x-axis. Fold enrichment increases from top to bottom. −log10(FDR) increases from yellow to blue.
Figure 5.
Figure 5.. Pairwise comparisons between gender- and age-cohorts.
(A) FA vs. FY, (B) FA vs. MA, (C) MA vs. MY, (D) FY vs. MY. (Left Panels) Common and unique proteins are shown as Venn diagrams. (Right Panels) Volcano plots present proteins significantly (−10log10(p-value) > 13) up-/down- regulated (log2(fold change) > 1). Proteins up-regulated when compared to the “base” are in blue, while those downregulated are in yellow. The gene names for proteins with high significance and fold change are annotated.
Figure 6.
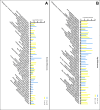
Figure 6.. Secondary comparisons between the pairwise (primary) comparisons from Figure 5.
Comparisons use only proteins with high significance (−10log10(p-value) > 13) and fold change (log2(fold change) > 1) as shown in Figure 5. Gene Ontology Enrichment analysis was performed on each of the 4 primary comparisons. The results are shown as histograms. Each character on the x-axis represents one biological process. The y-axis indicates log2(Fold Enrichment). (A) Comparison , FA vs. MA (blue) is compared to FY vs. MY (yellow); (B) Comparison ②, FA vs. FY (blue) is compared to MA vs. MY(yellow). Any character that has both a blue and yellow bin represents a common biological process shared by the 2 groups.

References

    1. Sodek K. L., Murphy K. J., Brown T. J., & Ringuette M. J. (2012). Cell–cell and cell–matrix dynamics in intraperitoneal cancer metastasis. Cancer Metastasis Rev, 31(1–2), 397–414. doi: 10.1007/s10555-012-9351-2 - DOI - PMC - PubMed
    1. Young V. J., Brown J. K., Saunders P. T. K., & Horne A. W. (2013). The role of the peritoneum in the pathogenesis of endometriosis. Hum Reprod Update, 19(5), 558–569. doi: 10.1093/humupd/dmt024 - DOI - PubMed
    1. Yung S., & Chan T.-M. (2001). Peritoneal mesothelial cells and the extracellular matrix. Nephrology (Carlton, Vic.), 6(6), 250–258. doi: 10.1046/j.1440-1797.2001.00081.x - DOI
    1. Witz C. (2001). Composition of the extracellular matrix of the peritoneum. Journal of the Society for Gynecologic Investigation, 8(5), 299–304. doi: 10.1016/S1071-5576(01)00122-8 - DOI - PubMed
    1. Nagy J. A., & Jackman R. W. (1998). Anatomy and Physiology of the Peritoneal Membrane. Seminars in dialysis, 11(1), 49–56. doi: 10.1111/j.1525-139X.1998.tb00210.x - DOI

Publication types

LinkOut - more resources