[Preprint]. 2024 Oct 9:2023.09.08.556779.
doi: 10.1101/2023.09.08.556779.

Molecular model of a bacterial flagellar motor in situ reveals a "parts-list" of protein adaptations to increase torque

Affiliations

Molecular model of a bacterial flagellar motor in situ reveals a "parts-list" of protein adaptations to increase torque

Tina Drobnič et al. bioRxiv. .

Update in

Abstract

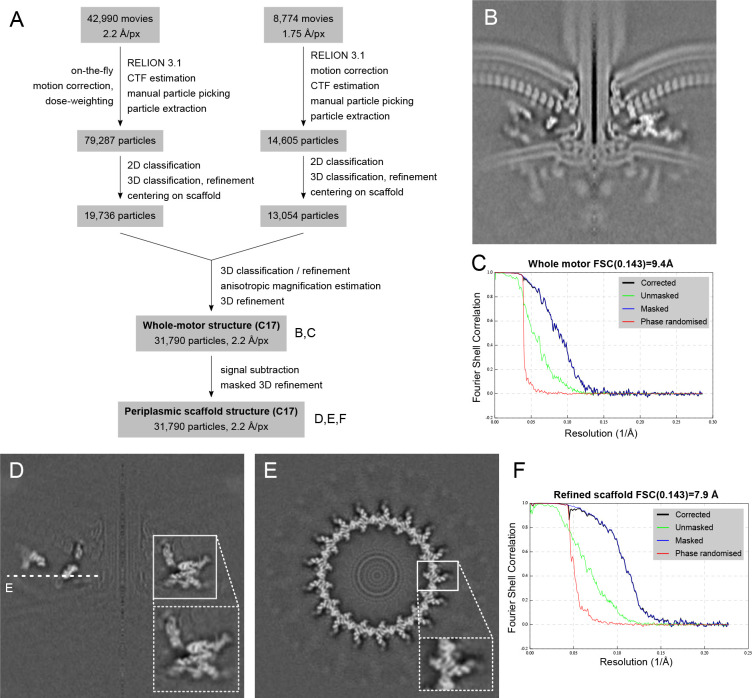
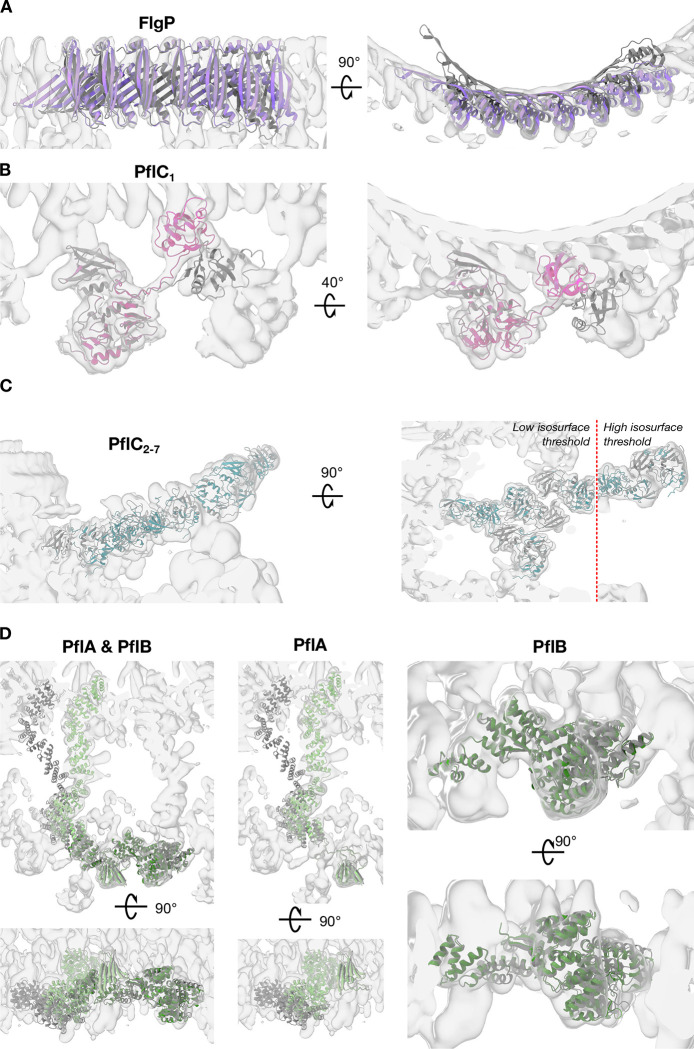
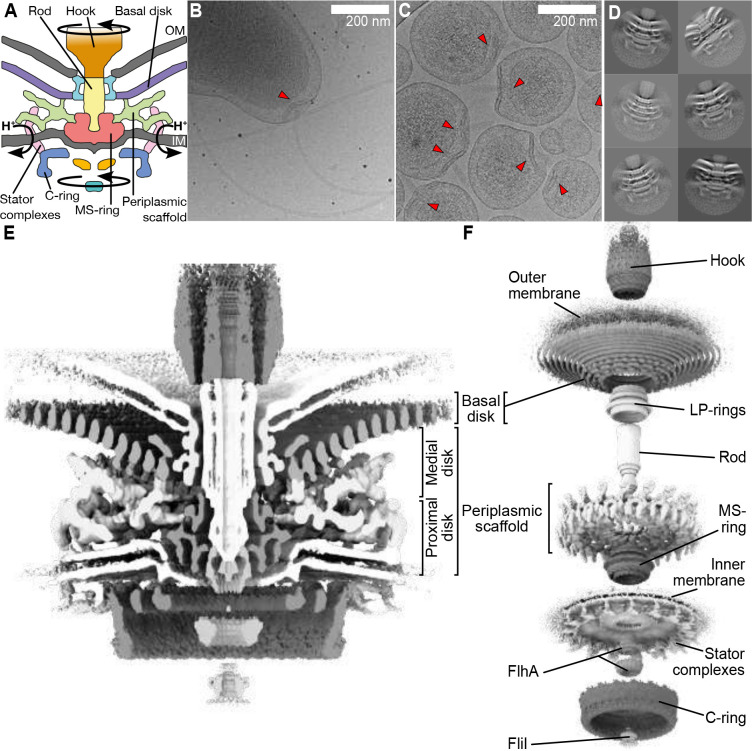
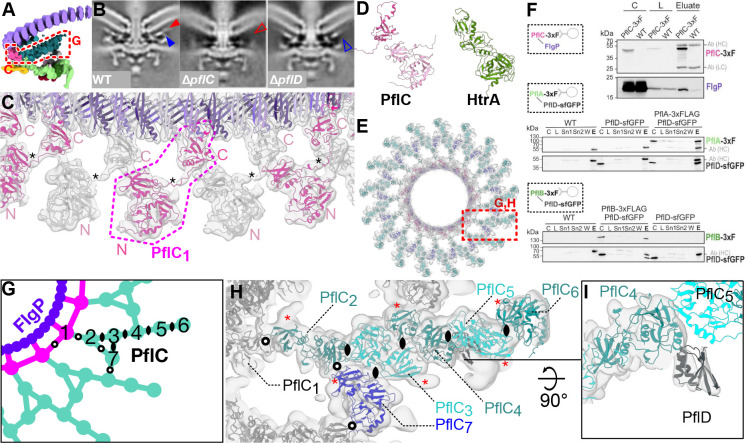
One hurdle to understanding how molecular machines work, and how they evolve, is our inability to see their structures in situ. Here we describe a minicell system that enables in situ cryogenic electron microscopy imaging and single particle analysis to investigate the structure of an iconic molecular machine, the bacterial flagellar motor, which spins a helical propeller for propulsion. We determine the structure of the high-torque Campylobacter jejuni motor in situ, including the subnanometre-resolution structure of the periplasmic scaffold, an adaptation essential to high torque. Our structure enables identification of new proteins, and interpretation with molecular models highlights origins of new components, reveals modifications of the conserved motor core, and explain how these structures both template a wider ring of motor proteins, and buttress the motor during swimming reversals. We also acquire insights into universal principles of flagellar torque generation. This approach is broadly applicable to other membrane-residing bacterial molecular machines complexes.


Conflict of interest statement

Declaration of Interests The authors declare no competing interests.

Figures

Extended Data Figure 1.
Flowchart and resolution estimates of structure determination of the Campylobacter jejuni bacterial flagellar motor using in situ single particle analysis. (A) Simplified flowchart showing the generation of cryoEM volumes. (B) Central slice through the refined whole-motor structure. (C) FSC curve for B. (D) and (E) show slices through the volume of the refined, signal-subtracted periplasmic scaffold. (F) FSC curve for D, E.
Extended Data Figure 2.
Validation of those protein chains modelled in the scaffold map to subnanometre resolution. (A) Map-model FSC curves for protein models refined into the scaffold map: FlgP, PflA, PflC1, and PflC2–7 calculated in Phenix, alongside images of excised pieces of the density map corresponding to individual proteins. High and low isosurface thresholds are denoted by solid and mesh surfaces, respectively, to illustrate fit of models into secondary structure densities. (B) Cross-correlation per residue plots of proteins docked into the map: PflB, FliL, MotB, PflD, calculated using Phenix. Mean CC values are shown with dashed line and in text inset.
Extended Data Figure 3.
Comparison of AlphaFold2 starting models with final structures after flexible fitting. (A) AlphaFold2 prediction of FlgP (dark grey) required bending of the oligomer to fit the curvature of the first ring of the basal disk (purple). (B) AlphaFold2 prediction of PflC1 required independent rigid-body docking of the N- and C-terminal domains (magenta). (C) The resulting N-terminal domain of PflC was rigid-body docked into density multiple times for PflC2–7. C-terminal domains were not modelled. Higher thresholds required for more peripheral, and presumably more flexible, components. (D) PflA and PflB AlphaFold2 models (dark grey) required bending to fit into density maps (pale and dark green for PflA and PflB, respectively).
Extended Data Figure 4.
Discrete steps in flagellar rotation are similar to those in E. coli. (A) Kernel density estimation bead position plots over many rotations for 11 cells. Measurements were of duration 20 to 240 seconds, substantially de-energized by CCCP to slow rotation. Their (x,y) histograms, a kernel density of the angular position, and the weighted power spectrum are depicted. The top left is the trace shown in Fig. 2. (B) Weighted power spectrum of all 11 traces.
Extended Data Figure 5.
PflC (a previously unknown glycoprotein) resembles an inactivated HtrA that forms oligomerises in vitro, regulated by its C-terminal PDZ domain. (A) Multiple sequence alignment of PflC and HtrA protease domains from species in the sister clades Campylobacter and Sulfurospirillum. Alignment is based on structural alignments of PflC and HtrA models, with local sequence re-alignments. Asterisks highlight catalytic triad residue locations that are conserved as His-Asp-Ser in HtrA but not PflC. (B) Structurally aligned PflC (left) and HtrA (right), highlighting location of the protease domain. (C) The His-Asp-Ser catalytic triad in the protease domain of HtrA (green) is not conserved in PflC (pink). (HtrA PDBID: 6Z05). (D) Structural alignment of the HtrA domains of HtrA and PflC in ChimeraX Matchmaker. RMSD between pruned atom pairs 1.3 Å, across all atoms 10.4 Å. (E) Oligomerisation of PflC is regulated by its C-terminal domain: (i) Size Exclusion Chromatography of PflC (red) along with protein standards (grey) showing elution volume. (ii) Calibration graph showing a dimer of PflC (red) corresponding to retention times during elution. (iii) Mass photometry measurements of purified PflC (replicates). (iv) Size Exclusion Chromatography of PflCN (Δ236–349, green) along with protein standards (grey) showing elution volume. (v) Calibration graph of PflCN (green) corresponding to retention times during elution. (vi) Mass photometry measurements of purified PflCN. Theoretical masses are shown in the inserts. The instrument’s limit of detection is 35 kDA, meaning the monomer mass is larger than otherwise expected.
Extended Data Figure 6.
Mass photometry shows that PflA dimerises with PflB via its N-terminal β-sandwich domain. (A-D) Mass photometry measurements of purified PflA and PflB constructs show the proteins are mainly monodisperse. There is a dimer peak present for the PflAΔCter construct, likely due to a reduction in stability and solubility. (E-G) Mass photometry measurements of mixtures of PflB and PflA variants. Dimer peaks appear only when β-sandwich and linker domain of PflA is present. In panels E and G, monomer peaks of PflA and PflB are not resolved due to their similar molecular weights. In the bottom panel, the 54 kDa peak corresponds to PflAΔCter, and the 79 kDa peak to PflB. Broadly, monomer peaks have a yellow background, dimer peaks red.
Figure 1.
Figure 1.
Engineering of homogenous Campylobacter jejuni minicells enabled us to determine the in situ structure of a flagellar motor by single particle analysis electron cryo-microscopy (A) Schematic of the flagellar motor from C. jejuni. Proton flux through the stator complexes drives rotation of the C-ring, MS-ring, rod, and hook/filament. In C. jejuni and other Campylobacterota, a basal disk and periplasmic scaffold have evolved that scaffold a wider ring of additional stator complexes thought to be increase motor torque. IM/OM: inner/outer membrane (B) wildtype C. jejuni cells typically provide 1 flagellar motor per field of view (arrowhead) as compared to (C) many motors per field of view in our minicell strain (arrowheads), greatly increasing throughput and reducing sample thickness for higher quality electron micrograph acquisition. Note that curvature of minicells is comparable to wildtype cells (D) Periplasmic and cytoplasmic features are evident in single particle analysis 2-D classes of manually picked motors. (E) Cross-section through an isosurface rendering of a C17 whole-motor 3-D reconstruction. (F) Map from (E), segmented and exploded along the z-axis to highlight component structures.
Figure 2.
Figure 2.
The basal disk is comprised of many concentric rings of FlgP that encircle the LP-rings. (A) Focused C17 refinement of the periplasmic scaffold and inner ring of the basal disk shows that the scaffold attaches to the innermost ring of the basal disk, which itself is a series of concentric rings. Different sections of the periplasmic scaffold and basal disk in colour. (Right) One asymmetric unit of the periplasmic scaffold structure in side view highlighting components. Asterisks denote additional densities attached beneath the first five rings of the basal disk. Note that second and subsequent rings of the basal disk were not part of the focused refinement. (B) The innermost basal disk ring fits 51 FlgP monomers as 17 trimeric protomers (C) Fit of a FlgP trimer into density. Each protomer interacts with the 17-fold symmetric density of the medial disk (asterisks). (D) Top view of a fit of seven FlgP monomers into density map. (E) Density of 10 concentric rings (left) and fitted models (right). (F) FlgP has an unstructured N-terminal linker followed by an SHS2-like fold exemplified by dodecin (PDBID: 1MOG), and shared with Lpp20 of Helicobacter pylori (PDBID: 5OK8) and FlgT of Vibrio alginolyticus (PDBID: 3W1E). All are OM-associated and FlgT is a flagellar component, indicating shared evolutionary origin. (G) AlphaFold model of FlgQ with signal sequence removed has a double β-hairpin that resembles a two-protomer repeat of FlgP. (H) Tagging FlgQ with mCherry, the resulting motor is indistinguishable from WT. (I) The Campylobacter jejuni LP-rings have comparable diameters to the 26-fold symmetric Salmonella enterica serovar Typhimurium LP-rings. The density map of the Salmonella LP-rings (EMD-12183) was low-pass filtered to 15 Å-resolution and lathed to enable like-for-like comparison with the C. jejuni LP-rings. The Salmonella L- and P-rings are 69 Å and 65 Å diameter, compared to 70 Å and 68 Å in C. jejuni Green arrowhead indicates the location of Salmonella YecR; blue arrowhead indicates the location of unidentified C. jejuni density. (J) Support for the C. jejuni LP-rings having comparable stoichiometry to E. coli and Salmonella from detection of close to 26 steps in flagellar rotation. Top: kernel density estimation of bead position as a function of rotational angle. Bottom: weighted power spectrum of angular position; grey dashed line marks 26 to guide the eye; this example is most consistent with 25 steps. Inset: x,y-position histogram with density represented by darkness of coloration. See Extended Data Fig. 4 for ten other traces.
Figure 3.
Figure 3.
The medial disk is composed of a lattice of previously-unidentified PflC, decorated with PflD and interacts with the basal and proximal disks. (A) The medial disk is situated between the basal disk and proximal disk. (B) Comparing the WT motor structure (from EMD-3150) to a pflC deletion reveals abolished assembly of the medial disk (empty red arrowhead; filled red arrowhead on WT structure), while pflD deletion abolishes assembly of a post-like density between the medial and proximal disks (empty blue arrowhead; filled blue arrowhead on WT structure). (C) An inner ring of 17 domain-swapped PflC protomers (alternating grey/pink) attach to every third FlgP in the 51-protomer inner ring of the basal disk (purple). A single PflC protomer (magenta outline) features domains from two proteins. Black asterisks denote location of the linker helix between two domains of one protein (D) Predicted structure of PflC highlights common folds and domain architecture with HtrA, a periplasmic protease. (E) Top view of the medial disk viewed from outside the cell. Every asymmetric unit (dashed red box) features seven PflC proteins and one PflD protein as further investigated in panels G and H. PflC1 represented in pink as per panel C; PflC2,4,6 in teal; PflC3,5 in cyan; PflC7 in blue. (F) PflC and PflD interact with known flagellar disk structure components: (top) Western blot analysis of coIP experiment of PflC-3xFLAG. As control, untagged wild-type cells (WT) were used. Detected heavy (HC) and light (LC) antibody chains are indicated. C: culture; L: lysate. (middle) Western blot analysis of coIP experiment of PflA-3xFLAG, PflD-sfGFP double tagged strain. As controls, PflD-sfGFP and untagged wild-type (WT) cells were used. Detected heavy (HC) antibody chains are indicated. C: culture; L: lysate; Sn1/2: supernatant 1/2; W: wash; E: eluate. (bottom) Western analysis of coIP experiment of PflB-3xFLAG, PflD-sfGFP double tagged strain. As controls, PflD-sfGFP and untagged wild-type cells were used. Detected heavy (HC) antibody chains are indicated. C: culture; L: lysate; Sn1/2: supernatant 1/2;W: wash; E: eluate. (G) Schematic illustrating the differential oligomerisation of PflC protomers within the medial disk’s lattice. Twofold symmetry axis symbols highlight symmetric dimerization interfaces with axes approximately perpendicular to the plane of the lattice; empty circles represent asymmetric interfaces. Three equivalent twofolds exist: 2:3 and 4:5; 3:4 and 5:6; and 3:7, although the 3:7 interface is substantially warped (H) Molecular model of the PflC lattice fitted in our density map denoting symmetry elements relating monomers enlarged from red box in panel E. Densities adjacent to every Asn239 denoted by red asterisks correspond to an established glycosylation site of a PflC from a closely-related species. Symmetry elements as per panel F. (I) side view depicting PflD sitting beneath PflC4,5.
Figure 4.
Figure 4.
PflA and PflB form a spoke-and-rim structure that scaffolds 17 stator complexes. (A) Location of the proximal disk in the periplasmic scaffold denoted by dashed red line. Asterisks denote unassigned densities: the PflD-adjacent density (*), E-ring (**), and peripheral cage (***) (B) Top view of the 17-fold symmetric proximal disk. Dashed red box denotes the asymmetric unit illustrated in panel C. (C) Every asymmetric unit features one PflA, one PflB, an arc of four FliL, and one stator complex (itself composed of five copies of transmembraneous MotA and two copies of periplasmic MotB). PflA (light green) is positioned radially like spokes, interacting at its N-terminal end with a rim of PflB (dark green) at the outer edge of the scaffold. An arc of FliL (red) and periplasmic domain of MotB (pink, residues 68–247) are also evident at lower confidence. Inset: focus on FliL at lower threshold to demonstrate match of four FliL models into four periodic densities. (D) Deletion of fliL has only a minor effect on motility. A representative motility agar plate stabbed with WT and fliL::cat demonstrates that fliL knockout has only a minor effect on motility. (E) Mass photometry measurements confirm the PflAB dimer (red background) forms in vitro. Inset: 100 nm × 100 nm crosssection through the subtomogram average density map of the WT motor exhibits PflAC (filled red arrowhead) and PflB densities (filled blue arrowhead). Structure from EMD-3150. (F) Mass photometry shows that deleting the PflA β-sandwich and linker abolishes dimerization with PflB. Inset: 100 nm × 100 nm crosssection through a density map of the subtomogram average of this mutant reveals a vestigial PflAC density (filled red arrowhead) and loss of PflB (empty blue arrowhead), whereas (G) a 100 nm × 100 nm cross-section through a density map of the subtomogram average of a PflA deletion further lacks the vestigial PflAC density (empty red arrowhead) (structure from EMD-3160).
Figure 5.
Figure 5.
Wider rings of additional stator complexes are incorporated in the Campylobacter jejuni periplasmic scaffold while the rotor components are correspondingly wider. (A) Cross-section the wildtype C. jejuni motor depicting locations of stator and rotor cross-sections illustrated in panels B and D. (B) Cross-section through the whole-motor map just beneath the outer membrane shows 17 circular densities at the expected location of MotA. (C) A focused refinement of the stator complexes reveals pentameric densities, that (C) In cross-section have the distinctive thimble-like shape of a MotA pentamer, from PDB 6ykm. (D) Cross-section through the C. jejuni C-ring showing 38-fold periodic structure. Arrowheads highlight 5 of the 38 puncta. Labels (E) and (F) denote cross-sections depicted in respective panels. (E) Cross-section through the centre of the C. jejuni C-ring; (F) cross-section through the edge of the C-ring showing post-like densities corresponding to the periodicity shown in panel (D) (arrowheads) as have been reported in the Salmonella C-ring. (G) Cross-section through a composite map of the Salmonella enterica serovar Typhimurium MS-ring (from EMD-12195) and C-ring (from EMD-42439) rotor components depicting the 51 Å-radius MS-ring β-collar. Both maps were low-pass filtered to 15 Å-resolution and lathed around their rotational axis to allow like-for-like comparison with (H) cross-section through a composite map of the whole-motor C. jejuni map, with superimposed cross-sections through focused, lathed C. jejuni MS-ring and C-ring maps, highlighting the wider 62 Å-radius β-collar.
Figure 6.
Figure 6.
A “parts-list” of protein adaptations to increase torque by scaffolding a wider ring of additional stator complexes, thus exerting greater leverage on the axial flagellum. A partial-cutaway schematic of the structure of the Campylobacter jejuni flagellar motor contextualising protein components modelled in this study. The basal disk is formed of FlgP; the medial disk of PflC and PflD; the proximal disk of PflA, PflB, and FliL together with stator complex components MotA and MotB. Asterisks on transparent density denote unassigned densities: a PflD-adjacent density (*), E-ring (**), and peripheral cage (***).

References

    1. Johnson A. D. The rewiring of transcription circuits in evolution. Current Opinion in Genetics & Development 47, 121–127 (2017). - PMC - PubMed
    1. Bridgham J. T., Carroll S. M. & Thornton J. W. Evolution of hormone-receptor complexity by molecular exploitation. Science 312, 97–101 (2006). - PubMed
    1. Finnigan G. C., Hanson-Smith V., Stevens T. H. & Thornton J. W. Evolution of increased complexity in a molecular machine. Nature 481, 360–364 (2012). - PMC - PubMed
    1. Pillai A. S. et al. Origin of complexity in haemoglobin evolution. Nature 581, 480–485 (2020). - PMC - PubMed
    1. Schulz L. et al. Evolution of increased complexity and specificity at the dawn of form I Rubiscos. Science 378, 155–160 (2022). - PubMed

Publication types

LinkOut - more resources