[Preprint]. 2024 Oct 11:2024.10.10.617668.
doi: 10.1101/2024.10.10.617668.

RPS19 and RPL5, the most commonly mutated genes in Diamond Blackfan anemia, impact DNA double-strand break repair

Affiliations

RPS19 and RPL5, the most commonly mutated genes in Diamond Blackfan anemia, impact DNA double-strand break repair

Nicholas F DeCleene et al. bioRxiv. .

Abstract

Diamond Blackfan anemia (DBA) is caused by germline heterozygous loss-of-function pathogenic variants (PVs) in ribosomal protein (RP) genes, most commonly RPS19 and RPL5. In addition to red cell aplasia, individuals with DBA are at increased risk of various cancers. Importantly, the mechanism(s) underlying cancer predisposition are poorly understood. We found that DBA patient-derived lymphoblastoid cells had persistent γ-H2AX foci following ionizing radiation (IR) treatment, suggesting DNA double-strand break (DSB) repair defects. RPS19- and RPL5-knocked down (KD) CD34+ cells had delayed repair of IR-induced DSBs, further implicating these RPs in DSB repair. Assessing the impact of RPS19- and RPL5-KD on specific DSB repair pathways, we found RPS19-KD decreased the efficiency of pathways requiring extensive end-resection, whereas RPL5-KD increased end-joining pathways. Additionally, RAD51 was reduced in RPS19- and RPL5-KD and RPS19- and RPL5-mutated DBA cells, whereas RPS19-deficient cells also had a reduction in PARP1 and BRCA2 proteins. RPS19-KD cells had an increase in nuclear RPA2 and a decrease in nuclear RAD51 foci post-IR, reflective of alterations in early, critical steps of homologous recombination. Notably, RPS19 and RPL5 interacted with poly(ADP)-ribose chains noncovalently, were recruited to DSBs in a poly(ADP)-ribose polymerase activity-dependent manner, and interacted with Ku70 and histone H2A. RPL5's recruitment, but not RPS19's, also required p53, suggesting that RPS19 and RPL5 directly participate in DSB repair via different pathways. We propose that defective DSB repair arising from haploinsufficiency of these RPs may underline the cancer predisposition in DBA.


Conflict of interest statement

Conflict-of-interest disclosure: The authors declare no competing financial interests.

Figures
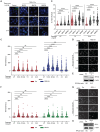
Figure 1.
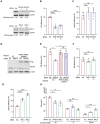
Figure 1.. DBA patient-derived LCLs with mutations in RPS19 or RPL5 have delayed resolution of γ-H2AX foci and RPS19- and RPL5-knocked down (KD) CD34+ cells have impaired DSB repair.
(A) Representative images of cells analyzed for γ-H2AX foci from DBA or a control LCL that were untreated (UT) or treated with 2 Gy IR and harvested at 1 and 24 hr. DAPI was used for nuclear counterstaining. Bar, 8 μm. (B) Quantification of γ-H2AX foci in LCLs treated as in A using high throughput microscopy and single-cell image analysis. A minimum of 34 cells were analyzed per condition. (C) Neutral comet assays of siRNA KD RPS19-1 or scrambled (Scr) CD34+ cells that were UT or treated with 10 Gy IR were analyzed at the indicated time points post IR. (D) Representative images of cells analyzed in C. Bar, 50 μM. (E) Western blot of RPS19-1 KD CD34+ cells assessing the protein levels of RPS19. β-actin is used as a loading control. (F) Neutral comet assays of siRNA KD RPL5-1 or Scr CD34+ cells UT or treated with 10 Gy IR and analyzed at the indicated time points post IR. (G) Representative images of cells analyzed in F. Bar, 50 μM. (H) Western blot of RPL5-1 KD CD34+ cells assessing the protein levels of RPL5. β-actin as a loading control. A minimum of 115 cells were analyzed per condition. Data represent mean ± SD compared using 1-way ANOVA with Dunnett’s multiple comparisons test. Ns not significant; *P < 0.05; **P < 0.01; ***P < 0.001; ****P < 0.0001.
Figure 2.
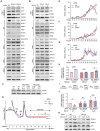
Figure 2.. RPS19-KD U2OS cells have decreased HR repair, whereas RPL5-KD U2OS cells have increased total-EJ repair.
(A) Western blots of RPS19 and RPL5 KD U2OS cells using two different siRNAs for each (RPS19-1, RPS19-2, RPL5-1, and RPL5-2) that target different regions of each transcript. Probed for RPS19 or RPL5. β-actin is used as a loading control. (B) U2OS cells bearing an integrated DR-GFP HR reporter transfected with Scr or one of two RPS19 siRNAs. After 48 hours, cells were co-transfected with an I-SceI-expressing plasmid to induce a DSB in the DR-GFP reporter and a mCherry-expressing plasmid as a transfection control. Forty-eight hours later, cells were analyzed by flow cytometry. The repair efficiency was calculated by the proportion of GFP+ to mCherry+ cells. (C) The same experiment as in B except using U2OS cells with an integrated EJ5-GFP total-EJ reporter. (D) Western blot of U2OS cells with RPS19-1 KD and overexpression of an RPS19 siRNA-resistant plasmid with a 3x-FLAG tag. Probed for RPS19 and FLAG. β-actin used as a loading control. (E) The same experiment as in B, except for an RPS19 siRNA-resistant or an empty vector (EV) plasmid was transfected along with RPS19-1 or Scr siRNA. (F) The same experiment as in B except for using two different RPL5 siRNAs. (G) The same experiment as in C except for using two different RPL5 siRNAs. (H) U2OS cells transfected with Scr, RPS19-1, or RPL5-1 siRNAs for 72 hours, followed by flow cytometry using 7-AAD and BrdU. Data represent mean ± SD compared using 1-way ANOVA with Dunnett’s multiple comparisons test of a minimum of three biological replicates. ns not significant; *P < 0.05; **P < 0.01; ***P < 0.001; ****P < 0.0001.
Figure 3.
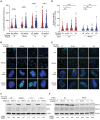
Figure 3.. RPS19-KD U2OS cells have decreased RAD51, BRCA2, and PARP1 protein levels and RAD51 mRNA has reduced association with polysomes in RPS19-KD U2OS cells.
(A) Western blots of RPS19-KD U2OS cells assessing the protein levels of DSB repair factors. β-actin is used as a loading control. (B) Western blots of RPL5-KD U2OS cells assessing the protein levels of DSB repair factors. β-actin is used as a loading control. RAD51 has been shown to have one or two bands depending on the gel percentage used. In both instances, siRNA knockdown has validated the RAD51 band. (C) Western blot assessing RAD51 levels in DBA LCLs derived from healthy control individuals and individuals with pathogenic RPS19 or RPL5 variants. β-actin is used as a loading control. (D) Representative polysome profiles of Scr and RPS19-1 KD U2OS cells. (E) Distribution of RAD51 mRNAs across the different fractions in Scr and RPS19-1 KD U2OS cells. (F) Same as E except assessing PARP1 mRNAs. (G) Same as E except assessing BRCA2 mRNAs. (H) Quantification of RAD51, BRCA2, and PARP1 mRNA levels in RPS19-1 KD U2OS cells normalized to GAPDH and Scr. (I) Schema of proteasomal inhibition experiment. (J) Quantification of RAD51 protein levels in RPS19-1 KD U2OS cells normalized to β-actin and Scr. p21 is used as positive control for proteasome inhibition. (K) Western blot of lysates prepared from RPS19-1 KD cells treated with the proteasomal inhibitor MG132. β-actin is used as a loading control. Data in E–G represent the mean ± SEM of three biological replicates. Data in H and J represent mean ± SD compared using unpaired t-tests of three biological replicates. ns not significant; *P < 0.05; ****P < 0.000.
Figure 4.
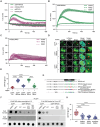
Figure 4.. RPS19-KD cells have increased nuclear RPA2 integrated intensity and decreased nuclear RAD51 foci.
(A) Quantification of nuclear RPA2 integrated intensity in RPS19-1 KD U2OS cells pre-treatment (UT) and following treatment with 10 Gy IR. Representative data of two biological replicates. (B) Representative images of nuclear RPA2 (green) analyzed in A. DAPI (blue) was used for nuclear counterstaining. Yellow box denotes zoomed area. (C) Western blot of total RPA2 protein levels in RPS19-1 KD U2OS cells represented in A. β-actin used as a loading control. (D) Quantification of cells with ≥5 nuclear RAD51 foci in RPS19-1 KD U2OS cells pre-treatment (UT) and following treatment with 10 Gy IR. Representative data of two biological replicates which were combined. (E) Representative images of nuclear RAD51 foci (green) analyzed in D. DAPI (blue) was used for nuclear counterstaining. Yellow box denotes zoomed area. (F) Western blot of total RAD51 protein levels in RPS19-1 KD U2OS cells represented in A. β-actin used as a loading control. Data in A represent mean ± SD compared using unpaired t-tests. Data in D represent mean ± SD compared using 1-way ANOVA with Dunnett’s multiple comparisons test. ns not significant; *P < 0.05; ****P < 0.0001
Figure 5.
Figure 5.. RPS19 and RPL5 are recruited to DSB sites in a PARP-dependent manner.
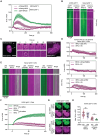
(A) Quantification of percent fluorescent intensity within the region of interest (ROI) of U2OS cells transfected with eGFP-RPS19 (n = 8), mCherry-RPL5 (n = 8), or EVs (n = 3). (B) Quantification of percent fluorescent intensity within the ROI of eGFP-RPS19 transfected U2OS cells treated with PARP (n = 8) or PARG (n = 9) inhibitors. Control is the same as in A. (C) Quantification of percent fluorescent intensity within the ROI of mCherry-RPL5 transfected U2OS cells treated with PARP (n = 8) or PARG (n = 9) inhibitors. Control is the same as in A. (D) Representative images of eGFP-RPS19 and eGFP-RPL5 localization to mCherry-LacI-FokI DSB sites in U2OS cells with and without PARPi treatment. (E) Quantification of D. A minimum of 50 cells were analyzed per condition. (F) Blot of GFP-tagged proteins immunoprecipitated in 293T cells and incubated with 10 nM PAR chains overnight at 4°C (left) or 5 nM PAR chains for 2 hours (right) with or without 1% SDS and probed with a PAR antibody. GFP is used as loading control. (G) Schema of mutations generated within the potential PAR-binding motif of RPS19. (H) Quantification of eGFP-RPS19 WT and mutants localization to mCherry-LacI-FokI DSB sites in U2OS cells. A minimum of 49 cells were analyzed per condition. Data in A–C represent mean ± SEM. Data in E and H represent mean ± SD compared using unpaired t-tests. ****P < 0.0001
Figure 6.
Figure 6.. RPL5 but not RPS19 recruitment is dependent on p53.
(A) Quantification of percent fluorescent intensity within the ROI of U2OS cells transfected with mCherry-RPL5 (n = 8) or Saos2 cells transfected mCherry-RPL5 (n = 7) or eGFP-RPS19 (n = 7). mCherry-RPL5 U2OS same as in Figure 6A. (B) Kymograph of eGFP-RPS19 and mCherry-RPL5 spatial distribution in U2OS and Saos2 cells over 1 min. (C) Representative montage showing mCherry-RPL5 recruitment in U2OS cells which is absent in Saos2 cells. White circle denotes the area of laser irradiation. (D) Quantification of percent fluorescent intensity within the ROI of Saos2 cells transfected with mCherry-RPL5 (n = 9) with WT p53 (n = 8), p53 p.R248Q (n = 7), or p53 ΔCTD (n = 9). (E) Kymograph of eGFP-p53 WT, eGFP-p53 p.R248Q, or eGFP-p53 ΔCTD and mCherry-RPL5 spatial distribution in Saos2 cells over 10 min. (F) Quantification of percent fluorescent intensity within the ROI of U2OS cells transfected with eGFP-RPS19 (n = 24) and Scr siRNA, mCherry-RPL5 (n = 24) and Scr siRNA, eGFP-RPS19 (n = 23) and p53 siRNA, mCherry-RPL5 (n = 23) and p53 siRNA. (G) Representative montage showing eGFP-RPS19 recruitment and lack of mCherry-RPL5 recruitment in U2OS cells treated with p53 siRNA. White arrow denotes the area of laser irradiation. (H) Quantification of the peak normalized intensity within the ROI for eGFP-RPS19 and mCherry-RPL5 recruitment with Scr or p53 siRNA treatment. Data in A, D, and F represent mean ± SEM. Data in H represent unpaired t-tests. ns not significant; **P < 0.01.
Figure 7.
Figure 7.. RPL5 interacts p53 in a MDM2-dependent manner and its association with DSBs involves the 5S RNP and possibly MDM2.
(A) GFP immunoprecipitation (IP) of eGFP-RPS19 and eGFP-RPL5 transfected U2OS cells treated with or without 10 Gy IR. GFP is used as an IP control. β-actin is used as a loading control. (B) GFP IP of eGFP-RPL5 transfected U2OS cells treated with or without 200 nM of the MDM2 inhibitor RG7388. GFP is used as an IP control. β-actin is used as a loading control. (C) Quantification of B relative to input. Data represent three biological replicates. (D) Quantification of eGFP-RPL5 WT and p.N94D mutant localization to mCherry-LacI-FokI DSB sites in U2OS cells. Fifty cells were analyzed per condition. (E) Representative images of blots quantified in D. (F) Quantification of p53 protein levels in RPL5-KD U2OS cells normalized to β-actin and Scr. Data represent three biological replicates (G) Representative western blot of data shown in F. β-actin used as a loading control, Data in C–D represent mean ± SD compared using unpaired t-tests. Data in F represent mean ± SD compared using 1-way ANOVA with Dunnett’s multiple comparisons test. *P < 0.05; **P < 0.01; ****P < 0.0001.

References

    1. Wlodarski MW, Vlachos A, Farrar JE, Da Costa LM, Kattamis A, Dianzani I, Belendez C, Unal S, Tamary H, Pasauliene R, Pospisilova D, de la Fuente J, Iskander D, Wolfe L, Liu JM, Shimamura A, Albrecht K, Lausen B, Bechensteen AG, Tedgard U, Puzik A, Quarello P, Ramenghi U, Bartels M, Hengartner H, Farah RA, Al Saleh M, Hamidieh AA, Yang W, Ito E, Kook H, Ovsyannikova G, Kager L, Gleizes PE, Dalle JH, Strahm B, Niemeyer CM, Lipton JM, Leblanc TM, international Diamond-Blackfan anaemia syndrome guideline p. Diagnosis, treatment, and surveillance of Diamond-Blackfan anaemia syndrome: international consensus statement. Lancet Haematol. 2024;11(5):e368–e382. - PubMed
    1. Ulirsch JC, Verboon JM, Kazerounian S, Guo MH, Yuan D, Ludwig LS, Handsaker RE, Abdulhay NJ, Fiorini C, Genovese G, Lim ET, Cheng A, Cummings BB, Chao KR, Beggs AH, Genetti Ca, Sieff CA, Newburger PE, Niewiadomska E, Matysiak M, Vlachos A, Lipton JM, Atsidaftos E, Glader B, Narla A, Gleizes PE, O'Donohue MF, Montel-Lehry N, Amor DJ, McCarroll SA, O'Donnell-Luria AH, Gupta N, Gabriel SB, MacArthur DG, Lander ES, Lek M, Da Costa L, Nathan DG, Korostelev AA, Do R, Sankaran VG, Gazda HT. The Genetic Landscape of Diamond-Blackfan Anemia. Am J Hum Genet. 2018;103(6):930–947. - PMC - PubMed
    1. Da Costa L, Leblanc T, Mohandas N. Diamond-Blackfan anemia. Blood. 2020;136(11):1262–1273. - PMC - PubMed
    1. Khajuria RK, Munschauer M, Ulirsch JC, Fiorini C, Ludwig LS, McFarland SK, Abdulhay NJ, Specht H, Keshishian H, Mani DR, Jovanovic M, Ellis SR, Fulco CP, Engreitz JM, Schutz S, Lian J, Gripp KW, Weinberg OK, Pinkus GS, Gehrke L, Regev A, Lander ES, Gazda HT, Lee WY, Panse VG, Carr SA, Sankaran VG. Ribosome Levels Selectively Regulate Translation and Lineage Commitment in Human Hematopoiesis. Cell. 2018;173(1):90–103 e119. - PMC - PubMed
    1. Dutt S, Narla A, Lin K, Mullally A, Abayasekara N, Megerdichian C, Wilson FH, Currie T, Khanna-Gupta A, Berliner N, Kutok JL, Ebert BL. Haploinsufficiency for ribosomal protein genes causes selective activation of p53 in human erythroid progenitor cells. Blood. 2011;117(9):2567–2576. - PMC - PubMed

Publication types