

The global, regional, and national patterns of change in the burden of congenital birth defects, 1990-2021: an analysis of the global burden of disease study 2021 and forecast to 2040
- PMID: 39416384
- PMCID: PMC11474384
- DOI: 10.1016/j.eclinm.2024.102873
The global, regional, and national patterns of change in the burden of congenital birth defects, 1990-2021: an analysis of the global burden of disease study 2021 and forecast to 2040
Abstract
Background: Congenital birth defects (CBDs) present enormous challenges to global healthcare systems. These conditions severely impact patients' health and underscore issues related to socioeconomic development and healthcare accessibility and efficiency. Previous studies have been geographically limited and lacked comprehensive global analysis. This study provides global, regional, and national disability-adjusted life years (DALYs) data for four major congenital birth defects-congenital heart defects (CHD), neural tube defects (NTDs), digestive congenital anomalies (DCAs), and Down syndrome (DS) from 1990 to 2021, emphasizing health inequalities. The goal is to offer scientific evidence for optimizing resource allocation, focusing on high-burden populations, and reducing disease burden.
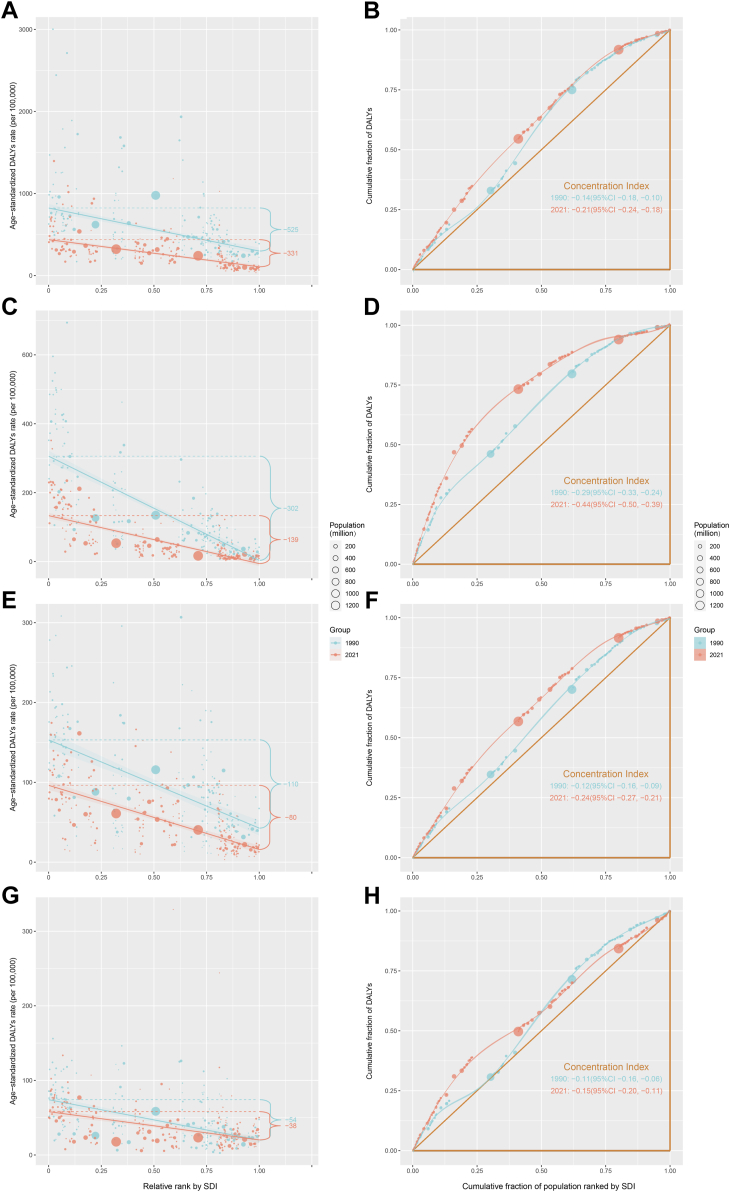
Methods: This study systematically evaluated the global, regional, and national burden of CBDs and their changes from 1990 to 2021 using the Global Burden of Diseases, Injuries, and Risk Factors Study (GBD) 2021. To conduct a more focused analysis, four specific CBDs were selected: CHD, NTDs, DCAs, and DS. DALYs were used as the metric, combined with the sociodemographic index (SDI). Analyses included the slope index of inequality and concentration index to measure health inequalities, frontier analysis to estimate achievable outcomes based on development levels, decomposition analysis to identify drivers of disease burden changes, Joinpoint regression analysis to assess temporal trends, and the Bayesian age-period-cohort (BAPC) model to predict future disease burden trends.
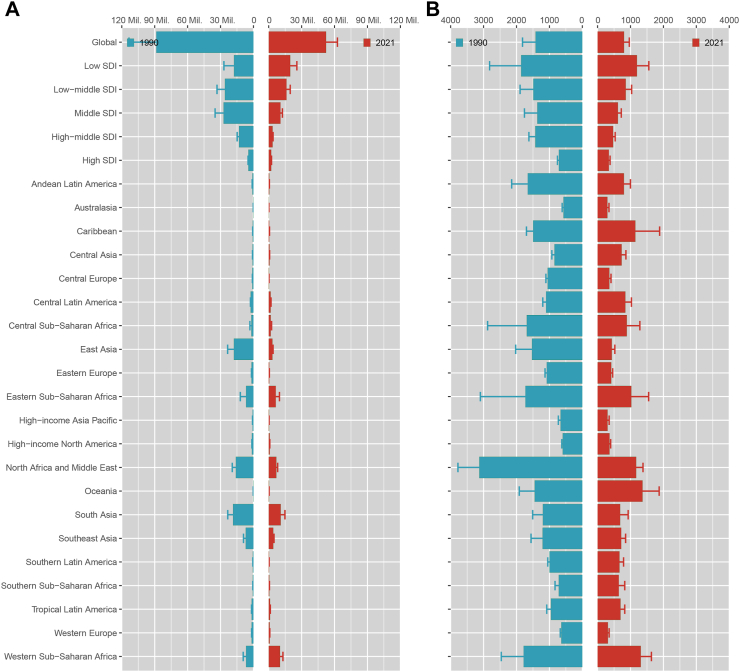
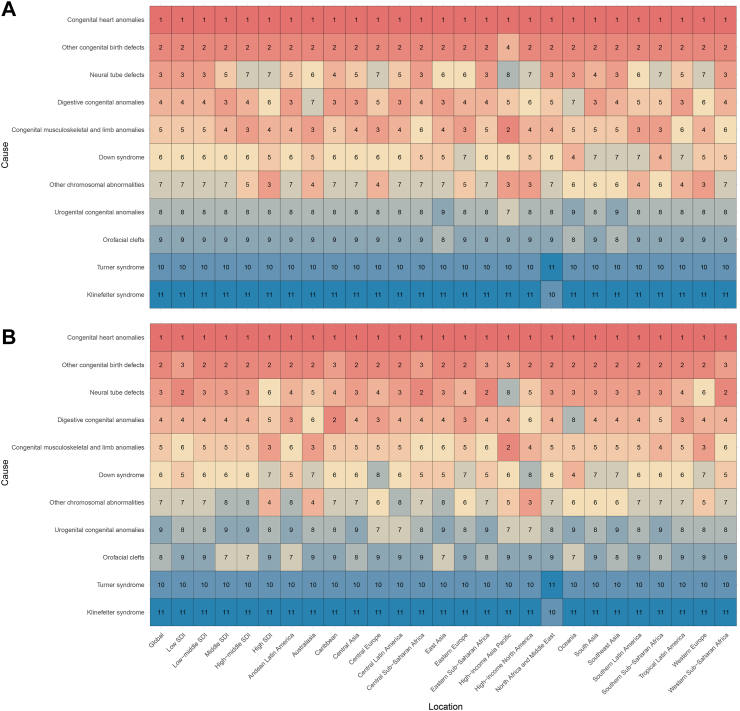
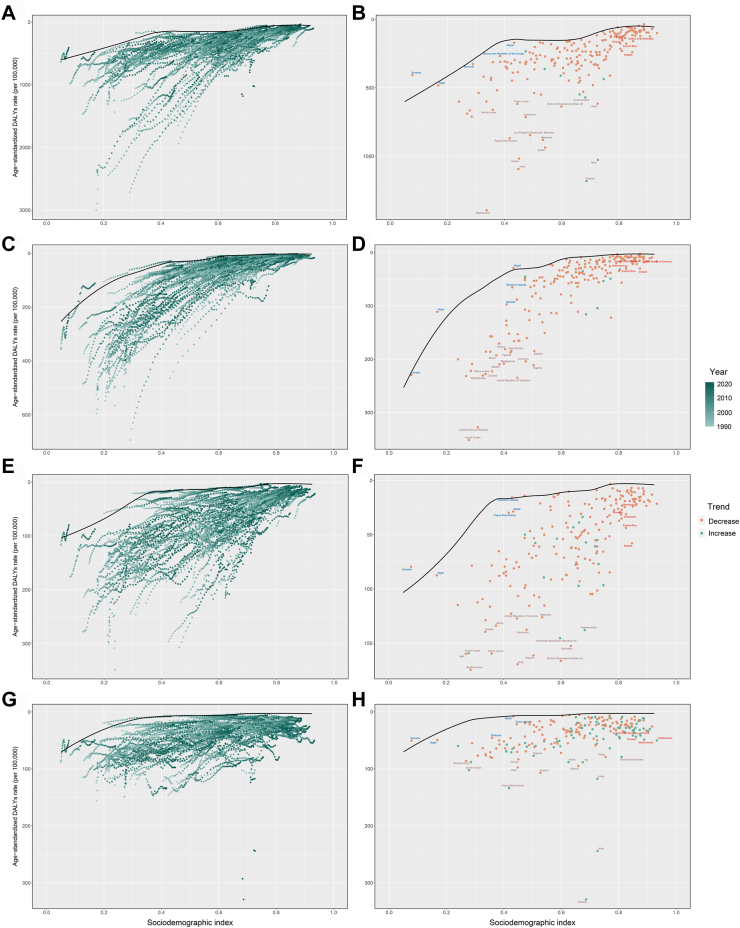
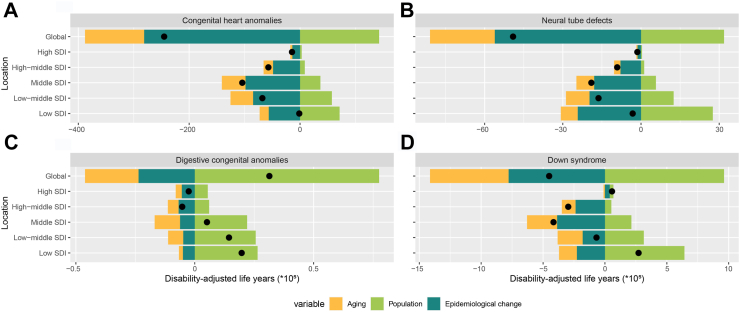
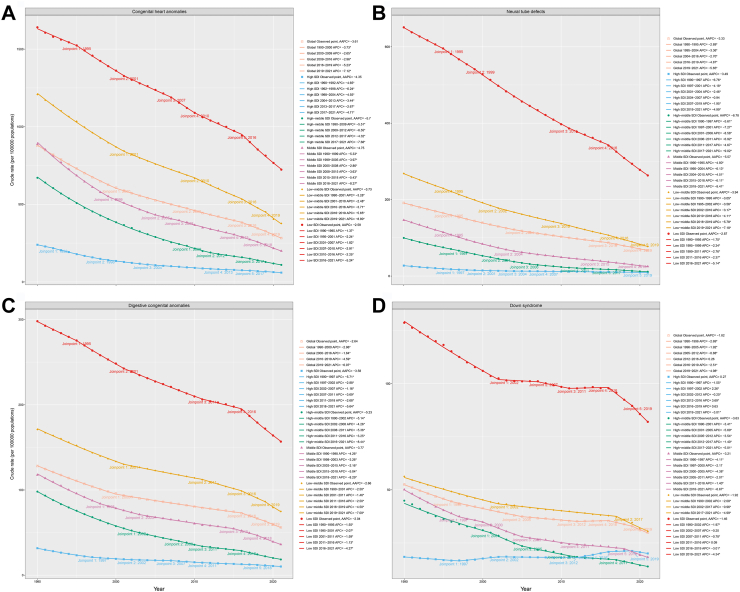
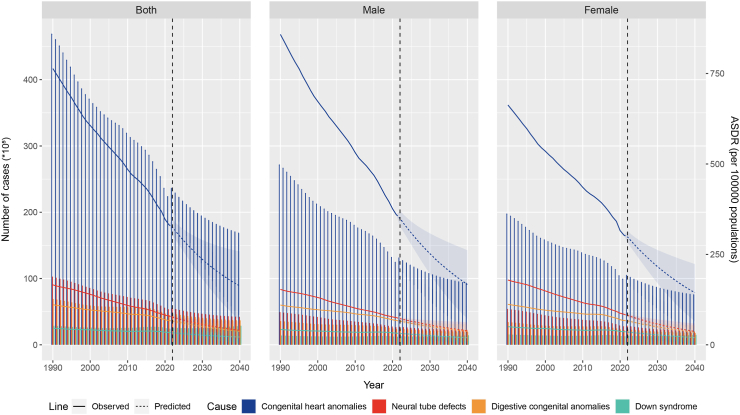
Findings: Compared to 1990, the global burden of the CBDs in 2021 showed a downward trend. Males had a higher burden than females, with the highest burden observed in low-SDI regions. When examining CHD, NTDs, DCAs, and DS specifically, trends in burden changes varied across different CBDs at the global, regional, and national levels. Frontier analysis revealed potential for burden improvement in various countries and territories. Decomposition analysis highlighted differences in disease burden drivers across SDI regions, showing the greatest improvement observed in low-SDI regions. Joinpoint regression analysis indicated a downward trend in DALYs burden across SDI regions, and BAPC model predictions suggested that the burden of CBDs will continue to decline in the future.
Interpretation: CBDs pose a major challenge to global public health. Despite an overall decline in disease burden, health inequalities remain prominent, particularly in countries and territories with lower levels of development. Future public health interventions should focus on countries and territories with low levels of development by optimizing healthcare resource allocation, improving basic health infrastructure, enhancing health education, and reducing disease burden inequalities. Global collaboration and data sharing are essential to promote a lifecycle management model for CBDs research and treatment, advancing global health development.
Funding: This study was supported by the National Natural Science Foundation of China (No. 82270310) and the Jiangsu Provincial Key Research and Development Program (No. BE2023662).
Keywords: Congenital birth defects; Disability-adjusted life-years; Global burden of disease; Health inequality; Sociodemographic index.
© 2024 The Author(s).
Conflict of interest statement
All authors hereby attest that they do not have any conflicts of interest related to this article.
Figures
Similar articles
-
Trends in burden and mortality of congenital birth defects in G20 countries (1990-2021) and predictions for 2022-2040.BMC Pregnancy Childbirth. 2025 Apr 25;25(1):494. doi: 10.1186/s12884-025-07617-w. BMC Pregnancy Childbirth. 2025. PMID: 40281466 Free PMC article.
-
Emerging trends and cross-country health inequalities in congenital birth defects: insights from the GBD 2021 study.Int J Equity Health. 2025 Feb 20;24(1):50. doi: 10.1186/s12939-025-02412-7. Int J Equity Health. 2025. PMID: 39979921 Free PMC article.
-
Global, Regional, and National Temporal Trend and Patterns of Change in the Burden of Asthma From 1990 to 2021: An Analysis of the Global Burden of Disease Study 2021.Clin Exp Pharmacol Physiol. 2025 May;52(5):e70039. doi: 10.1111/1440-1681.70039. Clin Exp Pharmacol Physiol. 2025. PMID: 40186501
-
The epidemiology of pregnancy loss: global burden, variable risk factors, and predictions.Hum Reprod. 2024 Apr 3;39(4):834-848. doi: 10.1093/humrep/deae008. Hum Reprod. 2024. PMID: 38308812 Review.
-
Trends and cross-country inequalities in the global burden of osteoarthritis, 1990-2019: A population-based study.Ageing Res Rev. 2024 Aug;99:102382. doi: 10.1016/j.arr.2024.102382. Epub 2024 Jun 23. Ageing Res Rev. 2024. PMID: 38917934 Review.
Cited by
-
Global health burden and inequality patterns of occupational noise exposure from 1990 to 2019.Sci Rep. 2025 Jul 10;15(1):24844. doi: 10.1038/s41598-025-09575-x. Sci Rep. 2025. PMID: 40640340 Free PMC article.
-
The Challenge in Burden of Pulmonary Arterial Hypertension: A Perspective From the Global Burden of Disease Study.MedComm (2020). 2025 Apr 24;6(5):e70175. doi: 10.1002/mco2.70175. eCollection 2025 May. MedComm (2020). 2025. PMID: 40276646 Free PMC article.
-
Global burden of pneumoconiosis from 1990 to 2021: a comprehensive analysis of incidence, mortality, and socio-demographic inequalities in 204 countries and territories.Front Public Health. 2025 Apr 23;13:1579851. doi: 10.3389/fpubh.2025.1579851. eCollection 2025. Front Public Health. 2025. PMID: 40337738 Free PMC article.
-
The elderly as a population at risk of chronic obstructive pulmonary disease mortality due to ambient ozone exposure: results from the Global Burden of Disease Study 2021.Environ Health. 2025 Aug 4;24(1):53. doi: 10.1186/s12940-025-01212-4. Environ Health. 2025. PMID: 40760464 Free PMC article.
-
Trends and regional disparities in maternal hypertensive disorders among women of childbearing age: a global burden of disease analysis from 1990 to 2021.BMC Pregnancy Childbirth. 2025 Aug 6;25(1):812. doi: 10.1186/s12884-025-07926-0. BMC Pregnancy Childbirth. 2025. PMID: 40770624 Free PMC article.
References
-
- World Health Organization Congenital disorders. 2023. https://www.who.int/health-topics/congenital-anomalies#tab=tab_1 Available at:
-
- World Health Organization Birth defects. 2023. https://www.who.int/news-room/fact-sheets/detail/birth-defects Available at:
-
- Global incidence, prevalence, years lived with disability (YLDs), disability-adjusted life-years (DALYs), and healthy life expectancy (HALE) for 371 diseases and injuries in 204 countries and territories and 811 subnational locations, 1990-2021: a systematic analysis for the global burden of disease study 2021. Lancet. 2024;403(10440):2133–2161. - PMC - PubMed
LinkOut - more resources
Full Text Sources
