. 2024 Oct;14(10):e70044.
doi: 10.1002/ctm2.70044.

Single-cell transcriptional atlas of human breast cancers and model systems

Affiliations

Single-cell transcriptional atlas of human breast cancers and model systems

Julia E Altman et al. Clin Transl Med. 2024 Oct.

Abstract

Background: Breast cancer's complex transcriptional landscape requires an improved understanding of cellular diversity to identify effective treatments. The study of genetic variations among breast cancer subtypes at single-cell resolution has potential to deepen our insights into cancer progression.

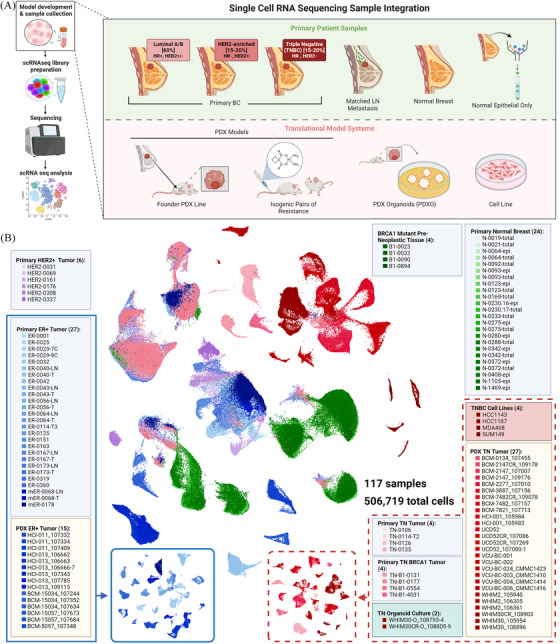
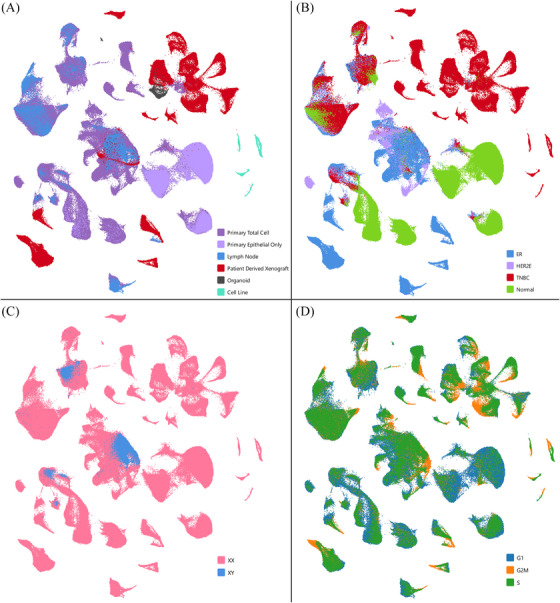
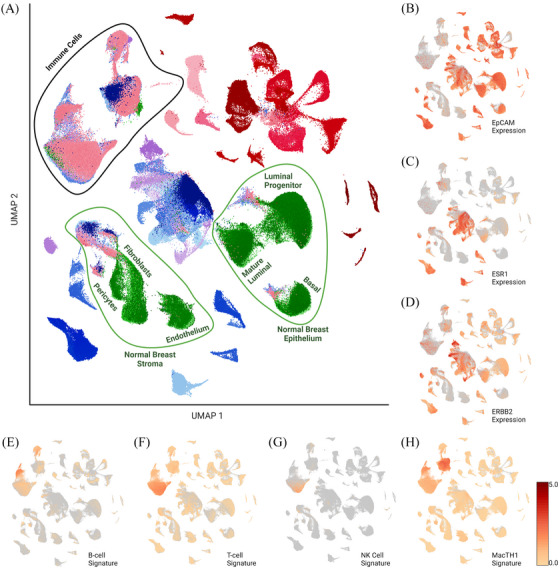
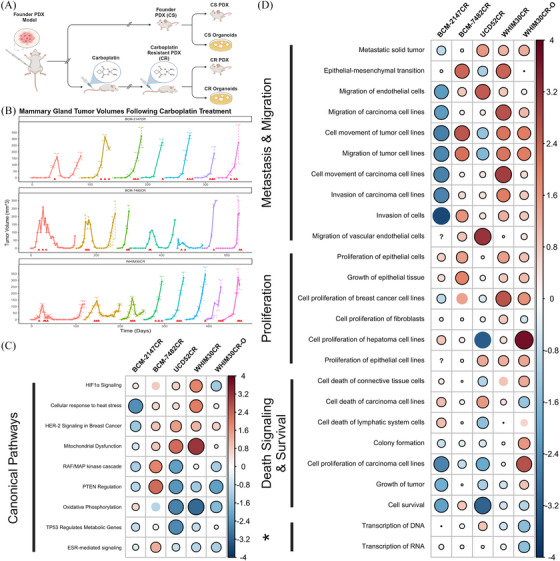
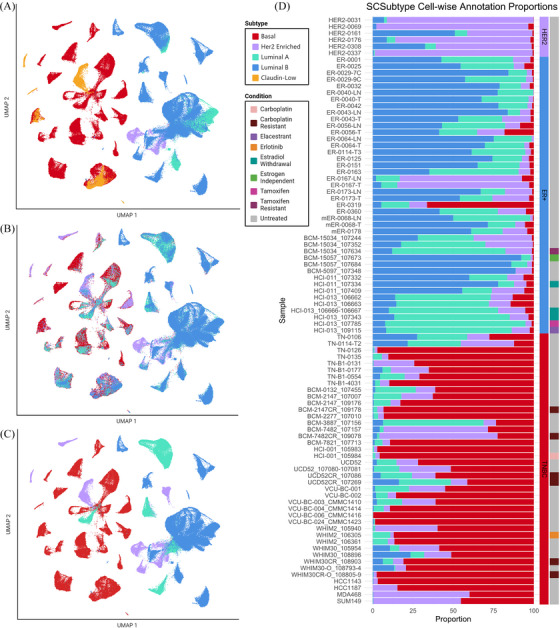
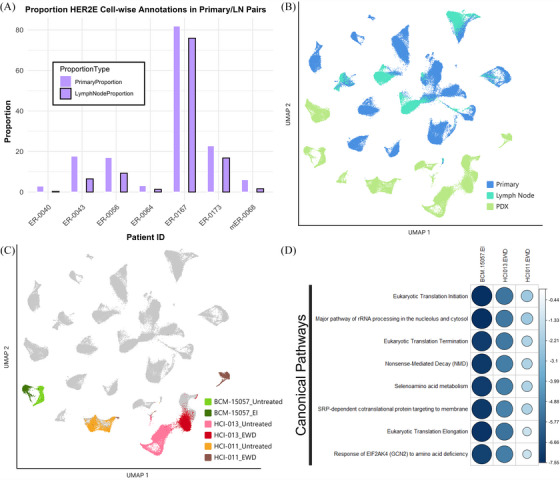
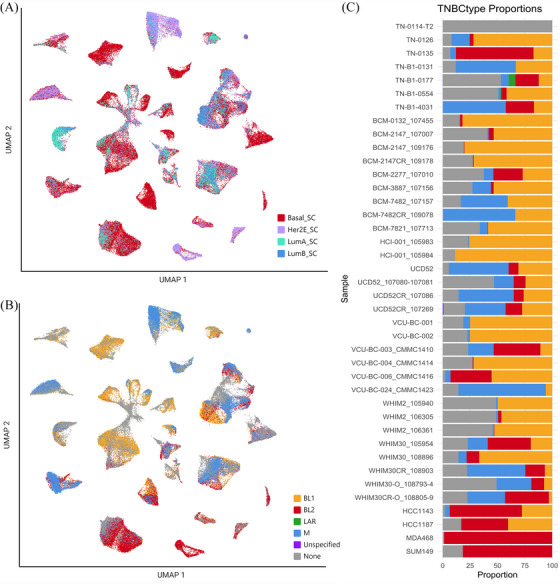
Methods: In this study, we amalgamate single-cell RNA sequencing data from patient tumours and matched lymph metastasis, reduction mammoplasties, breast cancer patient-derived xenografts (PDXs), PDX-derived organoids (PDXOs), and cell lines resulting in a diverse dataset of 117 samples with 506 719 total cells. These samples encompass hormone receptor positive (HR+), human epidermal growth factor receptor 2 positive (HER2+), and triple-negative breast cancer (TNBC) subtypes, including isogenic model pairs. Herein, we delineated similarities and distinctions across models and patient samples and explore therapeutic drug efficacy based on subtype proportions.

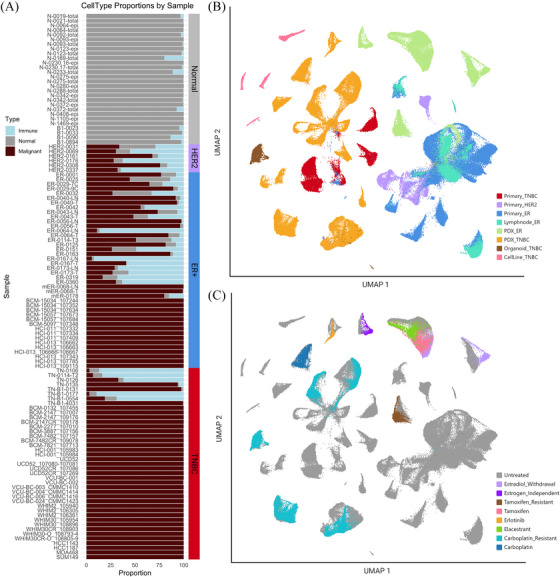
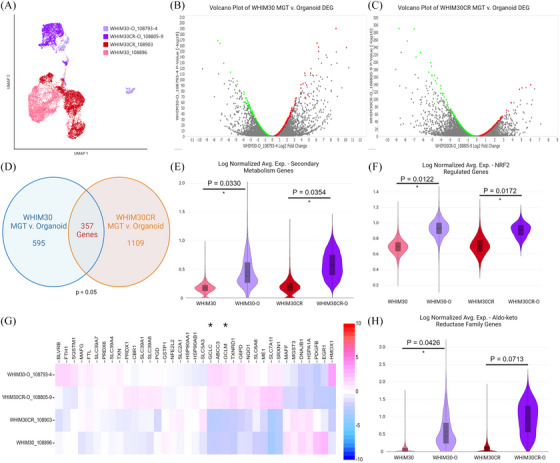
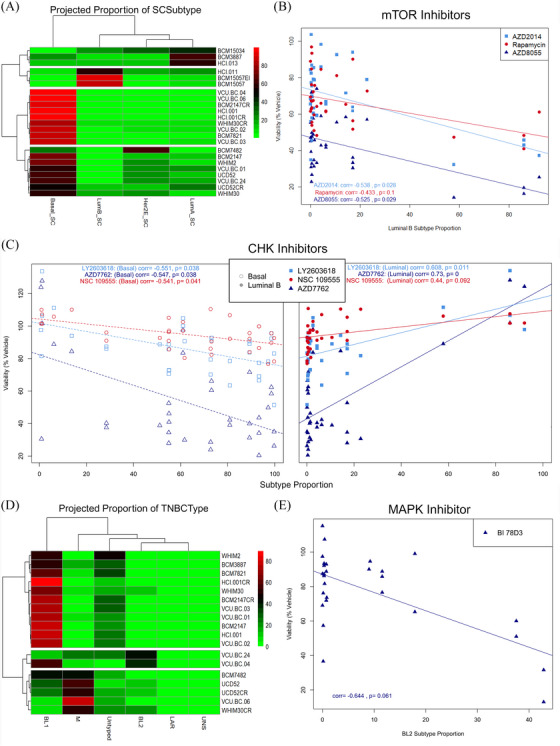
Results: PDX models more closely resemble patient samples in terms of tumour heterogeneity and cell cycle characteristics when compared with TNBC cell lines. Acquired drug resistance was associated with an increase in basal-like cell proportions within TNBC PDX tumours as defined with SCSubtype and TNBCtype cell typing predictors. All patient samples contained a mixture of subtypes; compared to primary tumours HR+ lymph node metastases had lower proportions of HER2-Enriched cells. PDXOs exhibited differences in metabolic-related transcripts compared to PDX tumours. Correlative analyses of cytotoxic drugs on PDX cells identified therapeutic efficacy was based on subtype proportion.

Conclusions: We present a substantial multimodel dataset, a dynamic approach to cell-wise sample annotation, and a comprehensive interrogation of models within systems of human breast cancer. This analysis and reference will facilitate informed decision-making in preclinical research and therapeutic development through its elucidation of model limitations, subtype-specific insights and novel targetable pathways.

Key points: Patient-derived xenografts models more closely resemble patient samples in tumour heterogeneity and cell cycle characteristics when compared with cell lines. 3D organoid models exhibit differences in metabolic profiles compared to their in vivo counterparts. A valuable multimodel reference dataset that can be useful in elucidating model differences and novel targetable pathways.

Keywords: breast cancer; cellular heterogeneity; model limitations; preclinical research; single‐cell RNA sequencing; single‐cell transcriptomics; subtype‐specific insights; targetable pathways; therapeutic drug efficacy.


Conflict of interest statement

The following authors disclosed conflicts of interest. Charles M. Perou is listed as an inventor on patent applications on the Breast PAM50 assay and is an equity stock holder and consultant of BioClassifier LLC. BDL and XSC are inventors (US Patent No. 11788147) of intellectual property (TNBCtype) licensed by Oncocyte Corp; the licensed IP is indirectly related to the work.

Figures

FIGURE 1
FIGURE 1
Data exploration schematic. (A) Diagram showing the sample processing pipeline beginning with sample collection and visually depicting the various model types used in this study. (B) An overview of the samples included within and different integration analysis performed, namely ER+ and TNBC typed sample mappings. Names of the samples are listed under each clustering diagram and the total number of samples shown in parentheses. UMAP visuals of ER+ (blue) and TNBC (red) malignant sample subsets outlined here. Of note, only malignant cell types were used when generating these subset UMAPs.
FIGURE 2
FIGURE 2
Data set visualisation by individual cells. UMAP visualisations, coloured by (A) tissue of origin, (B) clinical type, (C) X chromosome status, and (D) cell cycle phase.
FIGURE 3
FIGURE 3
Identification and removal of non‐malignant cells. (A) Annotated clustering with identified cell types following gene signature analysis. UMAP heatmaps for key genes (B) EpCAM, (C) ESR1, (D) ERBB2 and immune signatures for (E) B cells, (F) T cells, (G) natural killer cells, and (H) combined signature for macrophages, monocyte, and myeloid‐derived cells. Visualisations using log normalised feature averages. Heatmap scale is log normalised average gene expression for each signature.
FIGURE 4
FIGURE 4
Cancer‐only clustering following removal of immune and normal cell clusters. (A) Per cent bar graph showing the proportions of immune (blue), normal (grey), and malignant (garnet) cell types in each sample. Clinical type is annotated by the bar along the right of the graph. UMAP visualisations of cancer‐only cell dataset coloured by (B) tissue of origin and clinical subtype and (C) treatment or condition.
FIGURE 5
FIGURE 5
Transcriptional changes underlying resistance to platinum‐based chemotherapeutics in TNBC models. (A) Workflow schematic demonstrating development of carboplatin resistant (CR) and carboplatin sensitive (CS) pairs. (B) Tumour volume graphs for 3 PDX models contained within (BCM‐2147, BCM‐7482, WHIM30), starting with cells from founding PDX and monitored over serial passage with applied carboplatin treatments. Red arrows indicate the administration of carboplatin via intraperitoneal injection at dosage 40 mg/kg. Each serial passage of cells into new mice is represented by a new segment and colour on the larger parent graph. Of note: final segment of BCM‐7482CR graph represents data from the same cohort as sample BCM‐7482CR_109078. (C, D) Canonical pathways and disease/function annotations differentially regulated in CR models as observed through IPA analysis. The size and colour of the circle represent the z‐score associated with the pathway in that model comparing CS and CR pairs, positive values (blue) indicate activation in CR models, negative values (red) indicate inactivation or downregulation. Statistically significant associations (p  <  .05) are shown by a black border surrounding the circle. ‘?’ indicates insufficient data for z‐score calculation. Generated using the corrplot() function from the corrplot package. * = ‘Alterations in Transcriptional Programming’.
FIGURE 6
FIGURE 6
Differential gene expression analysis of time matched PDX MGT and PDXO in WHIM30 and WHIM30CR. (A) UMAP of reclustering of PDX and PDXO models included in analyses. Volcano plots of differentially regulated genes in (B) WHIM30 PDXO compared to PDX MGT and (C) WHIM30CR PDXO compared to PDX MGT. Genes selected for analysis highlighted in green (downregulated) and red (upregulated), genes were excluded with p‐values > .05 or low average read counts (defined by an average occurrence less than 1 count per cell across the dataset). (D) Venn diagram of overlapping gene count between model sets. Violin plots of log normalised average expression for genes within signatures for (E) secondary metabolism genes, (F) genes regulated by NRF2, and (H) aldo‐keto reductase family genes. p Values from unpaired t‐test. (G) Heatmap visualisation of NRF2 pathway genes as log2 fold change between samples. Glutamate‐cysteine ligase modifier (GCLM) and catalytic subunits (GCLC) annotated with *.
FIGURE 7
FIGURE 7
SCSubtype single‐cell typing methodology on mixed cancer‐only set. (A) UMAP visualisations of cancer‐only cell dataset coloured by sample‐wise pseudo‐bulk PAM50 and claudin‐low centroid predictors. (B) UMAP visualisation of SCSubtype cell‐wise annotations. (C) UMAP visualisation of SCSubtype sample‐wise annotations, as denoted by majority call. (D) Bar graph showing proportion of cells annotated as each of the 4 molecular subtypes classified by SCSubtype, ordered by clinical subtype and model type. Top to bottom: Her2‐enriched primary, ER+ primary, ER+ PDX, TNBC primary, TNBC PDX/PDXO, TNBC cell line. Conditions displayed for each sample in the right‐most bar.
FIGURE 8
FIGURE 8
Transcriptional profiles of ER+ malignant cells reveal model differences. (A) Proportion of HER2‐enriched cell‐wise calls via SCSubtype in matched patient primary and lymph node metastasis. (B) UMAP of ER+‐only subset coloured by model/tissue type. (C) UMAP of ER+‐only subset, coloured by PDX and treated condition. (D) Canonical pathways differentially regulated in estradiol withdrawal (EWD) and estrogen independent (EI) conditions as compared to E2‐treated (untreated) or wild‐type models. The size and colour of the circle represent the z‐score associated with the pathway in that model compared with the untreated pair, positive values (blue) indicate activation in EWD models, negative values (red) indicate inactivation or downregulation. Statistically significant associations (p  <  .05) are shown by a black border surrounding the circle (all). Generated using the corrplot() function from the corrplot package.
FIGURE 9
FIGURE 9
Subtyping comparison in TNBC cancer cell subset. (A) UMAP visualisation of SCSubtype cell‐wise annotations projected onto TNBC‐only subset. (B) UMAP visualisation of TNBCtype cell‐wise annotations. (C) Bar graph showing proportion of cells annotated one of the 4 molecular subtypes classified by TNBCtype, ordered by clinical subtype and model type. Top to bottom: TNBC primary, TNBC PDX/PDXO, TNBC cell line. Of note, ‘Unspecified’ denotes cells, which were not positively correlated with one of the 4 subtypes, and ‘None’ represents those cells which were untyped due to missingness in gene expression.
FIGURE 10
FIGURE 10
Integrative analysis of cell‐wise subtyping with high throughput drug screening data. (A) Projected proportions of SCSubtype cell‐wise call onto relevant PDX models. (B) Scatter plot of cell viability following treatment with 3 mTOR inhibitors as a per cent of vehicle treated cells given varied luminal B subtype proportions. (C) Scatter plots of cell viability following treatment with 3 CHK inhibitors as a per cent of vehicle treated cells given varied basal (left) or luminal B (right) subtype proportions. (Correlation values and adjusted p‐values given for each drug). (D) Projected proportions of TNBCtype cell‐wise call onto relevant PDX models. (E) Scatter plot of cell viability following treatment with MAPK inhibitor (BI 78D3) as a per cent of vehicle treated cells given BL2 subtype proportions.

References

    1. Siegel RL, Miller KD, Wagle NS, Jemal A. Cancer statistics, 2023. Cancer J Clin. 2023;73:17‐48. - PubMed
    1. Desantis CE, Ma J, Gaudet MM. Breast cancer statistics, 2019. Cancer J Clin. 2019;69:438‐451. - PubMed
    1. Ma J, Jemal A. Breast Cancer Metastasis and Drug Resistance: Progress and Prospects. Springer; 2013:1‐18. doi:10.1007/978-1-4614-5647-6_1. Breast Cancer Statistics. ed. Ahmad, A.. - DOI
    1. The Cancer Genome Atlas Network. Comprehensive molecular portraits of human breast tumours. Nature. 2012;490:61‐70. - PMC - PubMed
    1. Kandoth C, Mclellan MD, Vandin F, et al. Mutational landscape and significance across 12 major cancer types. Nature. 2013;502:333‐339. - PMC - PubMed