. 2024 Dec 1;137(6):1554-1562.
doi: 10.1152/japplphysiol.00446.2024. Epub 2024 Oct 17.

Exercise cardiovascular magnetic resonance shows improved diastolic filling by atrioventricular area difference in athletes and controls

Affiliations

Exercise cardiovascular magnetic resonance shows improved diastolic filling by atrioventricular area difference in athletes and controls

Jonathan Edlund et al. J Appl Physiol (1985). .

Abstract

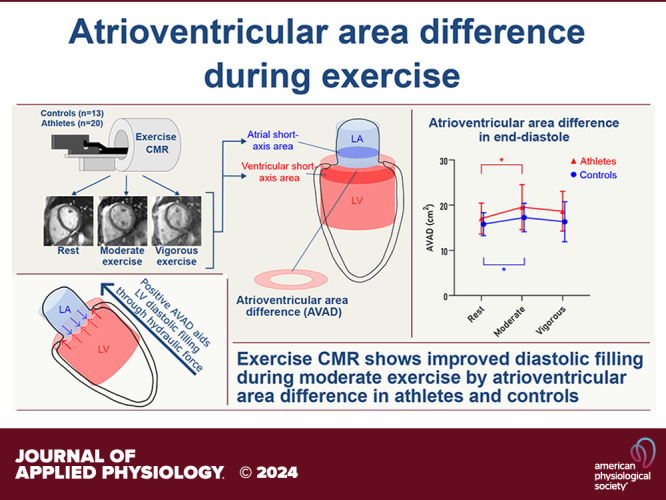
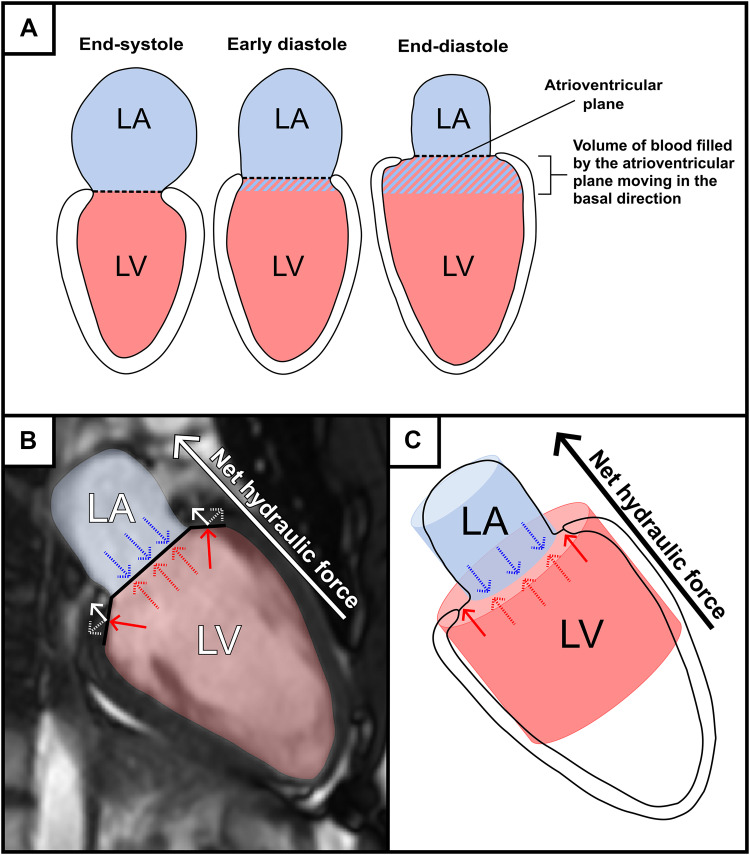
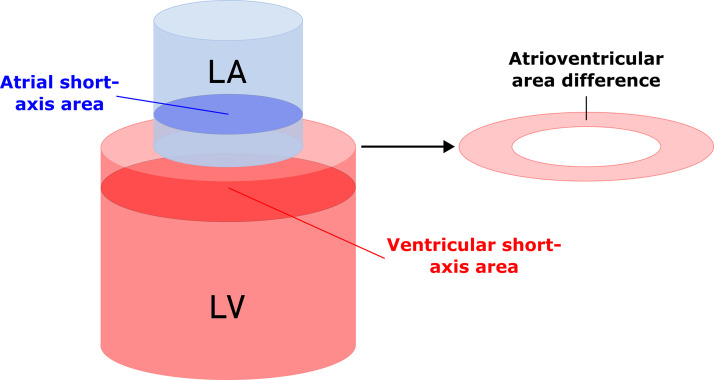
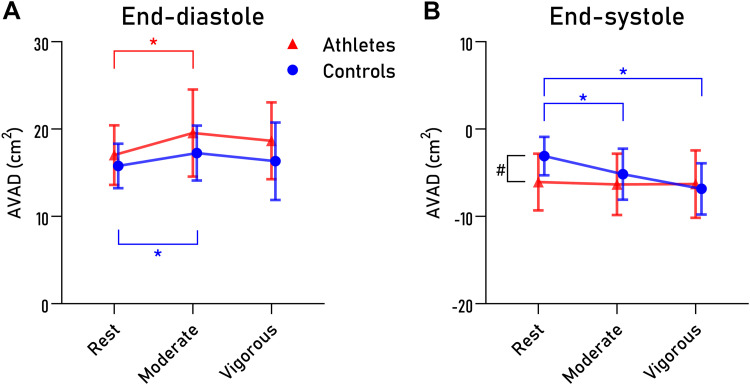
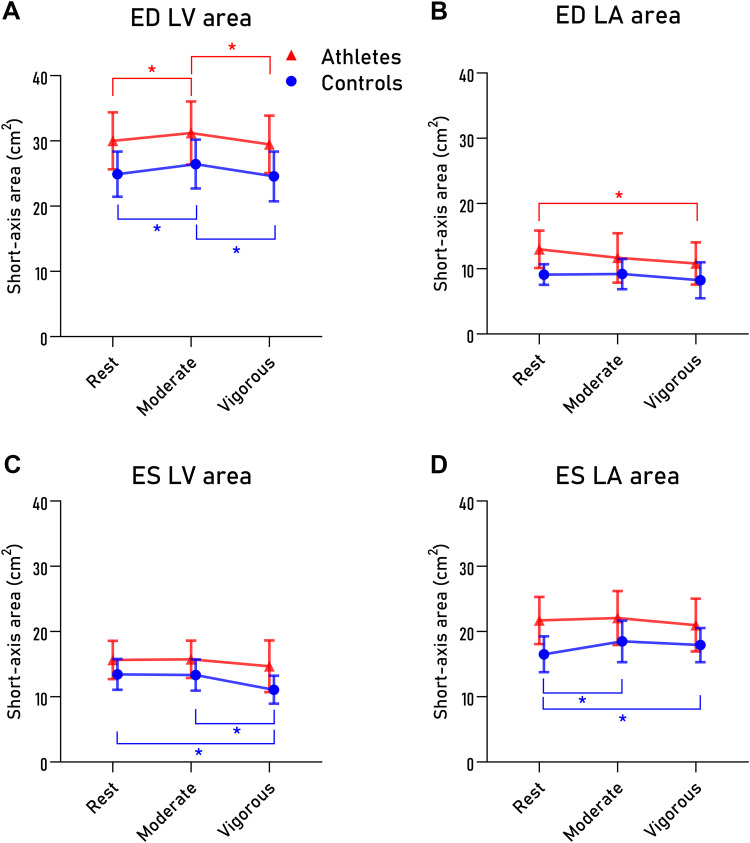
Hydraulic force, a novel mechanism shown to aid diastolic filling, can be calculated by assessing the geometrical relationship between the left ventricular and atrial short-axis areas (atrioventricular area difference, AVAD) (Maksuti E, Carlsson M, Arheden H, Kovács SJ, Broomé M, Ugander M. Sci Rep 7: 43505-43510, 2017; Steding-Ehrenborg K, Hedström E, Carlsson M, Maksuti E, Broomé M, Ugander M, Magnusson M, Smith JG, Arheden H. J Appl Physiol (1985) 130: 993-1000, 2021). During exercise both ventricular and atrial volumes change due to altered loading conditions compared with rest, but it is unknown to what extent this affects AVAD. The aim of this study was to investigate whether AVAD differs when going from rest to exercise in sedentary controls and athletes. We included 13 sedentary controls and 20 endurance athletes to undergo cardiovascular magnetic resonance (CMR) imaging at rest and during moderate and vigorous exercise using a CMR-compatible ergometer. AVAD was calculated as the largest ventricular short-axis area minus the largest atrial short-axis area in end-diastole (ED) and end-systole (ES) as measured from CMR short-axis images. AVAD in ED increased during moderate exercise in both sedentary controls and athletes, thus aiding diastolic filling, but did not increase further during vigorous exercise. AVAD in ES was negative in both groups at rest and decreased further with increasing exercise intensity in sedentary controls, whereas athletes remained unchanged. In conclusion, results from AVAD in ED indicate the net hydraulic force to further augment diastolic filling during moderate exercise when compared with rest, providing new insights into the mechanism by which diastolic function increases during exercise.NEW & NOTEWORTHY This study is the first to assess hydraulic force during exercise, a novel mechanism shown to augment diastolic filling at rest. Our results indicate hydraulic force to further aid in diastolic filling during moderate exercise compared with rest in athletes and sedentary controls, providing new insights into the mechanism by which the left ventricle increases diastolic function during exercise.

Keywords: atrioventricular area difference; exercise cardiac magnetic resonance imaging; hydraulic force; left atrium; left ventricle.


Conflict of interest statement

Einar Heiberg is the founder of software company Medviso AB, which develops the software Segment that was used in the image analysis in the current study. None of the other authors has any conflicts of interest, financial or otherwise, to disclose.

Figures

None
Graphical abstract
Figure 1.
Figure 1.
Visualizations of net hydraulic force augmenting left ventricular diastolic filling in a healthy heart by applying force to the atrioventricular plane in the basal direction. A: stylized figures of the left atrium (LA, shaded in blue) and ventricle (LV, shaded in red), divided by the atrioventricular plane (dashed line) in end-systole, early diastole, and end-diastole. The blue-striped area represents the volume of blood which is filled by displacing the atrioventricular plane throughout diastole in the basal direction. B: a cardiovascular magnetic resonance two-chamber view of the left atrium (shaded in blue) and ventricle (shaded in red), separated by the atrioventricular plane (black line). Hydraulic force is exerted by the blood on the atrioventricular plane both from the atrium (blue arrows) and the ventricle (red arrows). The hydraulic force cancels out where the areas of the two chambers overlap (dashed red and blue arrows). The hydraulic force exerted where the chambers do not overlap (solid red arrows) can be divided into radial (dashed white arrow) and longitudinal (white arrow) components of the hydraulic force. The radial component is counteracted by the stiff pericardium, while the longitudinal component contributes to pushing the atrioventricular plane in the basal direction. Thus, the net hydraulic force will be in the basal direction, augmenting ventricular filling by displacing the atrioventricular plane. This visualization is simplified in (C), with a stylized two-chamber view and the two chambers represented as two cylinders. Here it becomes more apparent that a larger short-axis area leads to a larger hydraulic force, which is proportional to the difference in surface area between the two cylinders. This is the atrioventricular area difference.
Figure 2.
Figure 2.
Schematic overview visualizing the atrioventricular area difference (AVAD). The atrium and ventricle are represented as blue (atrium) and red (ventricle) cylinders stacked on top of each other. The atrioventricular area difference is calculated by taking the ventricular short-axis area and subtracting the atrial short-axis area. LA, left atrium; LV, left ventricle.
Figure 3.
Figure 3.
Atrioventricular area difference (AVAD) in ventricular end-diastole (A) and end-systole (B) at different exercise intensities. Endurance athletes are denoted as red triangles, sedentary controls as blue circles. Symbols and bars denote mean and standard deviation, respectively. *P < 0.05 within groups, #P < 0.05 between groups.
Figure 4.
Figure 4.
Left ventricular (LV) and left atrial (LA) maximum short-axis area measured in ventricular end-diastole (ED), shown in A and B, and in ventricular end-systole (ES), C and D, at different exercise intensities. Endurance athletes are denoted as red triangles, sedentary controls as blue circles. Symbols and bars denote mean and standard deviation, respectively. *P < 0.05 within groups.
Figure 5.
Figure 5.
Bland–Altman plots presenting the intra- (A and B) and interobserver (C and D) variability of measurements of atrioventricular area difference (AVAD) in ventricular end-diastole (ED; A and C) and end-systole (ES; B and D) in 10 randomly selected datasets. Black dots indicate measurements from rest, blue from moderate exercise, and red from vigorous exercise. The dotted line denotes the bias, and the dashed lines the upper and lower limits of agreement (1.96 standard deviations).

Similar articles

References

    1. Ekblom B, Hermansen L. Cardiac output in athletes. J Appl Physiol 25: 619–625, 1968. doi:10.1152/jappl.1968.25.5.619. - DOI - PubMed
    1. Schairer JR, Stein PD, Keteyian S, Fedel F, Ehrman J, Alam M, Henry JW, Shaw T. Left ventricular response to submaximal exercise in endurance-trained athletes and sedentary adults. Am J Cardiol 70: 930–933, 1992. doi:10.1016/0002-9149(92)90741-g. - DOI - PubMed
    1. Higginbotham MB, Morris KG, Williams RS, McHale PA, Coleman RE, Cobb FR. Regulation of stroke volume during submaximal and maximal upright exercise in normal man. Circ Res 58: 281–291, 1986. doi:10.1161/01.res.58.2.281. - DOI - PubMed
    1. La Gerche A, Claessen G, Van de Bruaene A, Pattyn N, Van Cleemput J, Gewillig M, Bogaert J, Dymarkowski S, Claus P, Heidbuchel H. Cardiac MRI: a new gold standard for ventricular volume quantification during high-intensity exercise. Circ Cardiovasc Imaging 6: 329–338, 2013. doi:10.1161/CIRCIMAGING.112.980037. - DOI - PubMed
    1. González-Alonso J. Point: Stroke volume does/does not decline during exercise at maximal effort in healthy individuals. J Appl Physiol (1985) 104: 275–276, 2008. doi:10.1152/japplphysiol.00595.2007. - DOI - PubMed