. 2025 Jan;21(1):254-275.
doi: 10.1007/s12015-024-10789-1. Epub 2024 Oct 17.

Influence of Microenvironmental Orchestration on Multicellular Lung Alveolar Organoid Development from Human Induced Pluripotent Stem Cells

Affiliations

Influence of Microenvironmental Orchestration on Multicellular Lung Alveolar Organoid Development from Human Induced Pluripotent Stem Cells

Vedat Burak Ozan et al. Stem Cell Rev Rep. 2025 Jan.

Abstract

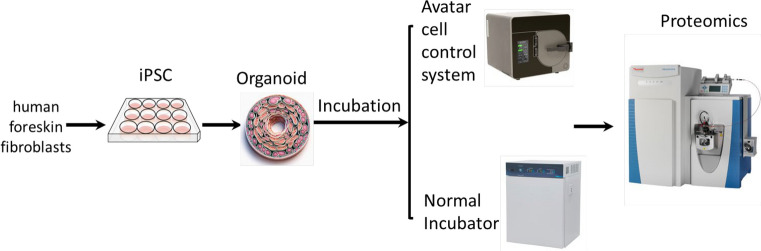
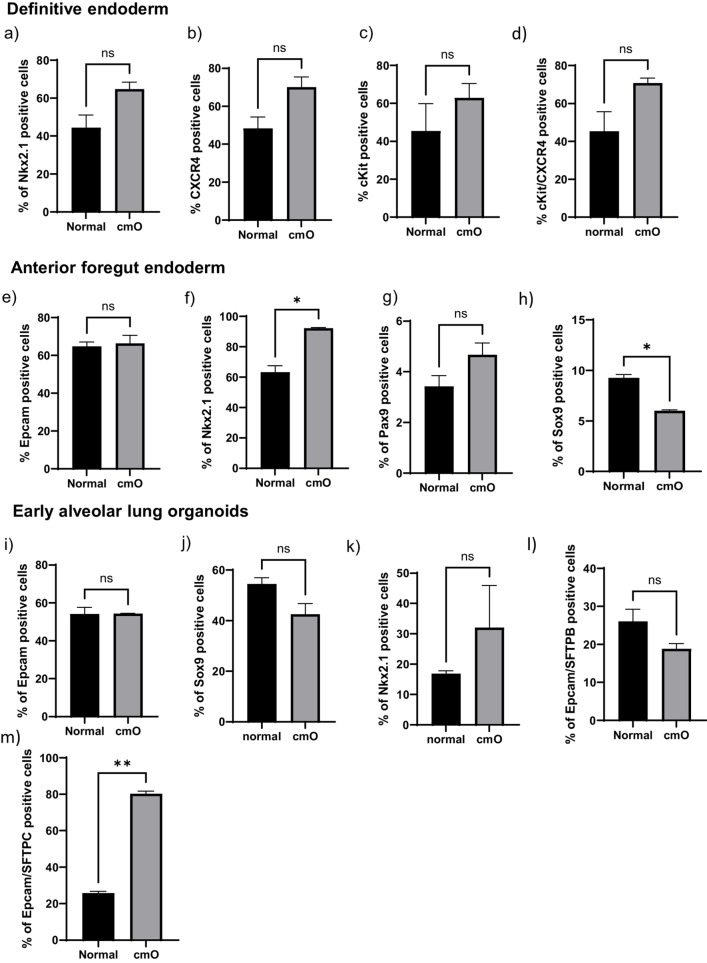
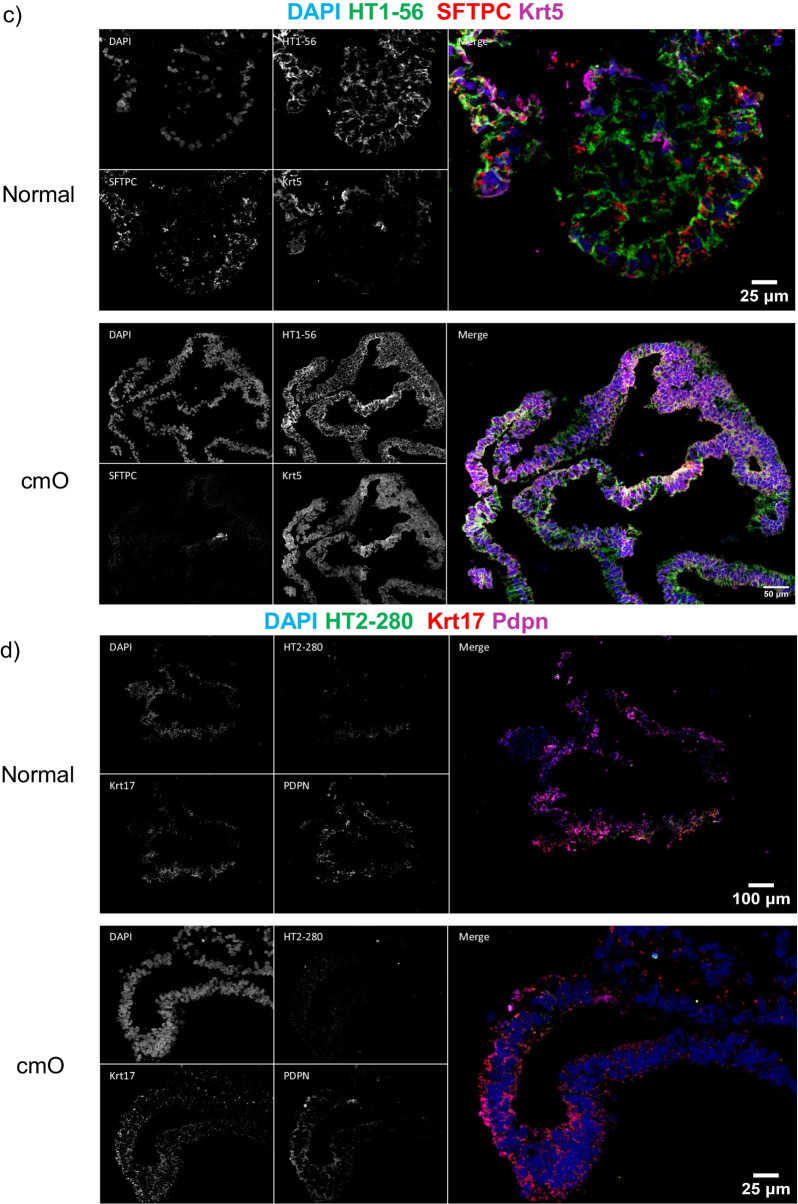
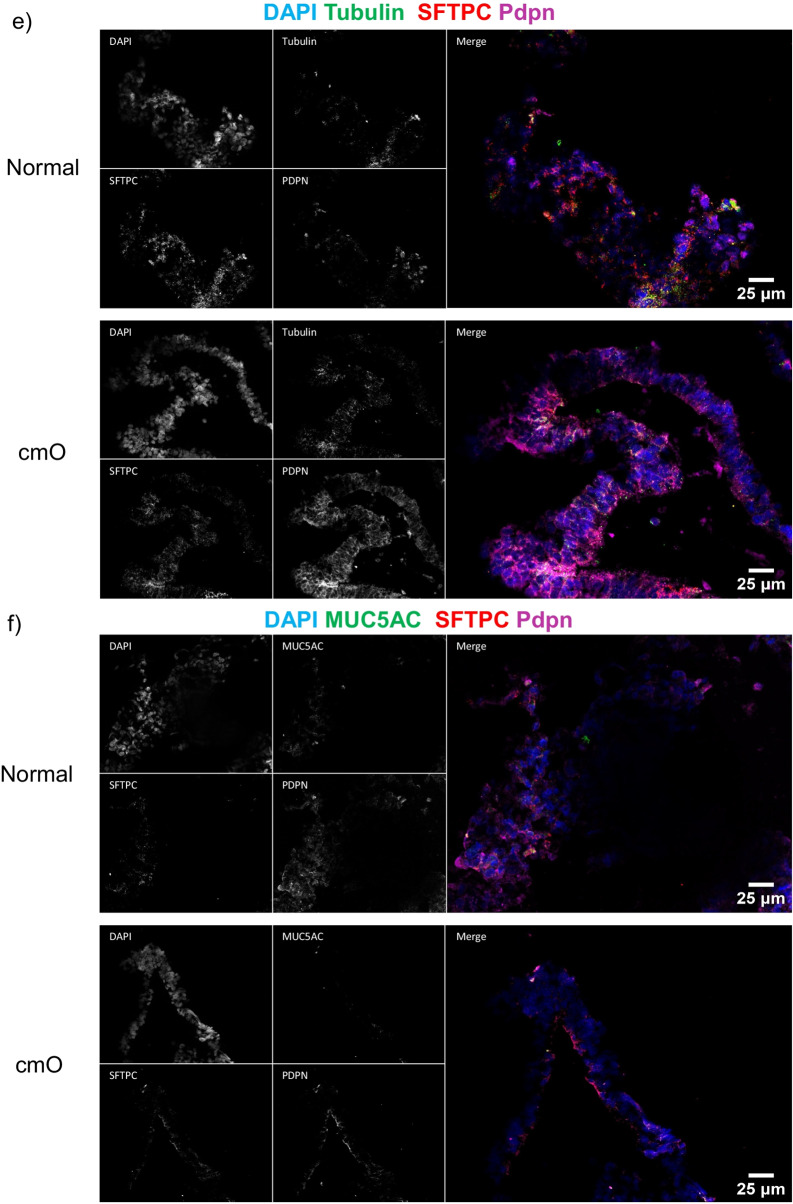
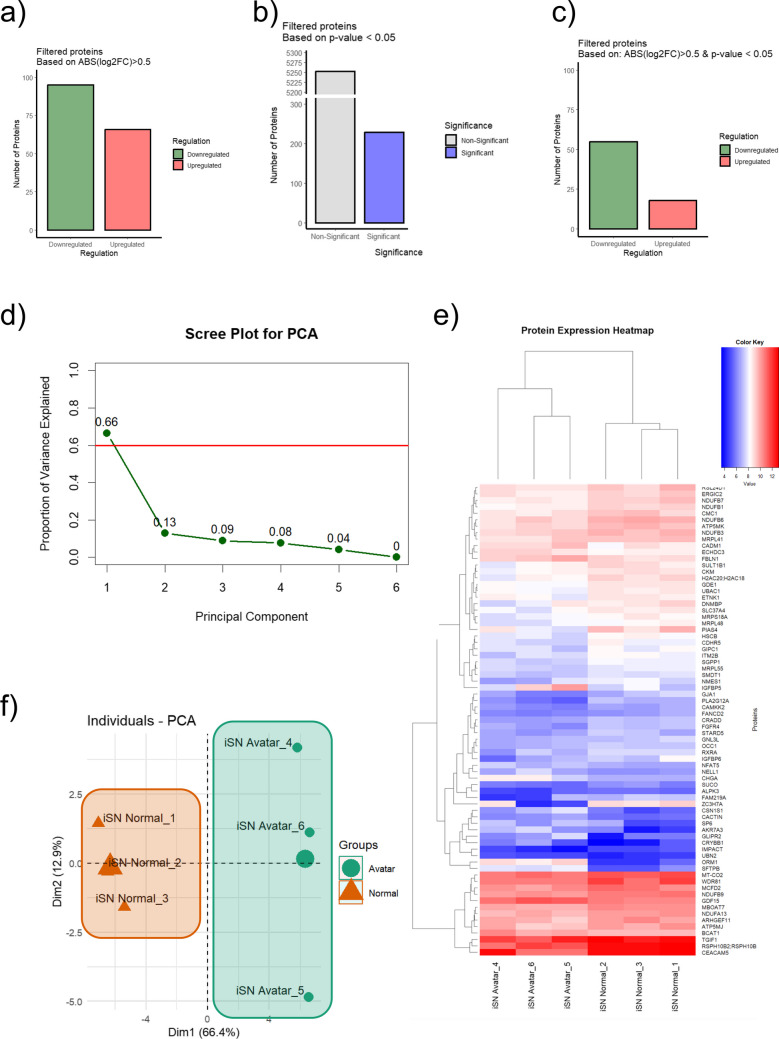
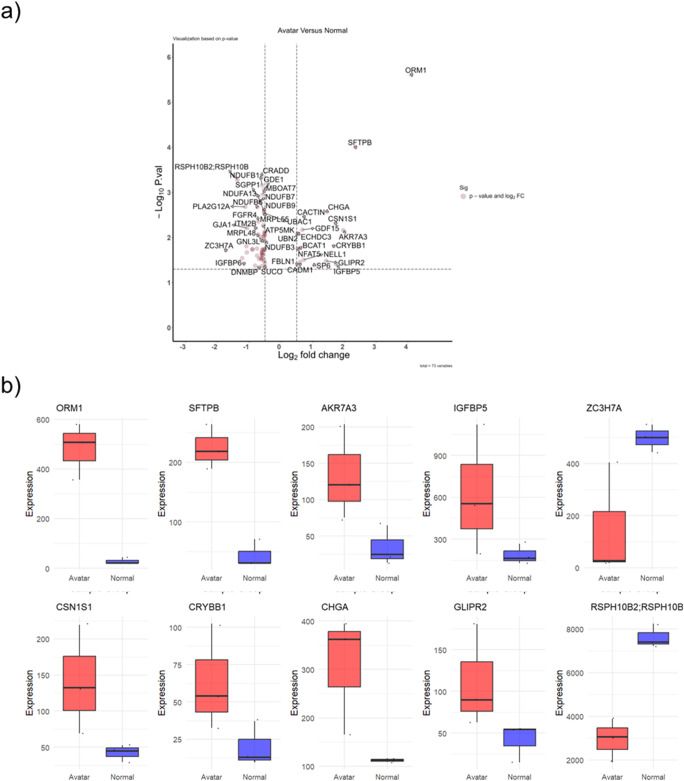
Induced pluripotent stem cells (iPSCs) have emerged as promising in vitro tools, providing a robust system for disease modelling and facilitating drug screening. Human iPSCs have been successfully differentiated into lung cells and three-dimensional lung spheroids or organoids. The lung is a multicellular complex organ that develops under the symphonic influence of the microenvironment. Here, we hypothesize that the generation of lung organoids in a controlled microenvironment (cmO) (oxygen and pressure) yields multicellular organoids with architectural complexity resembling the lung alveoli. iPSCs were differentiated into mature lung organoids following a stepwise protocol in an oxygen and pressure-controlled microenvironment. The organoids developed in the controlled microenvironment displayed complex alveolar architecture and stained for SFTPC, PDPN, and KRT5, indicating the presence of alveolar epithelial type II and type I cells, as well as basal cells. Moreover, gene and protein expression levels were also increased in the cmO. Furthermore, pathway analysis of proteomics revealed upregulation of lung development-specific pathways in the cmO compared to those growing in normal culture conditions. In summary, by using a controlled microenvironment, we established a complex multicellular lung organoid derived from iPSCs as a novel cellular model to study lung alveolar biology in both lung health and disease.

Keywords: 3D organoids; Induced pluripotent stem cells; Lung organoids; Lung proteomics; Multicellular lung organoid.


Conflict of interest statement

Declarations. Ethical Approval: Not applicable, no human or animal study performed. Consent to Participate: Not applicable. Consent to Publish: All authors agree to the publish the data. Conflict of Interest: The authors declare no conflict of interest.

Figures

Fig. 1
Fig. 1
Schematic of the project outline. The iPSCs were differentiated to mature lung organoids either in the normal incubator at 37ºC, 5% CO2 and atmospheric pressure or in a controlled microenvironment using the commercially available Avatar cell control system
Fig. 2
Fig. 2
Brightfield microscopy images of all the stages of differentiation in both conditions. iPSCs to definitive endoderm, anterior foregut endoderm, early floating organoids (Day 10 from the beginning of differentiation), early mature organoids (Day 25 from the beginning of differentiation), late mature organoids (Day 40 from the beginning of differentiation)
Fig. 3
Fig. 3
Flow cytometry analysis performed at different stages of the differentiation for definitive endoderm NKX2.1(a) CXCR4 (b). For anterior foregut endoderm, NKX2.1(c), EpCAM (d), PAX9 (e). To characterize early alveolar organoids NKX2.1 (f), EpCAM (g), SFTPB (h), SFTPC (i), double positive for SFTPB and SFTPC (j), SOX9 (k). For mature alveolar lung organoids NKX2.1 (l), EpCAM (m), SFTPB (n), SFTPC (o), double positive SFTPB and SFTPC (p), SOX9 (q). Relative mRNA expression of markers of alveolar epithelial type I and epithelial type II cells. The data is presented as fold change in cmO normalized to organoids growing in normal conditions. For mRNA expression four transwell inserts were used for each condition. For flow cytometery experiments, four transwell inserts were pooled for early lung organoids and mature lung organoids to obtained high cell number the experiments were repeated twice and the data is presented as mean ± SEM
Fig. 3
Fig. 3
Flow cytometry analysis performed at different stages of the differentiation for definitive endoderm NKX2.1(a) CXCR4 (b). For anterior foregut endoderm, NKX2.1(c), EpCAM (d), PAX9 (e). To characterize early alveolar organoids NKX2.1 (f), EpCAM (g), SFTPB (h), SFTPC (i), double positive for SFTPB and SFTPC (j), SOX9 (k). For mature alveolar lung organoids NKX2.1 (l), EpCAM (m), SFTPB (n), SFTPC (o), double positive SFTPB and SFTPC (p), SOX9 (q). Relative mRNA expression of markers of alveolar epithelial type I and epithelial type II cells. The data is presented as fold change in cmO normalized to organoids growing in normal conditions. For mRNA expression four transwell inserts were used for each condition. For flow cytometery experiments, four transwell inserts were pooled for early lung organoids and mature lung organoids to obtained high cell number the experiments were repeated twice and the data is presented as mean ± SEM
Fig. 4
Fig. 4
(a) Histological analysis of organoids was done, and haematoxylin and eosin (H&E) staining was performed. Immunofluorescence imaging was performed to stain the sections for various markers of alveolar epithelial cell markers and for markers of alveolar stem cells: (b) DAPI, E-cadherin, SPC and PDPN, (c) DAPI, HT1-56, SPC, KRT5, (d) DAPI, HT2-280, KRT17, PDPN, (e) DAPI, Tubulin, SPC, PDPN, (f) DAPI, MUC5AC, SPC, PDPN. The individual images of each staining are represented. Two transwell inserts were fixed for each condition and immunofluoroscence imaging was performed
Fig. 4
Fig. 4
(a) Histological analysis of organoids was done, and haematoxylin and eosin (H&E) staining was performed. Immunofluorescence imaging was performed to stain the sections for various markers of alveolar epithelial cell markers and for markers of alveolar stem cells: (b) DAPI, E-cadherin, SPC and PDPN, (c) DAPI, HT1-56, SPC, KRT5, (d) DAPI, HT2-280, KRT17, PDPN, (e) DAPI, Tubulin, SPC, PDPN, (f) DAPI, MUC5AC, SPC, PDPN. The individual images of each staining are represented. Two transwell inserts were fixed for each condition and immunofluoroscence imaging was performed
Fig. 5
Fig. 5
Electron microscopy images of normal and cmO organoids. Normal organoids showing microvilli and loose lamellar bodies, and cmO showing microvilli and well structured lamellar bodies. Two transwell inserts were fixed for each condition and electron microscopy was performed
Fig. 6
Fig. 6
(a) Bar graphs showing the number of proteins filtered based on absolute log2(fold change) > 0.5 with a delineation between downregulated and upregulated proteins. (b) Bar graphs representing proteins filtered based on p-value < 0.05. (c) Bar graphs representing proteins filtered based on both absolute log2(fold change) > 0.5 and p-value < 0.05, categorized by significance and regulation. The colour coding in the graphs serves to visually distinguish between downregulated (green), upregulated (red), non-significant (grey), and significant (blue) proteins, based on their expression changes and statistical relevance. (d) Scree plot illustrating the proportion of variance explained by each principal component in a PCA analysis. (e) Two-dimensional PCA plot of proteomic analysis results, contrasting organoids cultured in a controlled microenvironment (cmO) within an Avatar incubator (green) with those grown under standard culture conditions (orange), showcasing the principal component distribution for Dim1 and Dim2 which captures the most significant variation in the data. (f) Heatmap with hierarchical clustering showing the expression patterns of proteins across multiple samples, with a colour key indicating expression levels from low (blue) to high (red). Each row represents a unique protein, and each column corresponds to a sample. Hierarchical clustering using the Euclidean distance method has been applied to both rows and columns to group proteins and samples with similar expression patterns, respectively. Three transwell inserts were taken for proteomic analysis from each condition (n = 3)
Fig. 7
Fig. 7
Differential Protein Expression in Organoid Cultures from Avatar and Normal Incubators. (a) a volcano plot displaying the log2 fold change versus the negative log of the p-value for proteins analysed. Proteins with a statistically significant upregulation in the Avatar incubator are shown to the right and those with downregulation to the left, with the degree of significance indicated by the height on the y-axis. (b) Boxplots for the top differentially expressed proteins, with the red boxes representing protein expression levels in organoids cultured in the Avatar incubator and the blue boxes indicating expression levels in organoids from the normal incubator. The central line in each box represents the median expression level, the box boundaries indicate the interquartile range (IQR), and the whiskers extend to 1.5 times the IQR. Outliers are represented as individual points
Fig. 8
Fig. 8
Pathway and Functional Analysis of Proteomic Data from Organoid Cultures. (a) Pathway analysis generated using Ingenuity Pathway Analysis (IPA) tool, showcasing the enriched biological pathways from proteomic data of organoids incubated in different conditions. Pathways are ranked by the -log(p-value), with the threshold set at p < 0.05, indicating the likelihood of the pathway being affected by the incubation condition. The length of the bar represents the significance level, with blue bars indicating a predicted activation and orange bars indicating a predicted inhibition of the pathway. (b) Functional analysis highlighting diseases and biological functions associated with differential protein expression. Functions are ranked by the -log(p-value), with the threshold set at p < 0.05. the length of the bar is representing the significance of the association. (c) Network analysis focusing on the "Morphology of respiratory tract" function, with key genes identified in the dataset that are predicted to affect this function based on the direction of their expression changes. Red nodes represent genes with increased expression, while green nodes represent genes with lowered expression in the Avatar incubator group compared to the normal condition group. Arrows indicate the direction of the predicted effect on the "Morphology of respiratory tract"

References

    1. Altorki, N. K., et al. (2019). The lung microenvironment: An important regulator of tumour growth and metastasis. Nature Reviews Cancer,19(1), 9–31. - PMC - PubMed
    1. Schittny, J. C. (2017). Development of the lung. Cell and Tissue Research,367(3), 427–444. - PMC - PubMed
    1. Bain, C. C., & MacDonald, A. S. (2022). The impact of the lung environment on macrophage development, activation and function: Diversity in the face of adversity. Mucosal Immunology,15(2), 223–234. - PMC - PubMed
    1. Strunz, M., et al. (2020). Alveolar regeneration through a Krt8+ transitional stem cell state that persists in human lung fibrosis. Nature Communications,11(1), 3559. - PMC - PubMed
    1. Stamati, K., Mudera, V., & Cheema, U. (2011). Evolution of oxygen utilization in multicellular organisms and implications for cell signalling in tissue engineering. Journal of Tissue Engineering,2(1), 2041731411432365. - PMC - PubMed

MeSH terms