. 2024 Nov 4;221(11):e20220867.
doi: 10.1084/jem.20220867. Epub 2024 Oct 17.

The lifespan and kinetics of human dendritic cell subsets and their precursors in health and inflammation

Affiliations

The lifespan and kinetics of human dendritic cell subsets and their precursors in health and inflammation

Ruth Lubin et al. J Exp Med. .

Abstract

Dendritic cells (DC) are specialized mononuclear phagocytes that link innate and adaptive immunity. They comprise two principal subsets: plasmacytoid DC (pDC) and conventional DC (cDC). Understanding the generation, differentiation, and migration of cDC is critical for immune homeostasis. Through human in vivo deuterium-glucose labeling, we observed the rapid appearance of AXL+ Siglec6+ DC (ASDC) in the bloodstream. ASDC circulate for ∼2.16 days, while cDC1 and DC2 circulate for ∼1.32 and ∼2.20 days, respectively, upon release from the bone marrow. Interestingly, DC3, a cDC subset that shares several similarities with monocytes, exhibits a labeling profile closely resembling that of DC2. In a human in vivo model of cutaneous inflammation, ASDC were recruited to the inflammatory site, displaying a distinctive effector signature. Taken together, these results quantify the ephemeral circulating lifespan of human cDC and propose functions of cDC and their precursors that are rapidly recruited to sites of inflammation.


Conflict of interest statement

Disclosures: The authors declare no competing interests exist.

Figures

None
Graphical abstract
Figure S1.
Figure S1.
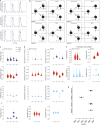
Characterization of human DC subsets. (a) Polychromatic flow cytometry gating strategy for blood DC subsets. Peripheral blood DC cells were identified as Lin HLA-DR+ cells. The DC subsets consist of pDC (CD123+ AXL: orange gated population) and ASDC (CD123+ CD5+ AXL+ Siglec6+; purple gated population). cDC could be identified as CD123 CD11c+ cells with cDC1 being CD141+ (red gated population), while cDC2 expressed CD1c+ FceR1a+ and was further divided into CD5+ DC2 and CD5 DC3 (Cossarizza et al., 2021; Dutertre et al., 2019). (b) Polychromatic flow cytometry gating strategy for blood DC subsets sometimes identified a distinct HLA-DR+ Lin CD45RA CD123+ population (red square). Histogram below shows this population stained positive for the basophil marker CD203c (black) or FMO (grey). (c) Flow cytometry analysis of human DC subsets in the bone marrow. (d) Pie chart depicting the percentage of each DC population in the bone marrow and blood. The table shows the mean total DC in the blood and bone marrow, cells/person, from eight individuals. (e) The approximate daily proliferation rate was estimated for each population. The proliferation rate was defined as p = (fraction_SG2M/SG2M_length) * 24 h. Combining 10,000 bootstrap samples of the S/G2/M measurments (only including non-zero measurements) with samples drawn from a Uniform distribution (U[5, 15 h]), the approximate proliferation rate of all subsets was calculated. The prior distribution of a subset’s proliferation rate was approximated by fitting a log-normal distribution to the bootstrap samples. The fitted parameters µ and σ, which are the mean and standard deviation of the samples’ natural logarithm, respectively, are shown.
Figure 1.
Figure 1.
Characterization of circulating human DC subsets. Peripheral blood DC subsets were analyzed by spectral flow cytometry. (a) UMAP of each DC subset defined in Fig. S1 a, illustrating several discriminating membrane markers that can be used to further identify each population for example Clec9a for cDC1 or CD33 for cDC populations. The flow cytometry analysis is representative of 15 healthy volunteers. (b) Representative cytospin images stained with methylene blue and eosin, scale bar 25 µm. (c and d) Quantification of DC subsets in healthy (c) peripheral blood and (d) bone marrow from eight individuals. (e) A representative plot illustrating DC subset analysis investigating DNA content and Ki67 expression as indicators of the cell cycle. The percentage of cells in G0, G1, or S G2 M phases of cell cycle in peripheral human blood or bone marrow from five individuals. (Error bars correspond to ± SEM.)
Figure 2.
Figure 2.
In vivo labeling and a mathematical approach of modeling human DC subset kinetics. (a) Protocol of in vivo labeling for the identification of newly divided cells. (1) Healthy volunteers received 20 g of deuterium-labeled glucose over 3 h. (2 and 3) DC subsets were subsequently sorted from whole blood over a 23-day (D) period; DNA was extracted to quantify the deuterium enrichment in each DC population by (4) GC-MS. (b) Fraction (F) of newly divided cells in peripheral blood ASDC, cDC1, DC2, and DC3 at time points following oral deuterium glucose in healthy volunteers; values were derived by dividing the DNA enrichment by the glucose deuterium area under the curve and expressed as %/day, shown as a mean ± SEM (n = 3–9 individuals per group). (c) Potential models examined for the calculation of circulating DC kinetics. Schematic depicts several plausible scenarios where ASDC develop into either DC2 and/or cDC1. P = proliferation, δ = death/disappearance, and λ = movement into the peripheral circulation. (d) The predictions of each model were summarized in terms of the mean (solid line) and the standard deviation (shaded area) by solving the respective model using samples from their posterior distribution. The fitted data (dots) are superimposed onto the posterior predictions. These data are representative of one study participant. (e) Lifespan times of ASDC, cDC1, and DC2 in both the bone marrow and blood across each model. (f) Cartoon depicting the most probable model and lifespan of each DC subset.
Figure S2.
Figure S2.
Modeling human cDC kinetics. (a) Deuterium-labeled glucose in the plasma of volunteers was measured before, during, and following the oral administration of 20 g deuterium-labeled glucose. (b) Potential models for circulating DC kinetics. The cartoon depicts four probable scenarios where ASDC develop into cDC1 and/or DC2. BM, bone marrow. (c–f) The parameters for (c) proliferation, (d) disappearance, (e) transition from ASDC, and (f) emigration for each model were quantified. (g) Model comparison. The out-of-sample predictiveness took the form of the elpd and their standard error was estimated via PSIS-LOO-CV for single data points for each model. Greater values indicate better relative predictive power of a model. Comparing the elpd values across models the elpd difference Δ elpd and the SD of the difference were calculated.
Figure 3.
Figure 3.
Model of DC3 developmental kinetics. (a) Potential models examined to calculate circulating DC3 kinetics. In model 1, DC3 in the bone marrow (BM) may proliferate (P), disappear (δ), or emigrate (λ) into the peripheral circulation. Model 2 is similar to model 1 yet adds a proliferating precursor (PpreDC3) before transitioning (ε) into a DC3 prior to their appearance in the blood. (b) Model comparison. The out-of-sample predictiveness taking the form of the elpd ± SD was estimated via PSIS-LOO-CV for single data points for each model. Greater values indicate better relative predictive power of a model, i.e., model 2 performed better than model 1 (note: higher elpd). Comparing the elpd values across models the difference Δ elpd was calculated. (c) Marginal posterior distributions of the proliferation rate, disappearance rate, average bone marrow dwell period, average lifespan in the blood, and transition rate were calculated assuming either model 1 or model 2. (d) Cartoon depicts the dwell period the bone marrow and peripheral blood lifespan of DC3 for the most likely model (model 2).
Figure 4.
Figure 4.
DC infiltration into the experimental human E. coli skin blister. (a) Protocol of the human experimental skin blister model. This model examines the function and kinetics of DC populations in response to an inflammatory insult in healthy individuals. A skin blister was formed 24 or 48 h following an intradermal injection of 1.5 × 10⁷ UV-killed E. coli into the forearm, triggering an acute inflammatory response. The infiltrating cells were isolated and analyzed as described. (b) Vascular response at the injection site was assessed by laser Doppler imager capturing flux images. Representative flux images at baseline, 24, and 48 h are shown, representative of n = 12. (c) Skin biopsies taken 24 h following E. coli injection revealed significant leucocyte infiltration compared to control samples, scale bar 100 µm. (d) Representative flow cytometry analysis of DC infiltrate following negative pressure blisters formed over the injection site at 24 h (n = 3–6 blisters). DC subsets present were identified as pDC (orange), ASDC (purple), cDC1 (red), DC2 (sky blue), and DC3 (navy). (e) Blister infiltration at 24 and 48 h following UV-killed E. coli injection; data expressed as a ratio blister to blood (cells/ml); n = 3–6 independent experiments per time point. (f) Expression of co-stimulatory molecule CD80 in blood and infiltrating cDC subsets measure by flow cytometry expressed as geometric mean fluorescence intensity (gMFI), color scheme as above (n = 3 independent experiments).
Figure 5.
Figure 5.
ASDC adopt a distinct signature at the site of inflammation. (a) Infiltrating blister cells 24 h following an intradermal injection of 1.5 × 10⁷ UV-killed E. coli into the forearm were index-sorted and analyzed by scRNA-seq (Smart-seq2) from three volunteers. These data were integrated with published scRNA-seq data from blood DC (Dutertre et al., 2019; Villani et al., 2017) using Seurat V4 pipeline. UMAP of integrated data annotated by phenograph clusters were identified as DC subsets as defined from DEG analysis. (b) DEG analysis of phenograph clusters. (c) The mean gene expression signature of early ASDC, as defined by See et al. (2017), was analyzed on both blood and blister ASDC. ****P < 0.0001 Mann-Whitney test. (d) Volcano plot showing DEGs between blood and blister ASDC. Data shown −Log (P value) against Log2 fold change. (e) Protein expression differences between blood and blister ASDC at both 24 and 48 h after challenge; n = 3 blister per time point. (f) Ingenuity Pathway Analysis (IPA) demonstrating the enriched pathways associated with blood and blister ASDC. (g) Analysis of various HLA molecules on ASDC following the incubation with either recombinant IFNβ or vehicle for 20 h and subsequently examined by flow cytometry (n = 6 independent experiments performed in triplicate). *P < 0.05 paired t test. (h) Mixed leucocyte reaction (MLR) performed with sorted human cDC1, cDC2, ASDC, and pDC incubated with CFSE-labeled naïve T cells for 6 days. Prior to the addition of T cells, DC were incubated with either vehicle or IFNβ. (i) CD4+ T cells were analyzed for their proliferation capacity as a function of their CFSE labeling loss. (ii) CD4+ T cells were examined for their intracellular IL-10 expression following MLR. n = 5–8 independent experiments, each performed in triplicate. *P < 0.05, **P < 0.01, and ****P < 0.0001, paired t test.
Figure S3.
Figure S3.
Functional analysis of infiltrating ASDC. (a) Infiltrating blister cells 24 h following an intradermal injection of 1.5 × 10⁷ UV-killed E. coli into the forearm were index-sorted and analyzed by scRNAseq (Smart-seq2) from three individuals. scRNA-seq and protein expression data for each DC subset, using markers defined from FACS-indexed data from blister DC samples. These data was then integrated with blood DC data from Villani et al. and Dutertre et al. using the Seurat V3 pipeline (Dutertre et al., 2019; See et al., 2017; Villani et al., 2017). (b) Protein expression from FACS-indexed data of blister DC within the integrated UMAP space. (c) Representative flow cytometry histogram examining the effect of IFNβ on HLA expression on ASDC. (d–f) The expression of HLA-DR, -DP, or -DQ molecules was examined by flow cytometry following the incubation with either recombinant IFNβ or vehicle for 20 h on (d) cDC1, (e) DC2, and (f) DC3 subsets (n = 3–6 independent experiments performed in triplicate). (g and h) The expression of IFNAR1 or IFNAR2 was assessed in resting blood cDC populations using scRNA-seq and (h) flow cytometry (four individuals performed in triplicate). A representative flow cytometry histogram shows receptor expression (grey FMO). (i) Purified ASDC were either incubated with vehicle or IFNβ and then cultured with allogenic CFSE stained naïve T cells. Left: top, T cells alone, bottom with ASDC. Right: IL-10 expression on T cells after 7 days; grey FMO, dark purple with ASDC and vehicle pre-incubation, light purple ASDC with IFNβ pre-incubation.

References

    1. Auffermann-Gretzinger, S., Eger L., Bornhäuser M., Schäkel K., Oelschlaegel U., Schaich M., Illmer T., Thiede C., and Ehninger G.. 2006. Fast appearance of donor dendritic cells in human skin: Dynamics of skin and blood dendritic cells after allogeneic hematopoietic cell transplantation. Transplantation. 81:866–873. 10.1097/01.tp.0000203318.16224.57 - DOI - PubMed
    1. Bachem, A., Güttler S., Hartung E., Ebstein F., Schaefer M., Tannert A., Salama A., Movassaghi K., Opitz C., Mages H.W., et al. . 2010. Superior antigen cross-presentation and XCR1 expression define human CD11c+CD141+ cells as homologues of mouse CD8+ dendritic cells. J. Exp. Med. 207:1273–1281. 10.1084/jem.20100348 - DOI - PMC - PubMed
    1. Barna, B.P., Chou S.M., Jacobs B., Yen-Lieberman B., and Ransohoff R.M.. 1989. Interferon-beta impairs induction of HLA-DR antigen expression in cultured adult human astrocytes. J. Neuroimmunol. 23:45–53. 10.1016/0165-5728(89)90072-6 - DOI - PubMed
    1. Binnewies, M., Mujal A.M., Pollack J.L., Combes A.J., Hardison E.A., Barry K.C., Tsui J., Ruhland M.K., Kersten K., Abushawish M.A., et al. . 2019. Unleashing type-2 dendritic cells to drive protective antitumor CD4+ T cell immunity. Cell. 177:556–571.e16. 10.1016/j.cell.2019.02.005 - DOI - PMC - PubMed
    1. Bosteels, C., Neyt K., Vanheerswynghels M., van Helden M.J., Sichien D., Debeuf N., De Prijck S., Bosteels V., Vandamme N., Martens L., et al. . 2020. Inflammatory type 2 cDCs acquire features of cDC1s and macrophages to orchestrate immunity to respiratory virus infection. Immunity. 52:1039–1056.e9. 10.1016/j.immuni.2020.04.005 - DOI - PMC - PubMed

Substances