. 2024 Dec 6;9(23):e171705.
doi: 10.1172/jci.insight.171705.

DAB2IP loss in luminal a breast cancer leads to NF-κB-associated aggressive oncogenic phenotypes

Affiliations

DAB2IP loss in luminal a breast cancer leads to NF-κB-associated aggressive oncogenic phenotypes

Angana Mukherjee et al. JCI Insight. .

Abstract

Despite proven therapy options for estrogen receptor-positive (ER+) breast tumors, a substantial number of patients with ER+ breast cancer exhibit relapse with associated metastasis. Loss of expression of RasGAPs leads to poor outcomes in several cancers, including breast cancer. Mining the The Cancer Genome Atlas (TCGA) breast cancer RNA-Seq dataset revealed that low expression of the RasGAP DAB2IP was associated with a significant decrease in relapse-free survival in patients with Luminal A breast cancer. Immunostaining demonstrated that DAB2IP loss occurred in grade 2 tumors and higher. Consistent with this, genes upregulated in DAB2IP-low Luminal A tumors were shared with more aggressive tumor subtypes and were associated with proliferation, metastasis, and altered ER signaling. Low DAB2IP expression in ER+ breast cancer cells was associated with increased proliferation, enhanced stemness phenotypes, and activation of IKK, the upstream regulator of the transcription factor NF-κB. Integrating cell-based ChIP-Seq with motif analysis and TCGA RNA-Seq data, we identified a set of candidate NF-κB target genes upregulated with loss of DAB2IP linked with several oncogenic phenotypes, including altered RNA processing. This study provides insight into mechanisms associated with aggressiveness and recurrence within a subset of the typically less aggressive Luminal A breast cancer intrinsic subtype.

Keywords: Breast cancer; NF-kappaB; Oncology; Tumor suppressors.


Figures
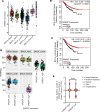
Figure 1
Figure 1. Low DAB2IP expression in Luminal A breast cancer subtype is associated with poorer survival.
(A) TCGA-breast cancer RNA-Seq data (n = 1,082) was retrieved from cBioPortal, and tumors were divided into quartiles based on DAB2IP expression. Shaded numbers (nos. 1–4) indicate the quartiles, 1 being the lowest 25% (DAB2IP-low) and 4 the highest 25% (DAB2IP-high). (B and C) Relapse-free survival curves for patients with ER+ breast cancer and patients with Luminal A breast cancer based on DAB2IP expression were plotted using the Kaplan-Meier Plotter website. DAB2IP-225020_at probe was used to generate the curves (ER+: n = 877; Luminal A: n = 952). (D) The PAM50 based ROR-P score between high and low DAB2IP was determined for each breast cancer subtype (Luminal A: P = 3.064 × 10⁻¹⁰). (E) Copy number alterations ranging from –2 to 2 were plotted based on DAB2IP-high/low status in Luminal A TCGA breast cancer cohort (****P < 0.0001). Data were analyzed using unpaired Student’s t test.
Figure 2
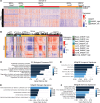
Figure 2. Gene expression profiling based on DAB2IP status revealed distinct clusters of differentially expressed genes in Luminal A subtype.
(A) DESeq analysis of TCGA Luminal A breast cancer RNA-Seq data was performed using quartile-based cutoffs to divide patients into high/low DAB2IP groups. The expression map shows differentially expressed genes (DEGs) between DAB2IP high/low Luminal A subtype, clustered across all breast cancer subtypes (Padj < 1 × 10⁻⁵). (B) Pearson correlation expression map showing positive correlation between Luminal A DAB2IP-low group, HER2 (high and low), and Luminal B (high and low) subtypes. (C and D) DEGs upregulated with low DAB2IP in Luminal A tumors were subjected to gene enrichment analysis using GO biological processes and oncogenic pathway activation gene sets (FDR > 0.05). (E and F) Upregulated DEGs in DAB2IP-low Luminal A tumors were subjected to enrichment analysis using MSigDB-curated gene sets to show the overlap with ESSRA targets, estradiol-associated gene sets, gene sets associated with endocrine therapy resistance, and stemness (FDR > 0.05). Gene expression associations with DAB2IP class were analyzed using unpaired Student’s t test.
Figure 3
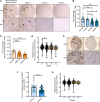
Figure 3. DAB2IP expression decreases with increasing tumor grade and stage in human ER+ and Luminal A–only breast cancer specimens.
(A) Representative images show DAB2IP expression from IHC studies of 116 ER+ breast cancer specimens. Arrows indicate positive cells. Magnification, 10× (top), 20× (bottom). (B and C) Staining intensity of DAB2IP expression per specimen was quantified computationally and plotted by tumor grades and stage, respectively (grade 1 vs. grade 2, *P = 0.0222; grade 1 vs. grade 3, *P = 0.0259; normal vs. grade 2 and normal vs. grade 3, ****P < 0.0001; normal vs. stage II and normal vs. stage III, ****P < 0.0001). (D) DAB2IP expression in TCGA ER+ luminal patients was graphed according to the respective tumor stage (T1–T4) (**P = 0.0035). (E) Representative images show DAB2IP expression of 126 Luminal A breast cancer tissues with arrows indicating positively stained cells. Magnification, 10× (top), 20× (bottom). (F) DAB2IP expression intensity in Luminal A tumors quantified per specimen was graphed by tumor grades (****P < 0.0001). (G) DAB2IP expression in TCGA patients with Luminal A breast cancer was plotted according to the respective tumor stage. Data were analyzed using unpaired Student’s t test, and multiple comparisons were corrected with Dunnett’s test.
Figure 4
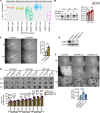
Figure 4. Loss of DAB2IP increases proliferation, migration, tumorspheroid, and tumorsphere formation in Luminal A cells.
(A) Proliferation score distribution based on an 11-gene signature was analyzed across breast cancer subtypes by DAB2IP levels (Luminal A: P = 1.555 × 10⁻¹¹). (B) Proliferation rate of T47D cells transfected with siRNA specific to DAB2IP or nontargeting control pool was examined using MTS assay (**P = 0.0025, *P = 0.0133) (n = 9). (C) After 24-hour transfection, a scratch-wound assay was performed on T47D cells (*P = 0.0391) (n = 4). (D) T47D cells were transduced with control shRNA or 2 different clones of DAB2IP-trageting shRNAs, and knockdown efficiency was determined by Western blot. (E) In total, 1,000; 2,000; and 4,000 shDAB2IP and shControl T47D cells were seeded for tumorspheroid assay, with images captured on days 2, 4, and 7 (*P = 0.041, ****P < 0.0001) (n = 3 and 4 measurements were taken per spheroid). (F) shDAB2IP and shControl T47D cells were plated for tumorsphere assays, with images taken on days 1, 4, and 7. Tumorsphere quantification was performed on day 7 (**P = 0.0024) (n = 3, and each replicate was seeded in 2 wells). Data were analyzed using unpaired Student’s t test, and multiple comparisons were corrected using Dunnett’s test. Magnification, 40×.
Figure 5
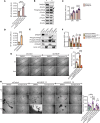
Figure 5. DAB2IP loss activates the IKK/NF-κB signaling pathway in Luminal A breast cancer cells.
(A) After transfection with DAB2IP or control siRNA, MCF10A cells were transfected with WT or mutant 3×κB luciferase reporter plasmids and pRL-TK Renilla plasmid. Cell incubation for 24 hours was followed by dual luciferase assay (****P < 0.0001) (n = 4). (B) Immunoblot showed increased phospho-IKKαβ expression (arrow) in siDAB2IP MCF10A cells (n = 3). (C) After transfection, siDAB2IP and siControl MCF10A cell proliferation was determined by MTS assay (****P < 0.0001) (n = 9). (D) shDAB2IP and shControl T47D cells were transfected with WT or mutant 3×κB luciferase reporter constructs and pRL-TK Renilla construct for dual luciferase assay (***P = 0.0001) (n = 4). (E) Cytoplasmic and nuclear extracts from siDAB2IP and siControl T47D cells were used for immunoblotting to show an increase in the cytoplasmic phospho-IKKαβ levels (arrows) in siDAB2IP cells (n = 3). (F) Transfected T47D cells were treated with 5 μM compound A or DMSO every 8 hours, followed by MTS assay at 24 and 48 hours to assess proliferation (*P = 0.0282, **P = 0.0034, ***P = 0.0005) (n = 3). (G) After treatment with 5 μM compound A or DMSO, siDAB2IP and siControl T47D cells were subjected to scratch-wound assays (**P = 0.008, ***P = 0.0002, ****P < 0.0001) (n = 3). (H) shDAB2IP and shControl T47D cells were treated with 5 μM compound A or DMSO for tumorsphere assay, with images taken on days 1, 4, and 7 (**P = 0.004, **P = 0.0063, **P = 0.0018 ****P < 0.0001) (n = 3, seeded in 3 wells per replicate). Unpaired Student’s t test and multiple comparisons corrected with Dunnett’s test were used to analyze the data. Magnification, 40×.
Figure 6
Figure 6. Effect of low DAB2IP on NF-κB target genes in Luminal A breast tumors.
(A) Publicly available breast cancer RelA ChIP-Seq dataset was mined and analyzed to map putative NF-κB target genes based on high/low DAB2IP in the TCGA Luminal A subtype. (B) Heatmap displays 16 KEGG “spliceosome” pathway genes in Luminal A subtype based on DAB2IP levels, clustered across all breast cancer subtypes. (C) Neojunctions from TCGA breast cancer data were graphed based on high/low DAB2IP expression in Luminal A tumors (P = 4.21 × 10⁻⁵). (D and E) T47D cells transfected with siRNA against SRSF1, DAB2IP, or control were analyzed by immunoblotting and MTS assay. (24hrs: siControl vs siSRSF1, **P = 0.0033; siDAB2IP vs. siDAB2IP+siSRSF1, **P = 0.0014; siSRSF1 vs siDAB2IP+siSRSF1, **P = 0.0025; siControl vs siDAB2IP, ***P = 0.0008; siDAB2IP vs siSRSF1, ****P < 0.0001; 48hrs: siControl vs siSRSF, *P = 0.0112; siSRSF1 vs siDAB2IP+siSRSF1, **P = 0.0069; siDAB2IP vs siSRSF1, ****P < 0.0001) (n = 9). (F) After 24 hours of transfection, siControl, siDAB2IP, and/or siSRSF1 T47D cells were subjected to scratch-wound assay in 6-well plates (*P = 0.0144, ***P = 0.0001, ***P = 0.0004, ****P < 0.0001) (n = 4). Data were analyzed using unpaired Student’s t test, and multiple comparisons were corrected using Dunnett’s test.
Figure 7
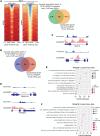
Figure 7. The effect of low DAB2IP on the genomic binding of
NF-κB subunits. (A) Profile heatmaps around ± 1 kb of RefSeq gene TSS were created, displaying peak count levels with a color gradient (blue-to-red: high-to-low). The Venn diagram shows the overlap between up-peak RELA binding genes in shDAB2IP T47D cells and upregulated genes in the DAB2IP-low Luminal A TCGA dataset. (B) Venn diagram shows the overlap of up-peak RELB genes in shDAB2IP T47D cells and upregulated genes in the Luminal A DAB2IP-low TCGA group. (C and D) ChIP-Seq signal tracks were generated for NOP10, TPI1, TMEM147, and PSENEN using Integrated Genome Viewer software. (E and F) Common genes between TCGA RNA-Seq and RelA/RelB ChIP-Seq were processed for enrichment analysis using curated MSigDB gene sets (FDR > 0.05).

References

    1. Trimboli RM, et al. Do we still need breast cancer screening in the era of targeted therapies and precision medicine? Insights Imaging. 2020;11(1):105. doi: 10.1186/s13244-020-00905-3. - DOI - PMC - PubMed
    1. Siegel RL, et al. Cancer statistics, 2022. CA Cancer J Clin. 2022;72(1):7–33. doi: 10.3322/caac.21708. - DOI - PubMed
    1. Siegel RL, et al. Cancer statistics, 2024. CA Cancer J Clin. 2024;74(1):12–49. doi: 10.3322/caac.21820. - DOI - PubMed
    1. Prat A, et al. Response and survival of breast cancer intrinsic subtypes following multi-agent neoadjuvant chemotherapy. BMC Med. 2015;13(1):303. doi: 10.1186/s12916-015-0540-z. - DOI - PMC - PubMed
    1. Prat A, Perou CM. Deconstructing the molecular portraits of breast cancer. Mol Oncol. 2011;5(1):5–23. doi: 10.1016/j.molonc.2010.11.003. - DOI - PMC - PubMed