. 2024 Dec 6;9(23):e184396.
doi: 10.1172/jci.insight.184396.

Knockdown of ketohexokinase versus inhibition of its kinase activity exert divergent effects on fructose metabolism

Affiliations

Knockdown of ketohexokinase versus inhibition of its kinase activity exert divergent effects on fructose metabolism

Se-Hyung Park et al. JCI Insight. .

Abstract

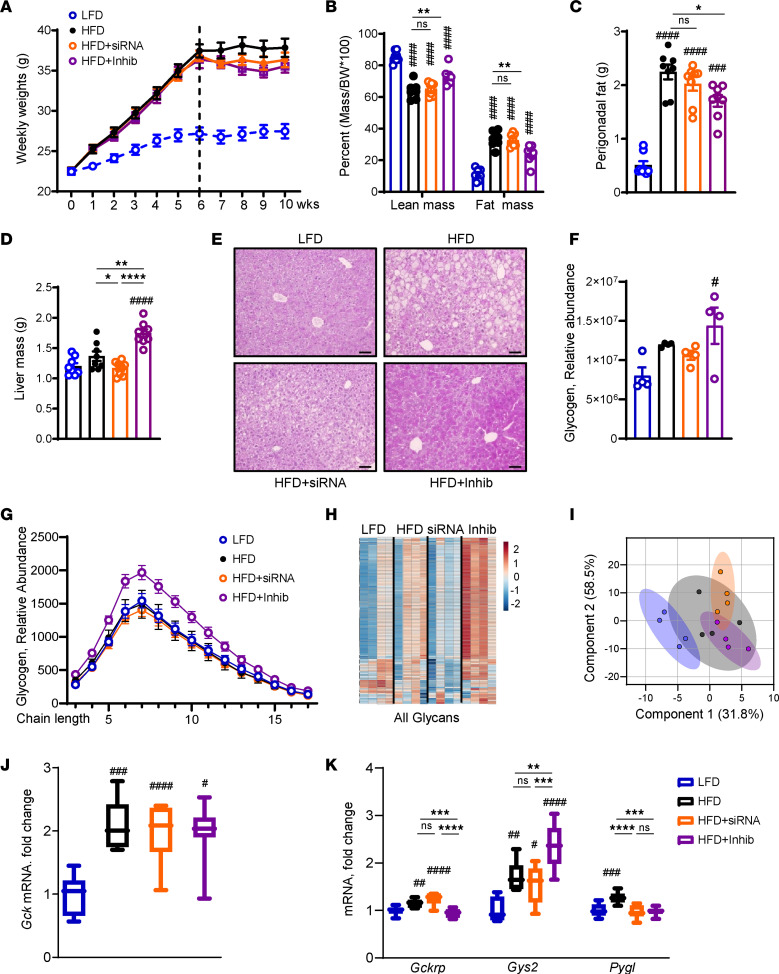
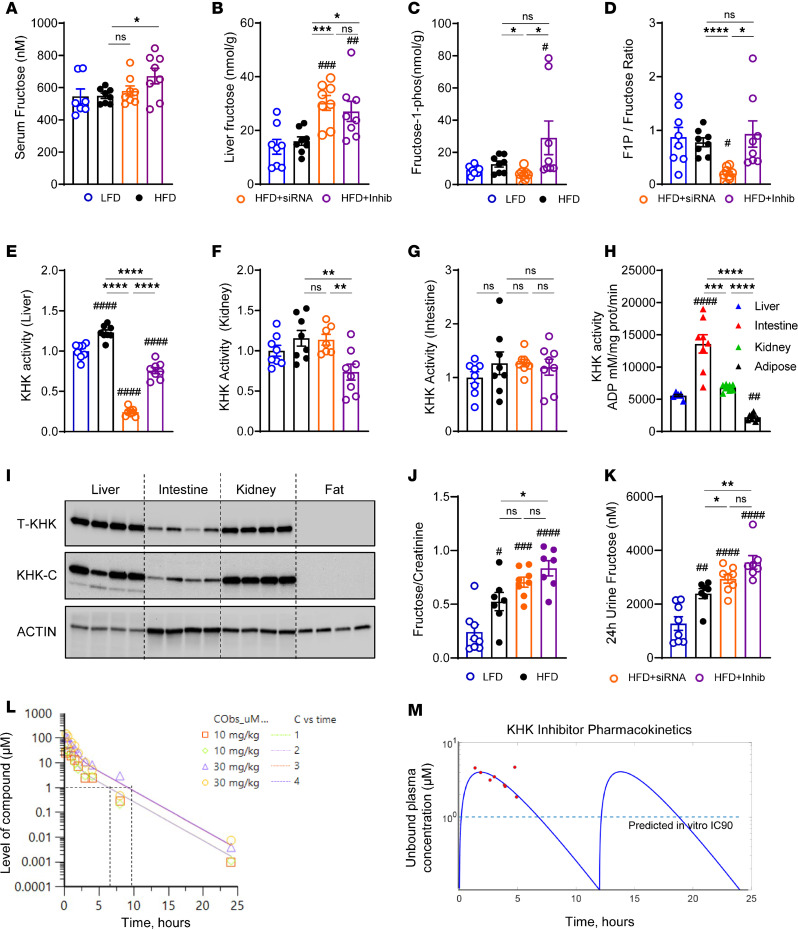
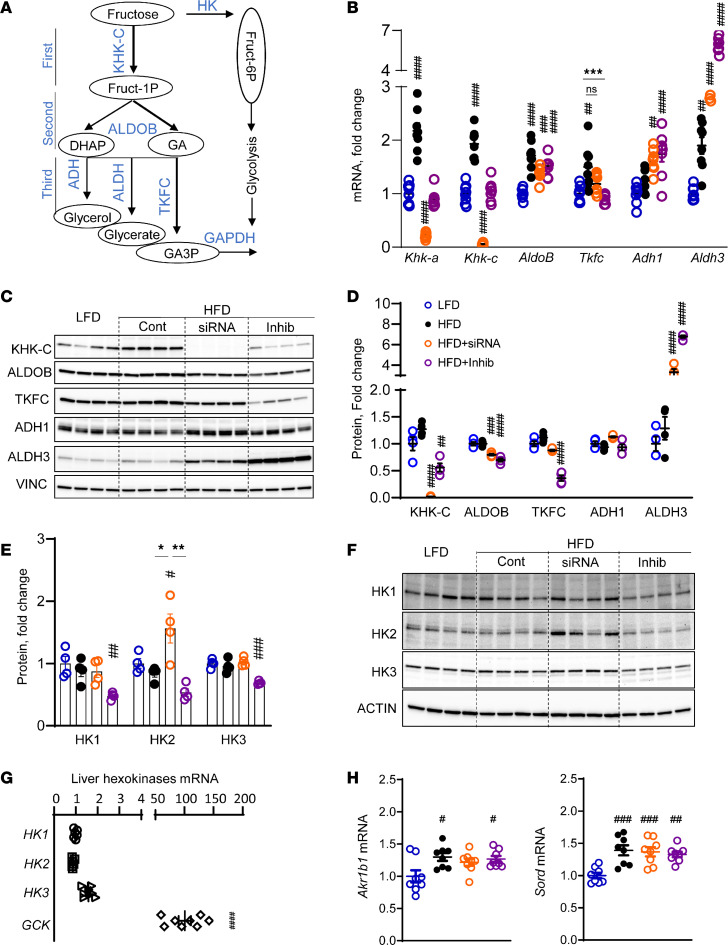
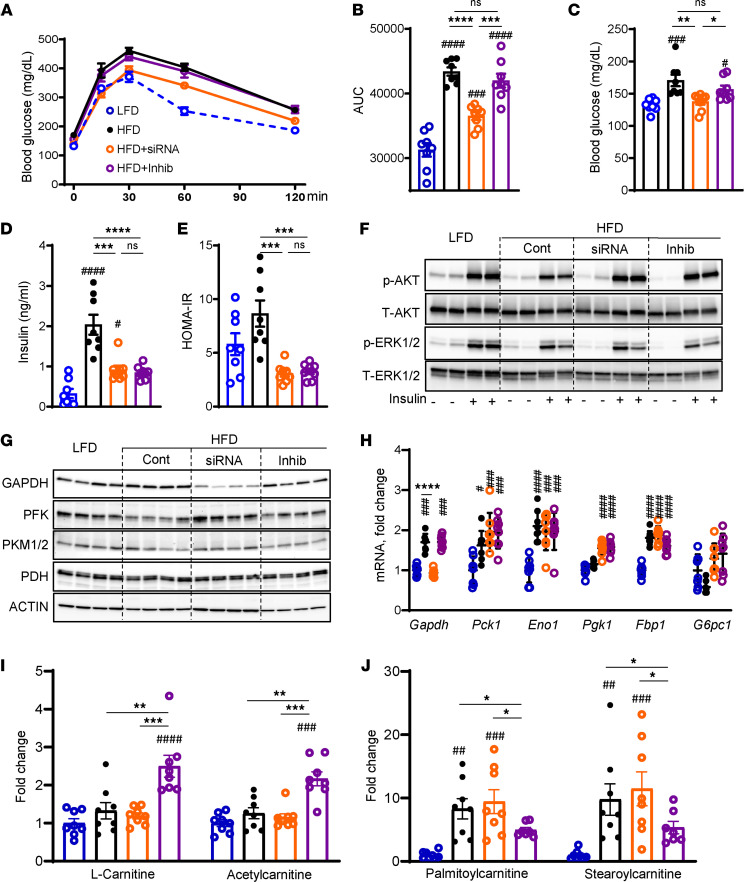
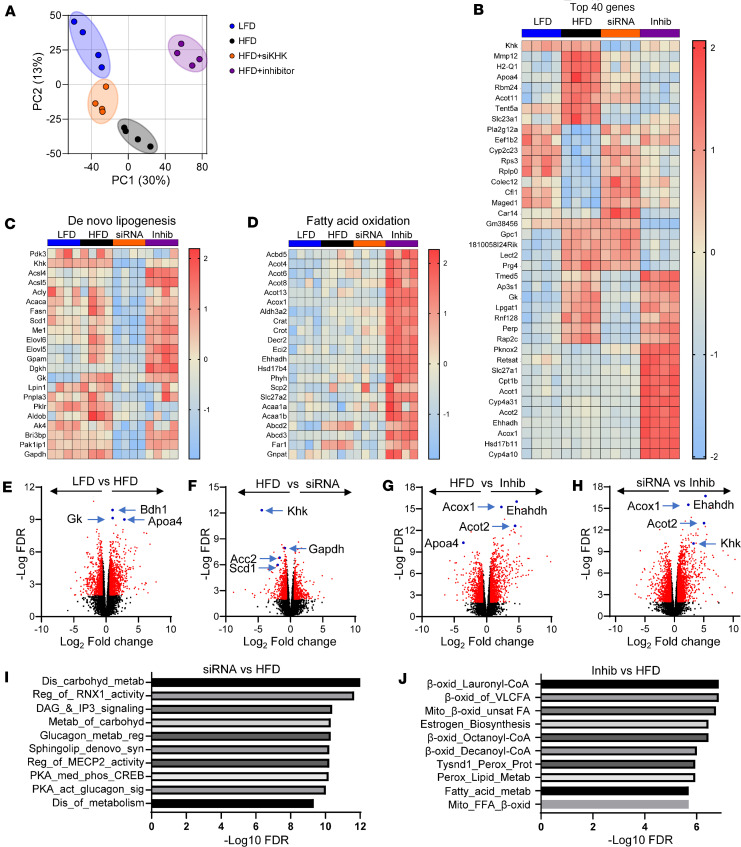
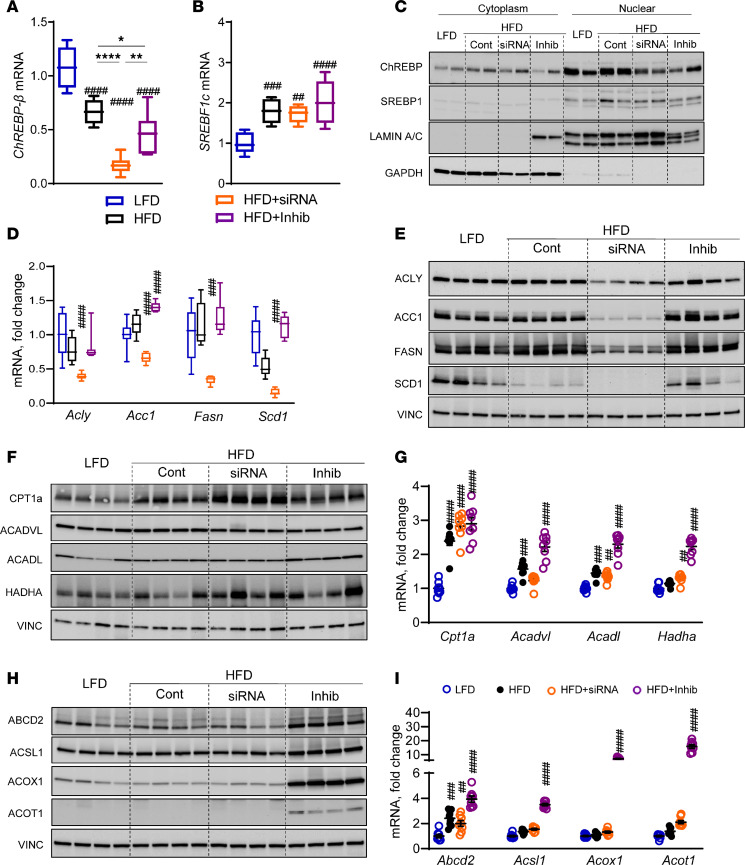
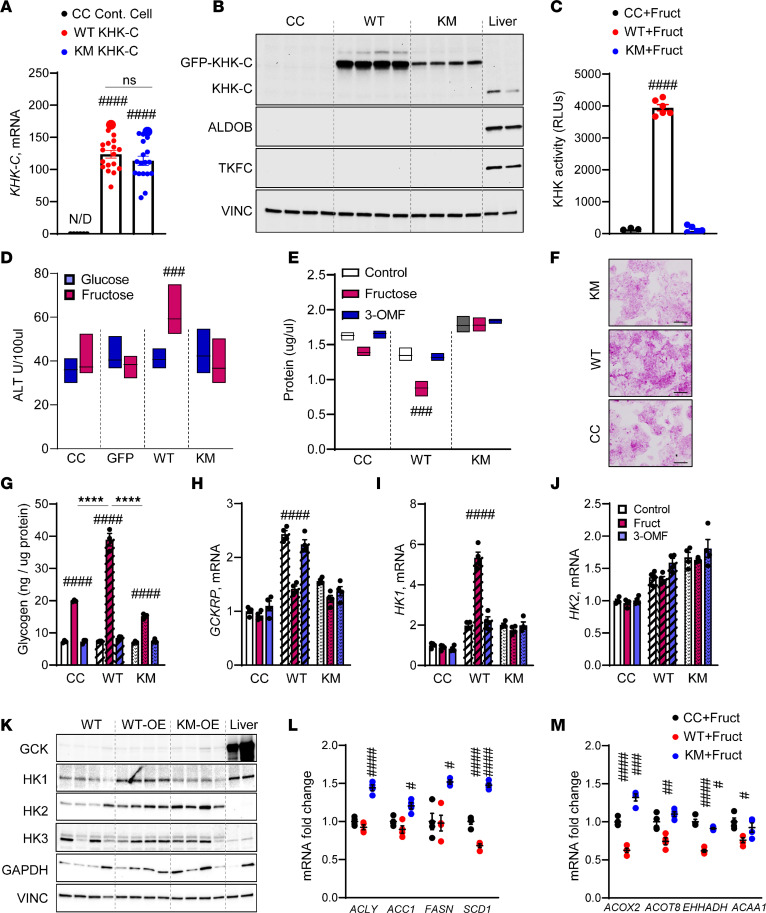
Excessive fructose intake is a risk factor for the development of obesity and its complications. Targeting ketohexokinase (KHK), the first enzyme of fructose metabolism, has been investigated for the management of metabolic dysfunction-associated steatotic liver disease (MASLD). We compared the effects of systemic, small molecule inhibitor of KHK enzymatic activity with hepatocyte-specific, N-acetylgalactosamine siRNA-mediated knockdown of KHK in mice on an HFD. We measured KHK enzymatic activity, extensively quantified glycogen accumulation, performed RNA-Seq analysis, and enumerated hepatic metabolites using mass spectrometry. Both KHK siRNA and KHK inhibitor led to an improvement in liver steatosis; however, via substantially different mechanisms, KHK knockdown decreased the de novo lipogenesis pathway, whereas the inhibitor increased the fatty acid oxidation pathway. Moreover, KHK knockdown completely prevented hepatic fructolysis and improved glucose tolerance. Conversely, the KHK inhibitor only partially reduced fructolysis, but it also targeted triokinase, mediating the third step of fructolysis. This led to the accumulation of fructose-1 phosphate, resulting in glycogen accumulation, hepatomegaly, and impaired glucose tolerance. Overexpression of wild-type, but not kinase-dead, KHK in cultured hepatocytes increased hepatocyte injury and glycogen accumulation after treatment with fructose. The differences between KHK inhibition and knockdown are, in part, explained by the kinase-dependent and -independent effects of KHK on hepatic metabolism.

Keywords: Carbohydrate metabolism; Hepatitis; Hepatology; Metabolism; Obesity.


Conflict of interest statement

Conflict of interest: SS received grant funding from Alnylam Pharmaceuticals, Inc., to study the ketohexokinase (KHK) biology. Alnylam also provided KHK and siRNA and performed fructose-1 phosphate quantification. This work was also supported by AstraZeneca, who provided the KHK inhibitor, 3-O methylfructose, and performed pharmacokinetic studies. KW, JB, GO, AB, and MP are/were employees of AstraZeneca.

Figures

Figure 1
Figure 1. Inhibition of KHK activity, but not its KD, leads to hepatic glycogen accumulation.
(A) Weight gain of mice on low-fat diet (LFD), high-fat diet (HFD), HFD treated with siRNA, and HFD treated with inhibitor for the last 4 weeks of this 10-week experiment. (B) Lean mass and fat mass normalized by body weight as assessed by EchoMRI. Perigonadal adipose tissue (C) and liver (D) weights at the time of sacrifice. n = 7–8 mice per group. (E) Representative periodic acid–Schiff (PAS) stained images of liver histology. Bar = 50 μm. (F) Mass spectrometry (MS) analysis for glycogen in the liver. (G) Glycogen chain length as determined by MS. (H) Heatmap of all glycans and (I) principal component analysis of all glycans in LFD, HFD, HFD + siRNA, and HFD + Inhib groups. n = 4 mice per group. mRNA expression of Gck (J) and the genes involved in (K) glycogen synthesis and degradation. n = 6 mice per group. Statistical analysis was performed using 1-way ANOVA compared with LFD group (#P < 0.05; ##P < 0.01; ###P < 0.001; ####P < 0.0001) with post hoc 2-tailed t tests between the individual groups (*P < 0.05; **P < 0.01; ***P < 0.001; ****P < 0.0001).
Figure 2
Figure 2. Small molecule inhibitor decreases KHK enzymatic activity in liver and kidney but not in intestine.
(A) Serum fructose level from the mice at sacrifice. The levels of (B) fructose (C) and fructose 1-phosphate (F1P) and the ratio of (D) F1P/fructose in the liver. n = 7–8 mice per group. Quantification of KHK activity in (E) liver, (F) kidney, and (G) intestine. (H) Absolute KHK activity in liver, intestine, kidney, and perigonadal adipose tissue. (I) Western blot of total KHK and KHK-C in liver, intestine, kidney, and perigonadal adipose tissue. n = 4 mice per group. Actin was used as a loading control. (J) Urinary fructose level corrected by urine creatinine and (K) fructose excretion in urine over 24 hours. (L) In vivo monitoring of the inhibitor concentration over 24 hours following single gavage with 10 mg/kg or 30 mg/mL of the inhibitor. n = 2 mice per group. (M) Unbound plasma concentration of the inhibitor (red dots) quantified by MS in LFD-fed mice, 2–5 hours after last dose of the inhibitor. Pharmacokinetic model fitting (blue line) based on inhibitor concentration (red dots). Dashed line represents target concentration. Statistical analysis was performed using 1-way ANOVA compared with the LFD group (#P < 0.05; ##P < 0.01; ###P < 0.001; ####P < 0.0001) with post hoc 2-tailed t tests between the individual groups (*P < 0.05; **P < 0.01; ***P < 0.001; ****P < 0.0001).
Figure 3
Figure 3. KHK siRNA completely deletes KHK-C and increases HK2, while the inhibitor partially decreases both KHK-C and TKFC proteins.
(A) The fructose metabolism pathway. HK, hexokinase; ALDOB, aldolase B; DHAP, dihydroxyacetone phosphate; GA, glyceraldehyde; ADH, alcohol dehydrogenase; ALDH, aldehyde dehydrogenase; GA3P, glyceraldehyde 3-phosphate. (B) mRNA of fructose-metabolizing enzymes from livers of the mice. n = 6 mice per group. Tkfc, triokinase and FMN cyclase. (C) Western blot and (D) densitometry quantification of fructose metabolizing enzymes in liver lysates. n = 4 mice per group. (E) Densitometry quantification and (F) Western blot of HKs. n = 4 mice per group. (G) mRNA expression of HKs in the liver from mice fed an LFD. (H) Hepatic mRNA expression of aldo-keto reductase (Akr1b1) and sorbitol dehydrogenase (Sord). Statistical analysis was performed using 1-way ANOVA compared with the LFD group (#P < 0.05; ##P < 0.01; ###P < 0.001; ####P < 0.0001) with post hoc 2-tailed t tests between the individual groups (*P < 0.05; **P < 0.01; ***P < 0.001).
Figure 4
Figure 4. KD of KHK, but not inhibition of its activity, improves glucose tolerance and increases the glycolysis pathway.
(A) Glucose tolerance test (GTT) measured after 8 weeks on the diets and 2 weeks after initiation of the treatments. (B) Area under the curve calculated from GTT. n = 7–8 mice per group. Fasted serum glucose (C), insulin (D), and calculated HOMA-IR (E) at 10 weeks on the diet. (F) Western blot analysis of insulin signaling in the liver. n = 4 mice per group. Western blot analysis (G) and quantitative PCR (qPCR) quantification (H) of genes mediating the gluconeogenesis pathway. n = 6 mice per group for gene expression. Actin was used as a loading control. (I) Short-chain and (J) long-chain acylcarnitines quantified by MS. n = 7 – 8 mice per group. Statistical analysis was performed using 1-way ANOVA compared with the LFD group (#P < 0.05; ##P < 0.01; ###P < 0.001; ####P < 0.0001) with post hoc 2-tailed t tests between the individual groups (*P < 0.05; **P < 0.01; ***P < 0.001; ****P < 0.0001).
Figure 5
Figure 5. RNA-Seq analysis reveals profound and unique effects of KHK KD versus inhibition on hepatic transcriptome.
(A) Principal component analysis of RNA-Seq data from the livers of our experimental mice. (B) A heatmap representation of the top 40 genes plus KHK. (C) Heatmap of the DNL pathway and (D) the FAO pathway. Volcano plot comparison of (E) HFD and LFD, (F) HFD and HFD + siRNA, (G) HFD and HFD + Inhibitor, and (H) HFD + siRNA and HFD + Inhibitor. Reactome pathway analysis showing the most significantly altered pathways between (I) HFD + siRNA versus HFD group and (J) HFD + Inhibitor versus HFD group.
Figure 6
Figure 6. KHK KD lowers the DNL, while the inhibitor increases the FAO pathway.
(A) ChREBP-β (MLXIPL-β) and (B) SREBF1c mRNA expression in the livers of our experimental mice. Box plots show the interquartile range, median (line), and minimum and maximum (whiskers). (C) Western blot showing nuclear translocation of ChREBP and SREBP1 proteins in the liver. (D) mRNA and (E) Western blot quantification of proteins involved in DNL. (F) Protein and (G) mRNA expression of genes regulating mitochondrial FAO. (H) Protein and (I) mRNA expression of genes regulating peroxisomal FAO. n = 7–8 mice per group for mRNA expression and n = 4 mice per group for protein quantification. Statistical analysis was performed using 1-way ANOVA compared with the LFD group (##P < 0.01; ###P < 0.001; ####P < 0.0001) with post hoc 2-tailed t tests between the individual groups (*P < 0.05; **P < 0.01; ****P < 0.0001).
Figure 7
Figure 7. Overexpression of wild-type KHK supports glycogen accumulation, while overexpression of kinase-dead mutant KHK increases the expression of the DNL pathway.
(A) KHK-C mRNA overexpression in control HepG2 cells, GFP-tagged wild-type mouse KHK-C–overexpressed cells (WT KHK-C), or mouse kinase-dead mutant–overexpressed (KM KHK-C) cells using lentivirus transfection. (B) Protein levels of fructose-metabolizing enzymes in control HepG2 cells, WT KHK-C cells, KM KHK-C cells, and mouse liver. (C) KHK activity in control HepG2 cells, WT KHK-C cells, and KM KHK-C cells treated with 5 mM fructose. (D) ALT level and (E) total protein after treatment with 5 mM fructose or 5 mM 3-O methylfructose (3-OMF) for 24 hours. (F) PAS staining of HepG2 cells treated with fructose for 24 hours. Scale bar, 10 µm. (G) Glycogen levels in control HepG2 cells, WT KHK-C cells, and KM KHK-C cells treated with fructose or 3-OMF. mRNA of Gckrp (H), Hk1 (I), and HK2 (J) expression in these cells treated with fructose or 3-OMF. (K) Western blot of enzymes involved in sugar metabolism in control HepG2 cells, WT KHK-C cells, KM KHK-C cells, and mouse liver. (L) mRNA expression of DNL genes and (M) FAO genes. n = 4 mice per group for gene expression and protein quantification. Statistical analysis was performed using 1-way ANOVA compared with the LFD group (#P < 0.05; ##P < 0.01; ###P < 0.001; ####P < 0.0001) with post hoc 2-tailed t tests between the individual groups (****P < 0.0001).

References

    1. Nishida C, et al. The Joint WHO/FAO Expert Consultation on diet, nutrition and the prevention of chronic diseases: process, product and policy implications. Public Health Nutr. 2004;7(1a):245–250. doi: 10.1079/PHN2003592. - DOI - PubMed
    1. Johnson RK, et al. Dietary sugars intake and cardiovascular health: a scientific statement from the American Heart Association. Circulation. 2009;120(11):1011–1020. doi: 10.1161/CIRCULATIONAHA.109.192627. - DOI - PubMed
    1. Dworatzek P, et al. Canadian Diabetes Association clinical practice guidelines expert committee. Nutrition therapy. Can J Diabetes. 2013;37(suppl 1):S45–S55. doi: 10.1016/j.jcjd.2013.01.019. - DOI - PubMed
    1. European Association for the Study of the Liver. EASL-EASD-EASO Clinical practice guidelines for the management of non-alcoholic fatty liver disease. Obes Facts. 2016;9(2):65–90. doi: 10.1159/000443344. - DOI - PMC - PubMed
    1. Softic S, Kahn CR. Fatty liver disease: is it nonalcoholic fatty liver disease or obesity-associated fatty liver disease? Eur J Gastroenterol Hepatol. 2019;31(1):143. doi: 10.1097/MEG.0000000000001279. - DOI - PMC - PubMed