. 2024 Dec 6;9(23):e182390.
doi: 10.1172/jci.insight.182390.

NK cell subsets define sustained remission in rheumatoid arthritis

Affiliations

NK cell subsets define sustained remission in rheumatoid arthritis

Carl Coyle et al. JCI Insight. .

Abstract

Rheumatoid arthritis (RA) is an immune-mediated, chronic inflammatory condition. With modern therapeutics and evidence-based management strategies, achieving sustained remission is increasingly common. To prevent complications associated with prolonged use of immunosuppressants, drug tapering or withdrawal is recommended. However, due to the lack of tools that define immunological remission, disease flares are frequent, highlighting the need for a more precision medicine-based approach. Utilizing high-dimensional phenotyping platforms, we set out to define peripheral blood immunological signatures of sustained remission in RA. We identified that CD8+CD57+KIR2DL1+ NK cells are associated with sustained remission. Functional studies uncovered an NK cell subset characterized by normal degranulation responses and reduced proinflammatory cytokine expression, which was elevated in sustained remission. Furthermore, flow cytometric analysis of NK cells from synovial fluid combined with interrogation of a publicly available single-cell RNA-Seq dataset of synovial tissue from active RA identified a deficiency of the phenotypic characteristics associated with this NK cell remission signature. In summary, we have uncovered an immune signature of RA remission associated with compositional changes in NK cell phenotype and function that has implications for understanding the effect of sustained remission on host immunity and distinct features that may define operational tolerance in RA.

Keywords: Autoimmunity; NK cells; Rheumatology; Tolerance.


Figures
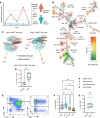
Figure 1
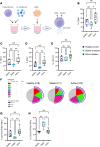
Figure 1. Peripheral blood CD8+CD57+ NK cells are associated with sustained RA remission.
(A) Longitudinal changes in DAS28 scores define key patient trajectory groups. (B) Multiple spanning tree visualization depicting differential cluster abundance analysis (comparing intermittent to stable remission) according to differences in fold change (color gradient along the y axis) and in order of increasing significance (color gradient along the x axis). (C) FreeViz analysis comparing total CD56dim NK cells (left) and total CD56dimCD57+ NK cells (right). (D) The percentage of cells in CD8+CD57+ NK cell clusters between intermittent (n = 5) and stable remission (n = 5). (E) Flow cytometry gating to define CD56dim NK cells (left) followed by subsetting based on CD8 and CD57 expression (right). (F) The proportion of CD8+CD57+ CD56dim NK cells across healthy donors (n = 6), stable remission (n = 14), intermittent remission (n = 8), and active disease (n = 8). (G) The proportion of CD8+CD57+ NK cells from paired baseline and month 12 samples from stable RA remission (n = 10). Whiskers on plots represent minimum to maximum values. P values were determined by using the Mann-Whitney U test (D), Kruskal-Wallis test with Dunn’s multiple-test correction (F), and Wilcoxon matched-pairs signed-rank test (G). *P < 0.05, **P < 0.01, ***P < 0.001.
Figure 2
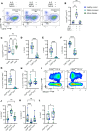
Figure 2. CD8+CD57+ NK cells expressing KIR2DL1 are expanded in stable remission.
(A) The proportion of total CD56dim NK cells that are NKG2A+ compared with KIR2DL1+. (B) The proportion of total CD56dim NK cells that are CD8+CD57+NKG2A+ compared with CD8+CD57+KIR2DL1+. (C) CD8+CD57+KIR2DL1+ NK cells as a percentage of CD56dim. Whiskers on plots represent minimum to maximum values. P values were determined by using the Mann-Whitney U test (A and B) and Kruskal-Wallis test with Dunn’s multiple-test correction (C). *P < 0.05, **P < 0.01.
Figure 3
Figure 3. CD8+CD57+ NK cells display higher levels of CD226 expression consistent across RA disease activity states.
(AD) Median fluorescence intensity (MFI) of NKG2D, NKp46, CD226, and CD16 on NK cell subsets subdivided by CD8 and CD57 expression. (E) MFI of CD226 on CD8+CD57+ NK cells. Whiskers on plot represent minimum to maximum values. All P values were determined using the Kruskal-Wallis test with Dunn’s multiple-test correction. **P < 0.01, ***P < 0.001, ****P < 0.0001.
Figure 4
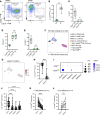
Figure 4. NK cell subsets with normal degranulation responses and reduced proinflammatory cytokine expression are elevated in stable remission.
(A) NK cells from healthy donors (n = 6), stable remission (n = 7), and active disease (n = 6) were purified and stimulated with IL-2 (200 IU/mL) and incubated with K562 cells. (B–E) The proportions of NK cells expressing CD69, TNF-α, IFN-γ, and CD107a. (F) SPICE analysis defines 8 distinct functional subtypes based on TNF-α, IFN-γ and CD107a expression. (G and H) the proportion of CD107a+IFN-γ+TNF-α+ and CD107a+IFN-γTNF-α functional subsets. Whiskers on plots represent minimum to maximum values. All P values were determined using the Kruskal-Wallis test with Dunn’s multiple-test correction. *P < 0.05, **P < 0.01.
Figure 5
Figure 5. A distinct phenotypic subset of NK cells associated with in vitro polyfunctional responses is reduced in stable remission.
(A and B) The in vitro induction of a CD56dimCD16 NK cell population, which arises in response to IL-2 stimulation and K562 interaction, is reduced upon treatment with TAPI-0 (5 μM). (C) The proportion of CD56dimCD16 NK cells in response to IL-2 stimulation and K562 interaction. (DH) Comparison of the proportion of NK cells expressing TNF-α, IFN-γ, and CD107a (DF) as well as CD107a+IFN-γ+TNF-α+ (G) and CD107a+IFN-γTNF-α (H) functional subsets between CD56dimCD16 and CD56dimCD16+ NK cells. (I) Representative flow plot demonstrating the expression of KIR2DL1 and NKG2A. (J and K) Differences in the expression from baseline (IL-2K562) of NKG2A, and KIR2DL1 between CD56dimCD16 and CD56dimCD16+ subsets. (L) Comparison of the proportion of CD57+ NK cells between CD56dimCD16 and CD56dimCD16+ subsets. Whiskers on plots represent minimum to maximum values. All P values were determined using the Kruskal-Wallis test with Dunn’s multiple-test correction. *P < 0.05, **P < 0.01, ****P < 0.0001
Figure 6
Figure 6. Phenotypic features associated with sustained remission are reduced on NK cells from the joint of active RA.
(A) Expression of CD56 and CD16 defines CD56brightCD16 and CD56dimCD16+ subsets between paired peripheral blood (PB) and synovial fluid (SF) (n = 6). (B) The proportion of CD56bright NK cells between PB and SF. (CE) The expression of CD57, NKG2A, and KIR2DL1 across CD56dim and CD56bright NK cells in PB and CD56bright NK cells in SF. (F) UMAP plot demonstrating 8 transcriptional NK Cell/ILC clusters derived from single-cell RNA-Seq on synovial tissue from patients with active RA. (G) UMAP feature plot showing the expression of B3GAT1 across CD56bright and CD56dim clusters. (H) Comparison of the proportion of CD56dim NK cells not expressing and expressing B3GAT1 across individual tissue samples (n = 63). (I) Bubble plots demonstrating the percentage of cells expressing genes for specific inhibitory receptors and their expression levels across CD56bright and CD56dim clusters. (J) Comparing the proportion of CD56dim NK cells expressing KLRC1 to cells expressing genes encoding each corresponding KIR. (K and L) The proportion of NK cells expressing KLRC1 versus KIR2DL1 at a greater than or less than 2-fold difference. Whiskers on plots represent minimum to maximum values. All P values were determined using the Mann-Whitney U test (BE and H), the Kruskal-Wallis test with Dunn’s multiple-test correction (J), and the Wilcoxon matched-pairs signed-rank test (K and L). **P < 0.01, ****P < 0.0001.

References

    1. Brown PM, Isaacs JD. Rheumatoid arthritis: from palliation to remission in two decades. Clin Med (Lond) 2014;14 Suppl 6(6):s50–s55. doi: 10.7861/clinmedicine.14-6-s50. - DOI - PubMed
    1. Hamed KM, et al. Overview of methotrexate toxicity: a comprehensive literature review. Cureus. 2022;14(9):e29518. doi: 10.7759/cureus.29518. - DOI - PMC - PubMed
    1. Verstappen M, van der Helm-van Mil AHM. Sustained DMARD-free remission in rheumatoid arthritis - about concepts and moving towards practice. Joint Bone Spine. 2022;89(6):105418. doi: 10.1016/j.jbspin.2022.105418. - DOI - PMC - PubMed
    1. D’Onofrio B, et al. Inducibility or predestination? Queries and concepts around drug-free remission in rheumatoid arthritis. Expert Rev Clin Immunol. 2023;19(2):217–225. doi: 10.1080/1744666X.2023.2157814. - DOI - PubMed
    1. Smolen JS, et al. EULAR recommendations for the management of rheumatoid arthritis with synthetic and biological disease-modifying antirheumatic drugs: 2019 update. Ann Rheum Dis. 2020;79(6):685–699. doi: 10.1136/annrheumdis-2019-216655. - DOI - PubMed