. 2025 Feb;80(2):440-461.
doi: 10.1111/all.16338. Epub 2024 Oct 17.

The IL-4-IL-4Rα axis modulates olfactory neuroimmune signaling to induce loss of smell

Affiliations

The IL-4-IL-4Rα axis modulates olfactory neuroimmune signaling to induce loss of smell

Yannis Hara et al. Allergy. 2025 Feb.

Abstract

IL-4 and IL-13 have non-redundant effects in olfaction, with loss of smell in mice evoked only by intranasal administration of IL-4, but not IL-13. IL-4-evoked pathophysiological effects on olfaction is independent of compromised structural integrity of the olfactory neuroepithelium. IL-4-IL-4Rα signaling modulates neuronal crosstalk with immune cells, suggesting a functional link between olfactory impairment and neuroinflammation. Abbreviations: IL, interleukin; KO, knock-out; wk, week; WT, wild-type.

Background: Loss of smell is a part of the diagnostic criteria for CRSwNP. Although the mechanistic understanding is poor, inhibition of IL‐4Rα and IL‐4/IL‐13 signaling improves loss of smell in CRSwNP patients. In the present study, we compare the effects of IL‐4, IL‐13, and IL‐4Rα blockade on murine olfaction and identify the underlying pathophysiological mechanisms of loss of smell.

Methods: To evaluate the effects of IL‐4 and IL‐13 on olfactory function, we administered these cytokines intranasally to BALB/c mice for 5 consecutive days and assessed their latency to find hidden food. Calcium uptake assays were conducted to measure olfactory neuronal activity in vitro and ex vivo. We also performed histological analyses, proteomics, bulk RNA sequencing, and single‐cell RNA sequencing to assess the impact of IL‐4, IL‐13, and IL‐4Rα blockade on the olfactory epithelium and to identify potential molecular or cellular correlations with smell loss in human CRSwNP patients.

Results: Here, we provide evidence for non‐redundant effects of IL‐4 and IL‐13 in olfaction, with loss of smell in mice evoked by intranasal administration of IL‐4, not IL‐13. We demonstrate that an IL‐4–IL‐4Rα axis has a direct functional impact on murine olfactory sensory neurons and evokes inflammatory cell infiltration and pathophysiologic modulation of unique molecular signatures in olfactory epithelium without compromising structural integrity. Furthermore, single‐cell analysis of olfactory epithelium reveals that IL‐4–IL‐4Rα signaling modulates neuronal crosstalk with mast cells, macrophages, and NK cells, suggesting a functional link between olfactory impairment and neuroinflammation.

Conclusion: Collectively, this study suggests that an IL‐4–IL‐4Rα signaling axis plays a unique pathophysiological role in olfactory dysfunction via direct effect on neurons and modulation of neuroimmune interactions.


Conflict of interest statement

All authors are/were employees or officers of Sanofi or Regeneron Pharmaceuticals and may hold stock and/or stock options in their respective company.

Figures
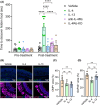
FIGURE 1
FIGURE 1
Intranasal administration of IL‐4, but not IL‐13, induced loss of smell in mice, which was attenuated by genetic ablation or antibody blockade of IL‐4Rα. A, Loss of smell was quantified measuring time to discover hidden food before (baseline) and after intranasal administrations for 5 consecutive days of PBS, IL‐4, or IL‐13 (10 μg/20 μL for each cytokine). Mice in the anti‐IL‐4Rα (pretreated with dupilumab surrogate antibody) and IL‐4Rα KO (IL‐4Rα global knockout) groups received intranasal administration of IL‐4. n = 5–10 mice per group. ****p < .0001, ***<.001, **<.01 by two‐way ANOVA with Tukey's multiple comparison test. Data are represented as mean ± SEM. B, Representative images of the olfactory epithelium of mice following 5 consecutive days' administration with or without IL‐4 and IL‐13 after immunofluorescence staining with anti‐OMP or anti‐GAP43 antibody. C, D, Quantification of (C) OMP and (D) GAP43‐positive areas is presented in percent of the total olfactory epithelial region in the field of view. Images from n = 3–4 mice per group were quantified. ns, by one‐way ANOVA with Tukey's multiple comparison test. Data are represented as mean ± SEM. Scale bars: 50 μm. ANOVA, analysis of covariance; IL, interleukin; ns, not significant; OMP, olfactory marker protein; ns, not significant; PBS, phosphate buffer saline; SEM, standard error of mean.
FIGURE 2
FIGURE 2
IL‐4 and IL‐13 each significantly increased calcium uptake in murine OSNs in vitro but only IL‐4 impaired the neuronal responsiveness to odorant stimuli ex vivo. A, B, Calcium imaging traces of OSNs isolated from murine olfactory epithelium in response to IL‐4 (A) and IL‐13 (B). Arrows show the time of cytokine challenge. n = 13–15 OSNs from three independent experiments are pooled together. Data are represented as mean. C, D, E, Calcium imaging traces of OSNs isolated from olfactory epithelium of mice exposed to IL‐4 (C) or IL‐13 (D) for 5 consecutive days and challenged with odorants. Some mice exposed to IL‐4 were pretreated with dupilumab surrogate antibody (E). Arrow shows the time of challenge with odorants. n = 13–21 OSNs from three independent experiments are pooled together. Data are represented as mean. IL, interleukin; OSNs, olfactory sensory neurons; PBS, phosphate buffer saline.
FIGURE 3
FIGURE 3
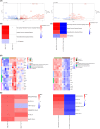
IL‐4, but not IL‐13, activates immune response and induces neuroinflammation in murine olfactory epithelium at transcriptomic level. A, Volcano plots of differentially expressed genes identified from comparisons of IL‐4 versus PBS group (left) and IL‐13 versus PBS (right) (x‐axis = FC of expression and y‐axis = FDR adjusted p‐value; FC cut‐off = 1.5, FDR cut‐off = 0.05 depicted respectively by the vertical and horizontal lines). B, C, Heatmap depicts z‐score of pathway activation performed by using IPA enrichment analysis of IL‐4 or IL‐13 treated groups versus the PBS control (B) and the isotype or anti‐IL‐4Rα treated groups vs. the PBS control (C); *B–H adjusted p < .05, ˙B‐H adjusted p < .1. D, Expression heatmaps of top differentially expressed genes in Multiple Sclerosis Signaling, Macrophage Alternative Activation, Neuroinflammation, and IL‐10 Signaling pathway in PBS, IL‐4 treated, and IL‐13 treated groups (left), IL‐4 treated + isotype and IL‐4 treated + anti‐IL‐4Rα groups (right). Data are represented as z‐transformed gene expression within each gene. E, Heatmaps of NES of olfactory neuroepithelium cell signatures from comparisons of IL‐4 versus PBS and IL‐13 versus PBS (left), Isotype + IL‐4 versus Isotype + PBS and Anti‐IL‐4Rα + IL‐4 versus Isotype + IL‐4 (right). *q < .05, ˙q < .1. FC, fold change; FDR, false discovery rates; IL, interleukin; IPA, ingenuity pathway analysis; NES, normalized enrichment score; PBS, phosphate buffer saline.
FIGURE 4
FIGURE 4
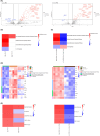
IL‐4, and not IL‐13, activates immune response and induces neuroinflammation in murine olfactory epithelium at proteome level. A, Volcano plots of differentially expressed proteins identified from comparisons of IL‐4 versus PBS (left), IL‐13 versus PBS (right) (x‐axis = FC of expression and y‐axis = FDR adjusted p‐value; FC cut‐off = 1.2, FDR cut‐off = 0.05 depicted respectively by the vertical and horizontal lines). B, C, Heatmap depicts z‐score of pathway activation performed by using IPA enrichment analysis of IL‐4 or IL‐13 treated groups versus the PBS control (B) and the isotype or anti‐IL‐4Rα treated groups versus the PBS control (C); *B–H adjusted p < .05, B–H adjusted p < .1. D, Expression heatmaps of top differentially expressed proteins in multiple sclerosis signaling, macrophage alternative activation, neuroinflammation, and IL‐10 signaling pathway in PBS, IL‐4 treated, and IL‐13 treated groups (left), IL‐4 treated + isotype and IL‐4 treated + anti‐IL‐4Rα groups (right). Data are represented as z‐transformed expression within each protein. E, Heatmaps of NES of olfactory neuroepithelium cell signatures from comparisons of IL‐4 versus PBS and IL‐13 versus PBS (left), Isotype + IL‐4 versus Isotype + PBS and Anti‐IL‐4Rα + IL‐4 versus Isotype + IL‐4 (right) (*q‐value <.05, ˙q‐value <.1). FC, fold change; FDR, false discovery rates; IL, interleukin; IPA, ingenuity pathway analysis; NES, normalized enrichment score; PBS, phosphate buffer saline.
FIGURE 5
FIGURE 5
Murine olfactory epithelium immune cell associated genes are upregulated and correlated with smell in human patients with CRSwNP. A, B, Heatmaps of olfactory epithelium immune cell‐associated genes that were enriched in both (A) anosmia model setting, which consists of mouse olfactory epithelium treated with PBS + Isotype, IL‐4 + Isotype, or IL‐4 + Dupilumab surrogate antibody, and (B) human CRSwNP disease setting, which consists of inferior turbinate samples from healthy controls and nasal polyp tissue from CRSwNP patients. Data are represented as z‐transformed gene expression within each gene. C, Correlation of UPSIT scores with the gene expression of olfactory neuroepithelium immune cell‐associated genes in human baseline samples from the SINUS‐52 nasal brushing sub‐study. CRSwNP, chronic rhinosinusitis with nasal polyps; IL, interleukin; PBS, phosphate buffer saline; UPSIT, University of Pennsylvania Smell Identification Test.
FIGURE 6
FIGURE 6
Single cell RNA‐seq analysis of murine olfactory epithelium reveals a regulatory role of IL‐4–IL‐4Rα signaling in neuroimmune crosstalk. A, UMAP of all cells in dataset annotated by SARGENT classified cell states (left). UMAP subset of nonimmune cells using same UMAP coordinates (middle). Subset of immune cells using same UMAP coordinates (right). B, Dotplot of genes used to separate immune and nonimmune compartments (left). C, BeeSwarmPlots by cellstates using miloR (left) IL‐4 (blue) versus Control (red) (right) IL‐4–IL‐4Rα (blue) versus Control (red). Dots represent neighborhood and colored dots highlight differentially abundant neighborhoods in the cellstate. D, UMAP subset of neighborhoods that are called mature olfactory neurons (top). Differentially expressed genes when comparing a neighborhood that was significantly enriched in IL‐4 condition as compared to Control condition to all other mature olfactory neuron enriched neighborhoods (top‐right). GSEA plots highlighting enriched pathways differentially abundant neighborhood 15 in the IL‐4 treated animal group (bottom‐right). GSEA, gene set enrichment analysis; IL, interleukin; RNA, ribonucleic acid.
FIGURE 7
FIGURE 7
Pathogenic neuronal‐immune cell interactome in murine olfactory epithelium following IL‐4 exposure. A, Working model detailing ligand‐receptor interactions investigated using MultiNicheNetR: Mature olfactory neurons <−> macrophage/mast/NK cells only considered. B, (i) Circos plots highlighting (arrows) the top 50 unbiased ranked interactions of IL‐4‐simulated samples with opacity scaled to prioritization_score Control (left), IL‐4‐stimulation (middle), IL‐4–IL‐4Rα (right). (ii) Circos plots highlighting (arrows) the top 50 unbiased ranked interactions of Control samples with opacity scaled to prioritization_score Control (left), IL‐4‐stimulation (middle), IL‐4–IL‐4Rα (right). C, Heatmap comparing the predicted scores of each of these interactions for the top 25 IL‐4 interactions by prioritization_score and the sample‐level ligand‐receptor activity predicted by MultiNicheNetR. IL, interleukin; NK, natural killer.Panel A of Figure 7 partly created using BioRender.com.
FIGURE 8
FIGURE 8
Expression of type I and type II IL‐4Rα complex across cell types. A, Bubble plot of IL4ra, IL13ra, and IL2rg and its expression pattern across the 22 SARGENT annotated cell‐states. B, Model for the inferred distribution of type I and type II receptor complexes based on expression profile of Il4ra, Il13ra1, and Il2rg using scRNA‐seq analyses in murine olfactory epithelium and infiltrated immune cells providing a potential explanation behind the dominant role of IL‐4 versus IL‐13 in inducing olfactory dysfunction in the experimental model. IL, interleukin; scRNA analyses, single cell ribonucleic acid analyses.Panel B of Figure 8 partly created using BioRender.com.

References

    1. Macchi A, Giorli A, Cantone E, et al. Sense of smell in chronic rhinosinusitis: a multicentric study on 811 patients. Front Allergy. 2023;4:1083964. doi:10.3389/falgy.2023.1083964 - DOI - PMC - PubMed
    1. Bachert C, Bhattacharyya N, Desrosiers M, Khan AH. Burden of disease in chronic rhinosinusitis with nasal polyps. J Asthma Allergy. 2021;14:127‐134. doi:10.2147/JAA.S290424 - DOI - PMC - PubMed
    1. Khan A, Huynh TMT, Vandeplas G, et al. The GALEN rhinosinusitis cohort: chronic rhinosinusitis with nasal polyps affects health‐related quality of life. Rhinology. 2019;57:343‐351. doi:10.4193/Rhin19.158 - DOI - PubMed
    1. Mullol J, Azar A, Buchheit KM, Hopkins C, Bernstein JA. Chronic rhinosinusitis with nasal polyps: quality of life in the biologics era. J Allergy Clin Immunol Pract. 2022;10:1434‐1453. doi:10.1016/j.jaip.2022.03.002 - DOI - PubMed
    1. Hirsch AG, Stewart WF, Sundaresan AS, et al. Nasal and sinus symptoms and chronic rhinosinusitis in a population‐based sample. Allergy. 2017;72:274‐281. doi:10.1111/all.13042 - DOI - PMC - PubMed

Substances