. 2024 Oct 17;19(10):e0305630.
doi: 10.1371/journal.pone.0305630. eCollection 2024.

Multiclass classification of Autism Spectrum Disorder, attention deficit hyperactivity disorder, and typically developed individuals using fMRI functional connectivity analysis

Affiliations

Multiclass classification of Autism Spectrum Disorder, attention deficit hyperactivity disorder, and typically developed individuals using fMRI functional connectivity analysis

Caroline L Alves et al. PLoS One. .

Abstract

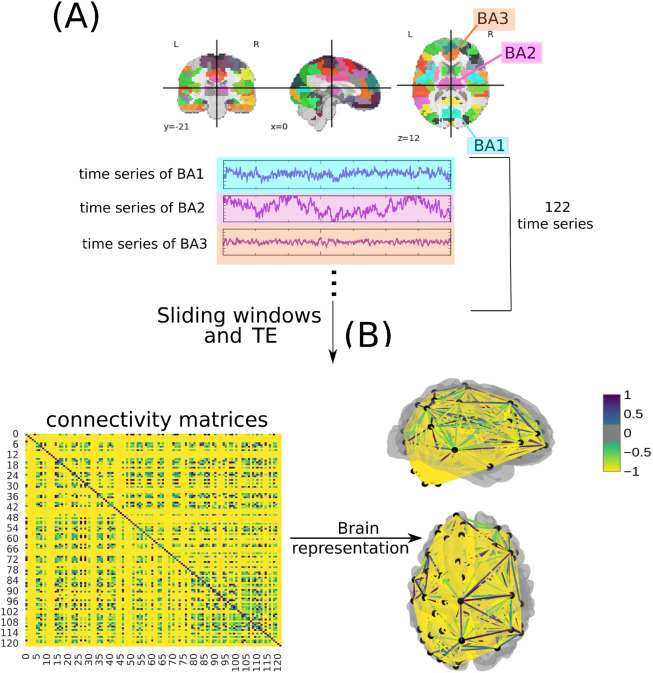
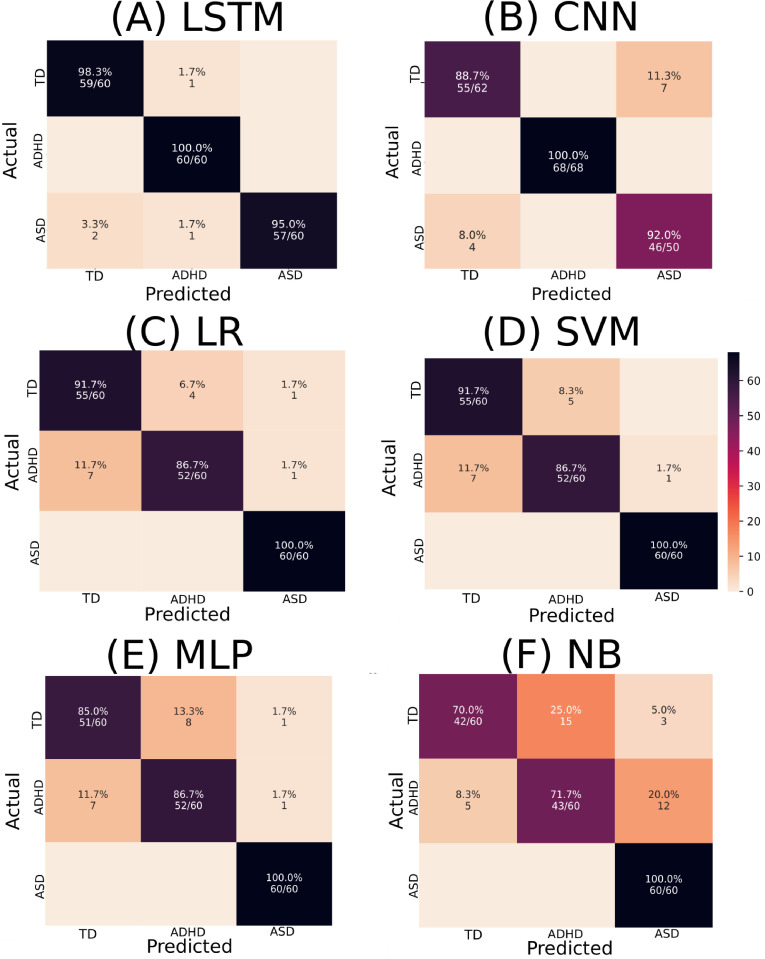
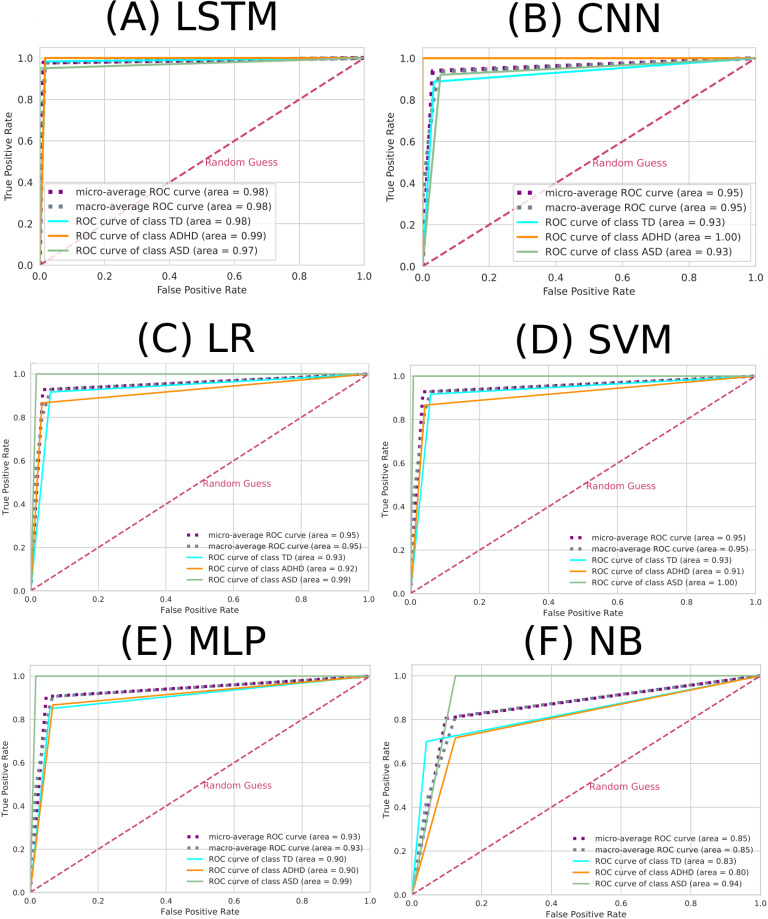
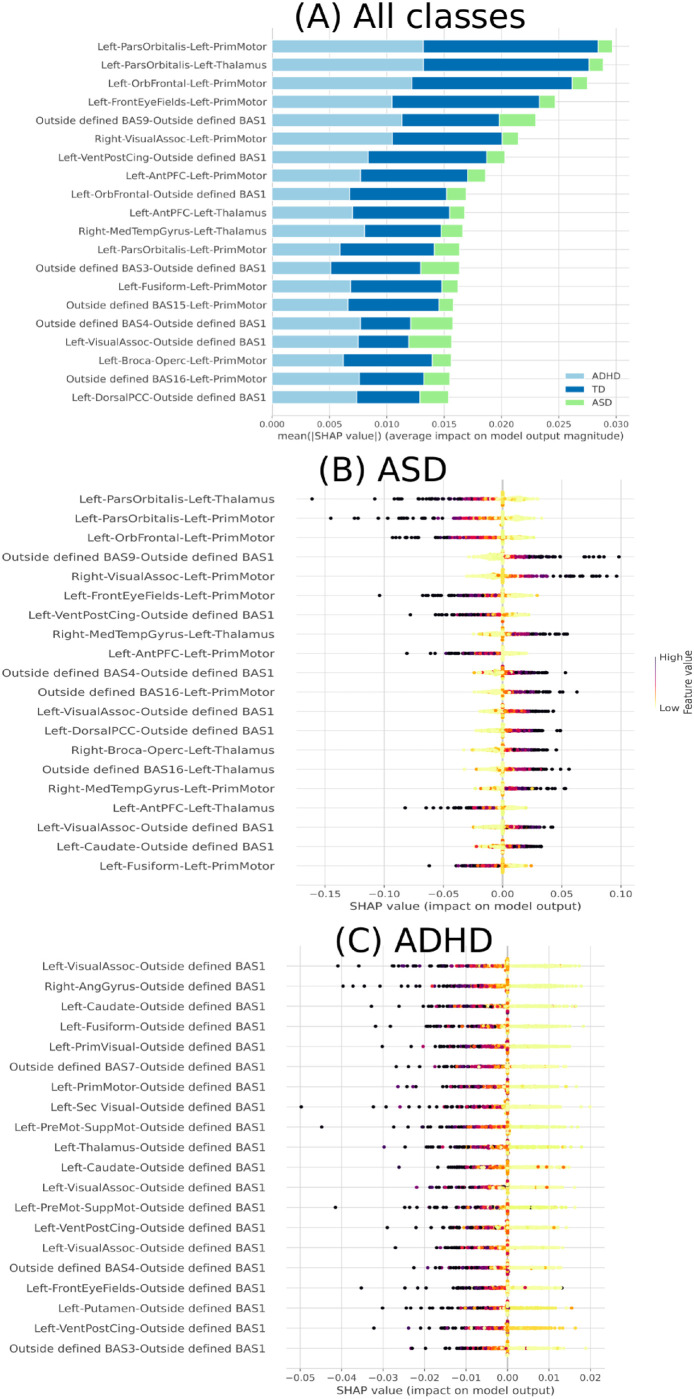
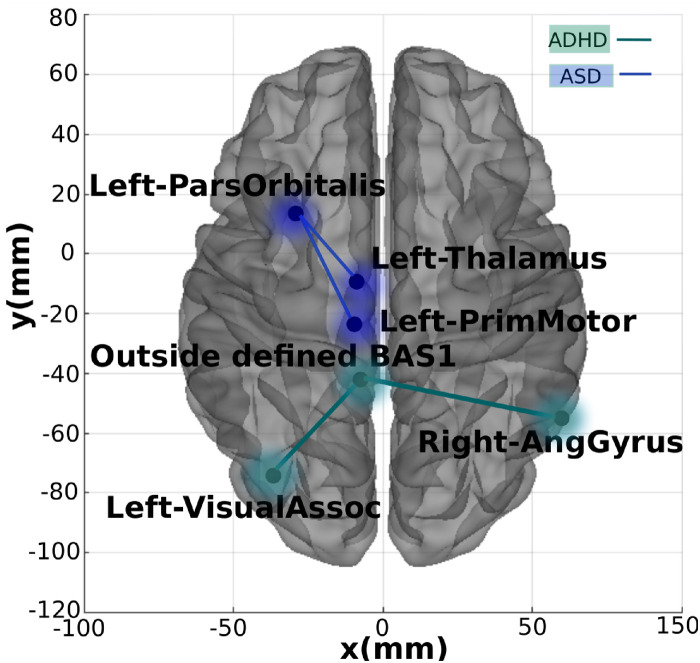
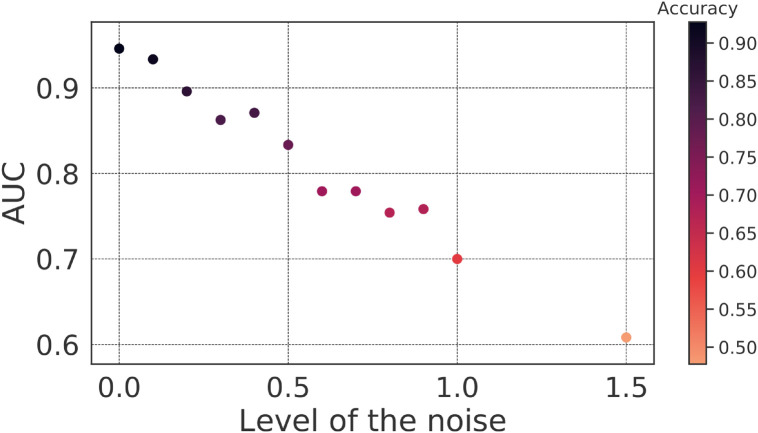
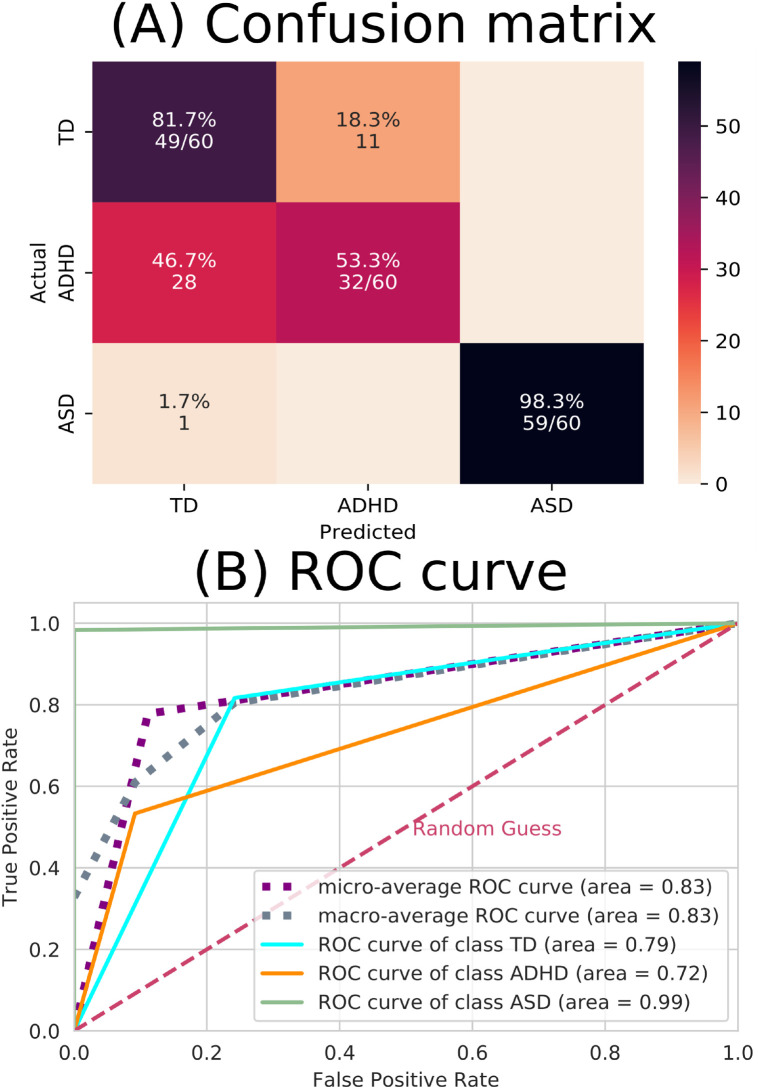
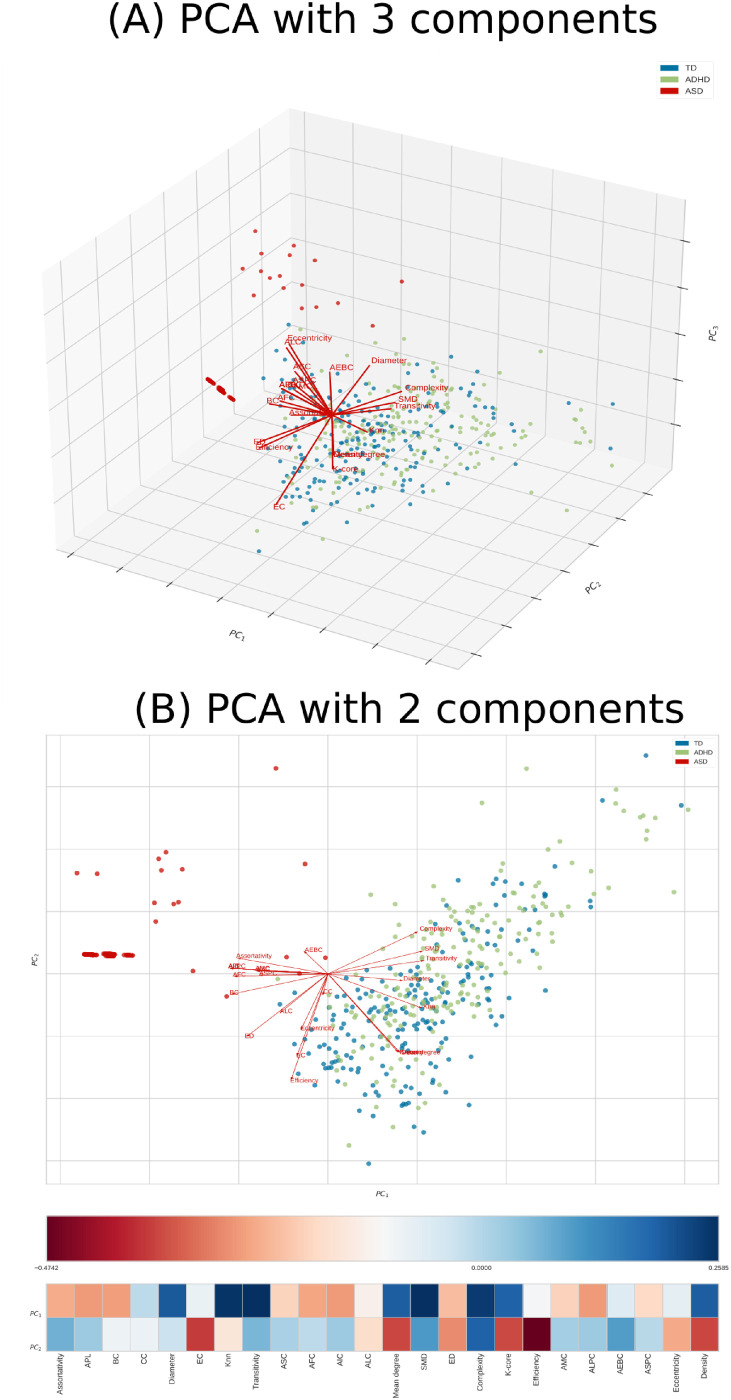
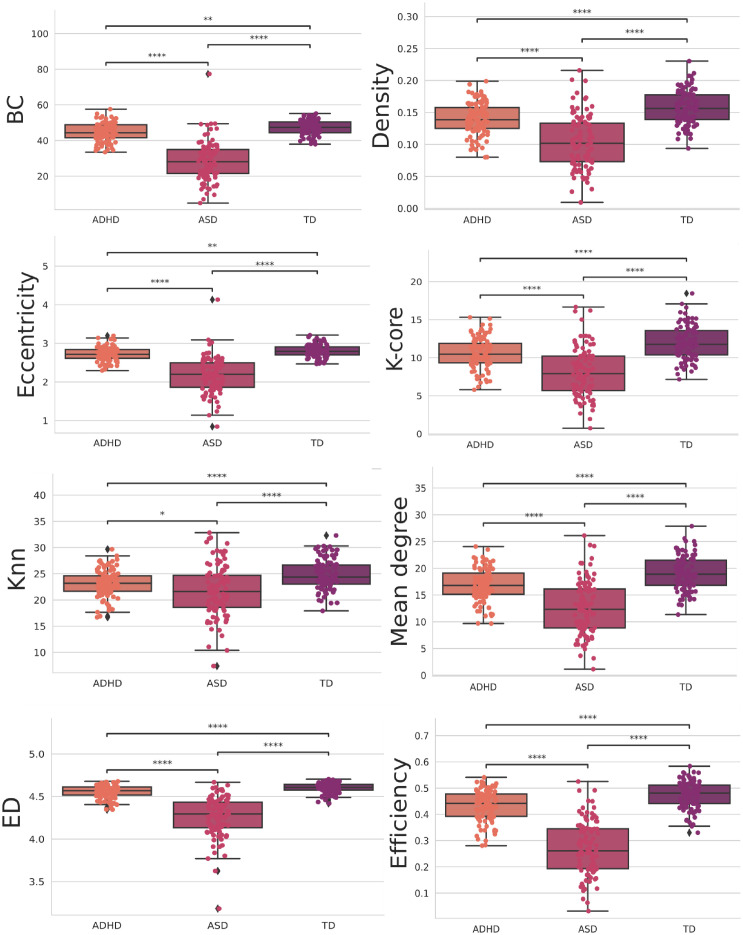
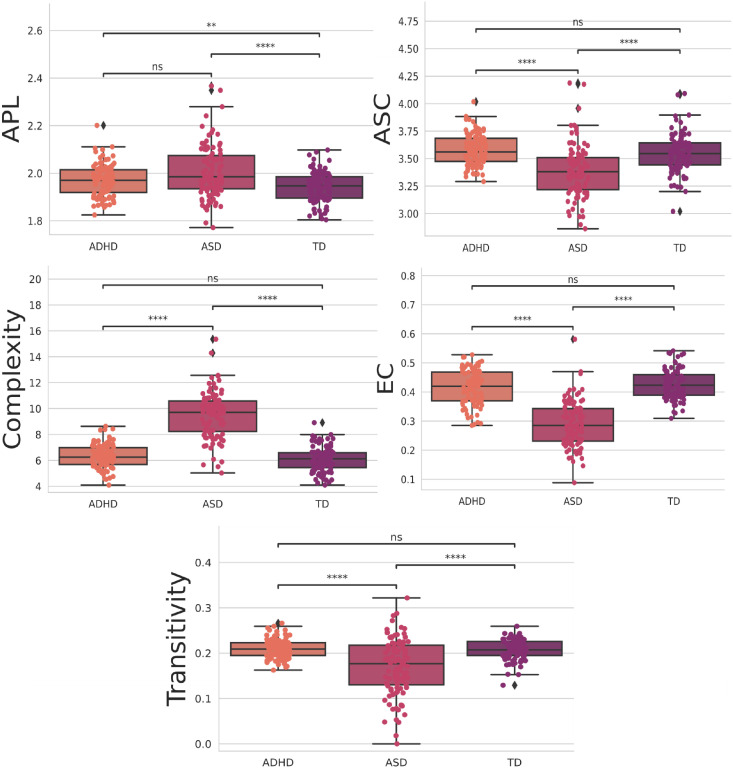
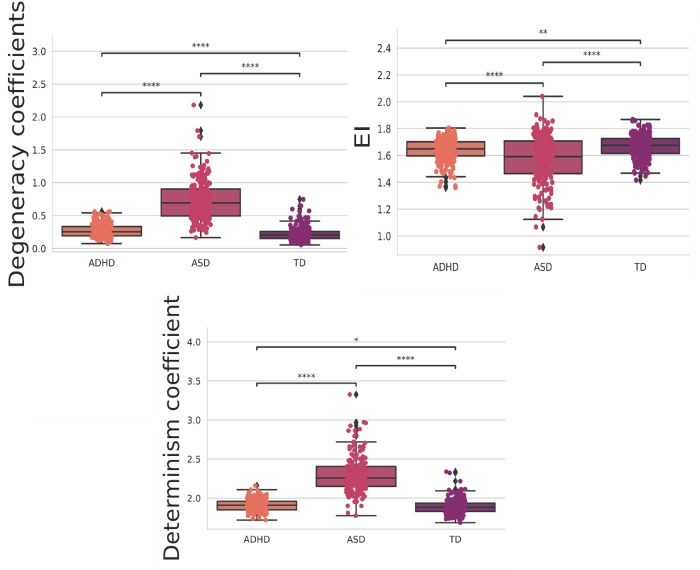
Neurodevelopmental conditions, such as Autism Spectrum Disorder (ASD) and Attention Deficit Hyperactivity Disorder (ADHD), present unique challenges due to overlapping symptoms, making an accurate diagnosis and targeted intervention difficult. Our study employs advanced machine learning techniques to analyze functional magnetic resonance imaging (fMRI) data from individuals with ASD, ADHD, and typically developed (TD) controls, totaling 120 subjects in the study. Leveraging multiclass classification (ML) algorithms, we achieve superior accuracy in distinguishing between ASD, ADHD, and TD groups, surpassing existing benchmarks with an area under the ROC curve near 98%. Our analysis reveals distinct neural signatures associated with ASD and ADHD: individuals with ADHD exhibit altered connectivity patterns of regions involved in attention and impulse control, whereas those with ASD show disruptions in brain regions critical for social and cognitive functions. The observed connectivity patterns, on which the ML classification rests, agree with established diagnostic approaches based on clinical symptoms. Furthermore, complex network analyses highlight differences in brain network integration and segregation among the three groups. Our findings pave the way for refined, ML-enhanced diagnostics in accordance with established practices, offering a promising avenue for developing trustworthy clinical decision-support systems.


Conflict of interest statement

EpilabKI is funded through the Bavarian stated Ministery for Sciences and the Arts research. This does not alter our adherence to PLOS ONE policies on sharing data and materials.

Figures

Fig 1
Fig 1. Methodology to obtain the connectivity matrices based on [34].
In (A), a time series of 122 ROI is extracted from fMRI data using the BASC BOLD atlas (highlighted in blue, purple, and orange). A sliding window was performed as a data augmentation. Then, they are correlated (B) to form the connectivity matrices, where each row and column corresponds to one of the Brodmann areas for a patient with ASD, TD, and ADHD (the figure illustrates an example of a connectivity matrix with a normalized TE of a subject presenting ADHD). The same highlighted matrices represent the brain in a three-dimensional (in a top and left perspective) schematic.
Fig 2
Fig 2. Confusion matrices depict the performance of various ML algorithms.
The elements in the figure labeled A to F correspond to LSTM, CNN, LR, SVM, MLP, and NB, respectively. The diagonal elements represent TP values, showcasing each algorithm’s accuracy in correctly identifying positive instances. This is noteworthy on a test sample containing 180 instances.
Fig 3
Fig 3. ROC curve for each ML algorithm.
The elements in the figure labeled A to F correspond to LSTM, CNN, LR, SVM, MLP, and NB, respectively. The dashed pink line represents the random choice classifier, the purple line the micro-average ROC curve, the gray line the macro-average ROC curve, the turquoise line the ROC curve referring to the TD class, the orange line the ROC curve referring to the ADHD class, and the green line the ROC curve referring to the ASD class.
Fig 4
Fig 4. Investigation of potential biases arising from variations in data acquisition protocols.
Comparing the TD groups from different datasets results in all metric performance standing around 0.50 in a random classifier, proving that we could mitigate potential biases from variations in data acquisition protocols with our preprocessing.
Fig 5
Fig 5. RFE and the learning curve for the SVM model are depicted in (A) and (B), respectively.
The best performance is achieved with a total of 310 characteristics, as shown by (A). In (B), the learning curve is presented for the training Accuracy (blue) and test Accuracy (green) using the entire dataset (600 connectivity matrices subjects). The highest performance was achieved with 450 connectivity matrices subjects without requiring the entire dataset. Notably, the connectivity matrices were generated using the data augmentation technique sliding window, and 600 connectivity matrices were used in total in the ML approach before the sampling technique.
Fig 6
Fig 6. Feature importance ranking using the SHAP values methodology for the SVM classifier with brain regions in descending order.
(A) Feature ranking based on the average of absolute SHAP values over all subjects considered. (B) Feature importance ranking regarding ASD class. (C) Feature importance ranking regarding ADHD class.
Fig 7
Fig 7. The most important connections found.
Two-dimensional schematic (ventral-axis), where the most important connection for ADHD and ASD are highlighted in green and blue, respectively. The brain plot was developed by the Braph tool [143], and each region was plotted using a Brodmann map from the Yale BioImage Suite Package.
Fig 8
Fig 8. SVM behavior after insertion of noise.
The mean AUC of the test was obtained with the insertion of noise generated by a normal distribution with 0.1 standard deviation and a 0–1.5 mean range.
Fig 9
Fig 9. Plot for the SVM model with performance measures.
The AUC and Accuracy, in the y-axis, in blue and purple, respectively, were obtained by varying the number of k in the stratified k-fold-cross-validation (x-axis))—the dashed lines corresponding to the test sample and the complete lines to the training sample. Furthermore, the shaded represents the standard deviation in the training sample.
Fig 10
Fig 10. ML results from complex network measures.
(A) The confusion matrix indicates that there were a lot of incorrect predictions between the TD and ADHD groups. (B) The ROC curve, where the dashed pink line represents the random choice classifier, the purple line is the micro-average ROC curve, the gray line is the macro-average ROC curve, the turquoise line the ROC curve referring to the TD class, the orange line the ROC curve referring to the ADHD class (which can be seen the ADHD has the lowest-distinguished curve) and the green line the ROC curve referring to the ASD class (which can be seen the ASD has the best-distinguished curve).
Fig 11
Fig 11. PCA using the complex network measures.
The features for ASD, ADHD, and TD are depicted in red, green, and blue, respectively. In (A), PCA with three components, namely PC1, PC2, and PC3, is illustrated in the plot axis. In (B), PCA with two components, namely PC1 and PC2, is presented in the plot axis; further, the heatmap shows that any of the features were highly correlated with the two components.
Fig 12
Fig 12. Features were statistically significant between all groups when using the t-test with Bonferroni correction.
The orange, pink, and purple boxplots show the features that obtained the most statistically significant differences regarding the classes ADH, ASD, and TD, respectively.
Fig 13
Fig 13. Features were four stars statistically significant, at least between one of the groups, when using the t-test with Bonferroni correction.
The orange, pink, and purple boxplots show the features that obtained the most statistically significant differences regarding the classes ADH, ASD, and TD, respectively.
Fig 14
Fig 14. The t-test with Bonferroni correction for the integrated measures.
The orange, pink, and purple boxplots show the features that obtained the most statistically significant differences regarding the classes ADH, ASD, and TD, respectively.

References

    1. Parenti I, Rabaneda LG, Schoen H, Novarino G. Neurodevelopmental disorders: from genetics to functional pathways. Trends in Neurosciences. 2020;43(8):608–621. doi: 10.1016/j.tins.2020.05.004 - DOI - PubMed
    1. Li Y, Shen M, Stockton ME, Zhao X. Hippocampal deficits in neurodevelopmental disorders. Neurobiology of learning and memory. 2019;165:106945. doi: 10.1016/j.nlm.2018.10.001 - DOI - PMC - PubMed
    1. Mahone EM, Warschausky S, Zabel TA. Introduction to the JINS special issue: Neurodevelopmental disorders. Journal of the International Neuropsychological Society. 2018;24(9):893–895. doi: 10.1017/S1355617718000905 - DOI
    1. Thapar A, Cooper M, Rutter M. Neurodevelopmental disorders. The Lancet Psychiatry. 2017;4(4):339–346. doi: 10.1016/S2215-0366(16)30376-5 - DOI - PubMed
    1. Lord C, Elsabbagh M, Baird G, Veenstra-Vanderweele J. Autism spectrum disorder. The lancet. 2018;392(10146):508–520. doi: 10.1016/S0140-6736(18)31129-2 - DOI - PMC - PubMed

MeSH terms