Midostaurin shapes macroclonal and microclonal evolution of FLT3-mutated acute myeloid leukemia
- PMID: 39418643
- PMCID: PMC11787458
- DOI: 10.1182/bloodadvances.2024014672
Midostaurin shapes macroclonal and microclonal evolution of FLT3-mutated acute myeloid leukemia
Abstract
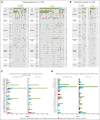
Despite the use of midostaurin (MIDO) with intensive chemotherapy (ICT) as frontline treatment for Fms-like tyrosine kinase 3 (FLT3)-mutated acute myeloid leukemia (AML), complete remission rates are close to 60% to 70%, and relapses occur in >40% of cases. Here, we studied the molecular mechanisms underlying refractory/relapsed (R/R) disease in patients with FLT3-mutated AML. We conducted a retrospective and multicenter study involving 150 patients with R/R AML harboring FLT3-internal tandem duplication (ITD) (n = 130) and/or FLT3-tyrosine kinase domain mutation (n = 26) at diagnosis assessed by standard methods. Patients were treated with ICT + MIDO (n = 54) or ICT alone (n = 96) according to the diagnosis date and label of MIDO. The evolution of FLT3 clones and comutations was analyzed in paired diagnosis-R/R samples by targeted high-throughput sequencing. Using a dedicated algorithm for FLT3-ITD detection, 189 FLT3-ITD microclones (allelic ratio [AR] of <0.05) and 225 macroclones (AR ≥ 0.05) were detected at both time points. At R/R disease, the rate of FLT3-ITD persistence was lower in patients treated with ICT + MIDO than in patients not receiving MIDO (68% vs 87.5%; P = .011). In patients receiving ICT + MIDO, detection of multiple FLT3-ITD clones was associated with a higher FLT3-ITD persistence rate at R/R disease (multiple clones: 88% vs single clones: 57%; P = .049). If only 24% of FLT3-ITD microclones detected at diagnosis were retained at relapse, 43% became macroclones. Together, these results identify parameters influencing the fitness of FLT3-ITD clones.
© 2024 by The American Society of Hematology. Licensed under Creative Commons Attribution-NonCommercial-NoDerivatives 4.0 International (CC BY-NC-ND 4.0), permitting only noncommercial, nonderivative use with attribution. All other rights reserved.
Conflict of interest statement
Conflict-of-interest disclosure: M.C. reports honoraria from AbbVie, Astellas, Jazz, and Bristol Myers Squibb. R.I. reports honoraria from Astellas and Daichii-Sankyo, and research support from Novartis. S. Bertoli declares a consulting or advisory role with Abbvie, Astellas, Bristol Myers Squibb-Celgene, Jazz Pharmaceuticals and Novartis; and received travel grants from Abbvie and Pfizer. C.R. reports consulting or advisory role with AbbVie, Amgen, Astellas, Bristol Myers Squibb, Boehringer, Jazz Pharmaceuticals, Johnson & Johnson, and Servier; received research funding from AbbVie, Amgen, Astellas, Bristol Myers Squibb, Iqvia, and Jazz Pharmaceuticals; and received support for attending meetings and/or travel from AbbVie, Novartis, and Servier. P.-Y.D. reports honoraria and research support to institution from Novartis, Servier, Bristol Myers Squibb, Astellas, and Daiichi-Sankyo; honoraria from AbbVie, Jazz Pharmaceuticals, and Janssen; and research support to institution from Roche. The remaining authors declare no competing financial interests.
Figures


References
-
- Shallis RM, Wang R, Davidoff A, Ma X, Zeidan AM. Epidemiology of acute myeloid leukemia: recent progress and enduring challenges. Blood Rev. 2019;36:70–87. - PubMed
-
- Döhner H, Wei AH, Appelbaum FR, et al. Diagnosis and management of AML in adults: 2022 recommendations from an international expert panel on behalf of the ELN. Blood. 2022;140(12):1345–1377. - PubMed
-
- Metzeler KH, Herold T, Rothenberg-Thurley M, et al. Spectrum and prognostic relevance of driver gene mutations in acute myeloid leukemia. Blood. 2016;128(5):686–698. - PubMed
Publication types
MeSH terms
Substances
LinkOut - more resources
Full Text Sources
Medical
Research Materials
Miscellaneous

