. 2024 Nov 1;23(11):4962-4972.
doi: 10.1021/acs.jproteome.4c00451. Epub 2024 Oct 17.

Multiomics Studies on Metabolism Changes in Alcohol-Associated Liver Disease

Affiliations

Multiomics Studies on Metabolism Changes in Alcohol-Associated Liver Disease

Liqing He et al. J Proteome Res. .

Abstract

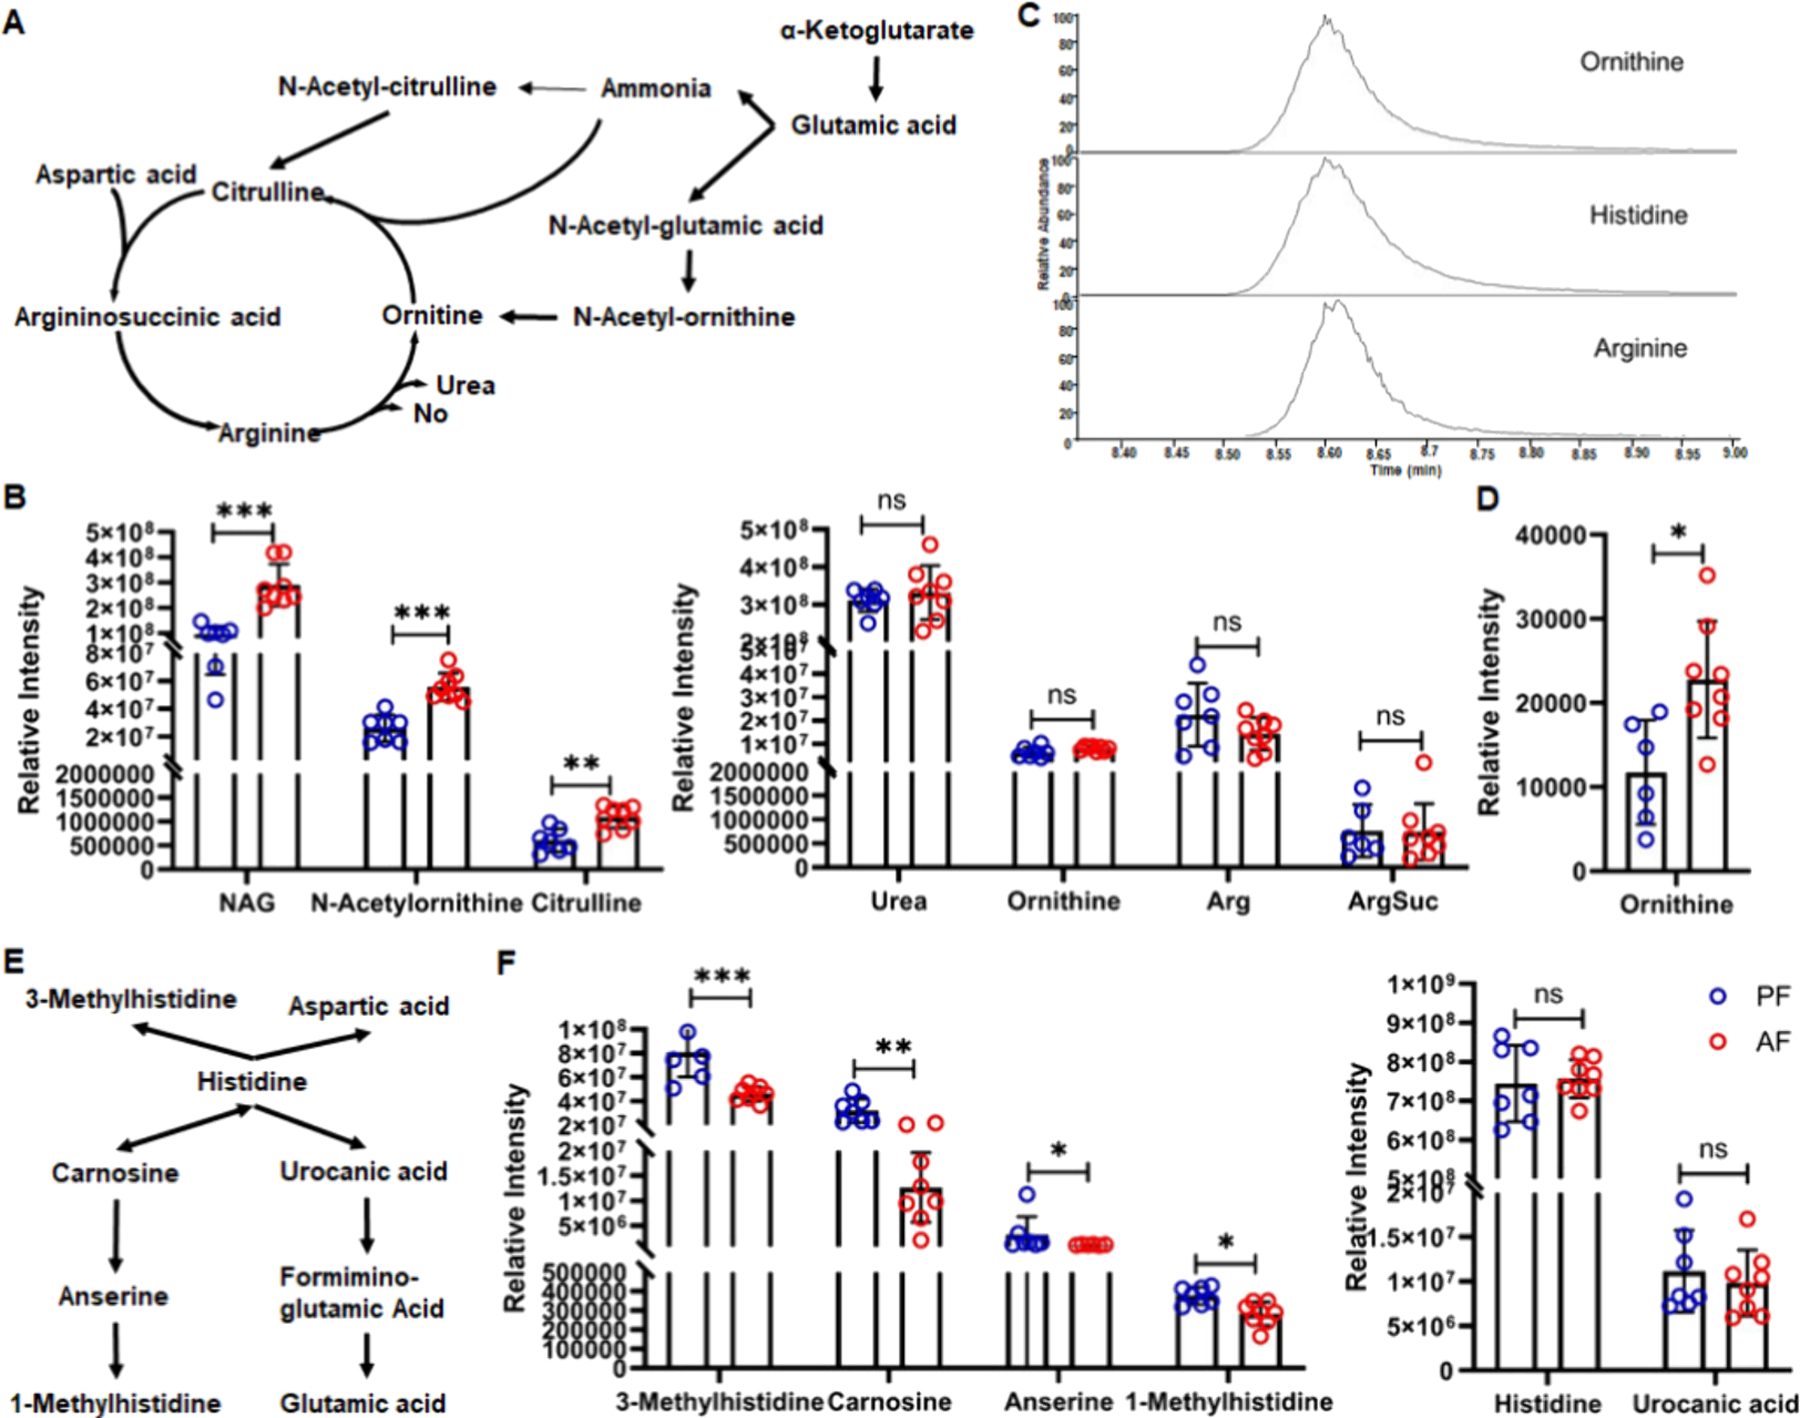
Metabolic dysfunction in the liver represents a predominant feature in the early stages of alcohol-associated liver disease (ALD). However, the mechanisms underlying this are only partially understood. To investigate the metabolic characteristics of the liver in ALD, we did a relative quantification of polar metabolites and lipids in the liver of mice with experimental ALD using untargeted metabolomics and untargeted lipidomics. A total of 99 polar metabolites had significant abundance alterations in the livers of alcohol-fed mice. Pathway analysis revealed that amino acid metabolism was the most affected by alcohol in the mouse liver. Metabolites involved in glycolysis and the TCA cycle were decreased, while glycerol 3-phosphate (G3P) and long-chain fatty acids were increased. Relative quantification of lipids unveiled an upregulation of multiple lipid classes, suggesting that alcohol consumption drives metabolism toward lipid synthesis. Results from enzyme expression and activity detection indicated that the decreased activity of mitochondrial glycerol 3-phosphate dehydrogenase contributed to the disordered metabolism.

Keywords: alcohol-associated liver disease; lipidomics; metabolic dysfunction; metabolomics; mitochondrial glycerol 3-phosphate dehydrogenase.


Conflict of interest statement

The authors declare no competing financial interest.

Figures

Figure 1.
Figure 1.
Metabolic profiling of mouse liver metabolites by parallel 2DLC-MS. All data measured by 2DLC-MS (−) and 2DLC-MS (+) were merged and used as input for PLS-DA analysis. The left is the PLS-DA 3-D score plot, the middle is the performance plot of PLS-DA model, and the right is the loading plot showing the data selection for PLS-DA analysis. AF, alcohol-fed; PF, pair-fed.
Figure 2.
Figure 2.
Alcohol significantly influenced amino acid metabolism in the liver of mice. (A) Pathway analysis using all significantly changed metabolites, the left shows the integrating pathway enrichment and topology analysis result, and the right lists the names of significantly changed pathways. (B) Abundance changes of amino acid detected by parallel 2DLC-MS. (C) Overlapped peaks of glutamic acid, aspartic acid, and G3P were observed in parallel 2DLC-MS data. (D) Abundance change of G3P detected by parallel 2DLC-MS. (E) Abundance changes detected by GC × GC-MS. These three metabolites coeluted from the parallel 2DLC resulting in partially overlapped peaks in 2DLC-MS. Data are expressed as the mean ± SD. AF, alcohol-fed; PF, pair-fed. Statistical analysis using unpaired two-tailed t test, *p < 0.05; **p < 0.01; ***p < 0.001.
Figure 3.
Figure 3.
Alcohol significantly influenced amino acid metabolism in the liver of mice. (A) Arginine biosynthesis pathway. (B) Alterations in the abundance of metabolites involved in the arginine biosynthesis pathway. (C) Three peaks that coeluted in parallel 2DLC-MS. (D) Abundance change of ornithine detected by GC × GC-MS. (E) Histidine pathway. (F) Abundance changes of metabolites involved in the histidine pathway. Data are expressed as mean ± SD. AF, alcohol-fed; PF, pair-fed. Statistical analysis using unpaired two-tailed t test, *p < 0.05; **p < 0.01; ***p < 0.001; ns, no significance. NAG, N-acetyl-glutamic acid; ArgSuc, arginineosuccinic acid.
Figure 4.
Figure 4.
Metabolites in the glycolysis and lipid synthesis pathways were notably varied by alcohol. (A) Glucose metabolism was significantly decreased by alcohol. The abundances of metabolites in glycolysis and the TCA cycle were decreased. (B) The abundances of long-chain fatty acids were increased in the livers of alcohol-fed mice. (C) Total lipids were increased in the livers of alcohol-fed mice. (D) Lipid composition in the liver was varied by alcohol. Data are expressed as mean ± SD. AF, alcohol-fed; PF, pair-fed. Statistical analysis using unpaired two-tailed t test, *p < 0.05; **p < 0.01; ***p < 0.001.
Figure 5.
Figure 5.
Decreased enzyme activity of mGPDH contributes to glucose and lipid metabolism disorder. (A) The direction of metabolism shifts from glucose metabolism to lipid metabolism in the livers of alcohol-fed mice. (B) Enzyme activity assays for mGPDH and cGPDH. The activity for mGPDH was conducted using mitochondria extracted from liver tissue, and cGPDH activity was assessed in mouse liver samples. (C) Western blotting analyses were conducted to assess the protein levels of mGPDH. These analyses were performed using mitochondria extracted from liver tissue samples. (D) The expression of mGPDH was evaluated at the mRNA level in liver tissue samples. Data are expressed as mean ± SD. AF, alcohol-fed; PF, pair-fed. Statistical analysis using unpaired two-tailed t test, *p < 0.05; **p < 0.01; ***p < 0.001; ns, no significance.
Figure 6.
Figure 6.
Metabolism changes of free modified ribonucleosides. Parallel 2DLC-MS data show significant effects of alcohol in the abundance of modified ribonucleosides. Data are expressed as mean ± SD. AF, alcohol-fed; PF, pair-fed. Statistical analysis using unpaired two-tailed t test, *p < 0.05; **p < 0.01; ***p < 0.001. MTA, 5′-methylthioadenosine; m1A, 1-methyladenosine; Cm, 2′-O-methylcytidine; Im, 2′-O-methylinosine.

References

    1. López VRL; Razzeto GS; Escudero NL; Gimenez MS Biochemical and molecular study of the influence of Amaranthus hypochondriacus flour on serum and liver lipids in rats treated with ethanol. Plant Foods Hum. Nutr 2013, 68 (4), 396–402. - PubMed
    1. Zhang A; Yan G; Zhou X; Wang Y; Han Y; Guan Y; Sun H; Wang X High resolution metabolomics technology reveals widespread pathway changes of alcoholic liver disease. Molecular bioSystems 2016, 12 (1), 262–73. - PubMed
    1. Fang H; Zhang AH; Sun H; Yu JB; Wang L; Wang XJ High-throughput metabolomics screen coupled with multivariate statistical analysis identifies therapeutic targets in alcoholic liver disease rats using liquid chromatography-mass spectrometry. Journal of chromatography. B, Analytical technologies in the biomedical and life sciences 2019, 1109, 112–120. - PubMed
    1. Shao T; Zhao C; Li F; Gu Z; Liu L; Zhang L; Wang Y; He L; Liu Y; Liu Q; Chen Y; Donde H; Wang R; Jala VR; Barve S; Chen SY; Zhang X; Chen Y; McClain CJ; Feng W Intestinal HIF-1α deletion exacerbates alcoholic liver disease by inducing intestinal dysbiosis and barrier dysfunction. J. Hepatol 2018, 69 (4), 886–895. - PMC - PubMed
    1. Liu YH; Chen KF; Li FY; Gu ZL; Liu Q; He LQ; Shao T; Song Q; Zhu FX; Zhang LH; Jiang MW; Zhou Y; Barve S; Zhang X; McClain C; Feng WK Probiotic Lactobacillus rhamnosus GG Prevents Liver Fibrosis Through Inhibiting Hepatic Bile Acid Synthesis and Enhancing Bile Acid Excretion in Mice. Hepatology 2020, 71 (6), 2050–2066. - PMC - PubMed

MeSH terms

LinkOut - more resources