

Integrated single-cell transcriptomic analyses identify a novel lineage plasticity-related cancer cell type involved in prostate cancer progression
- PMID: 39418984
- PMCID: PMC11530610
- DOI: 10.1016/j.ebiom.2024.105398
Integrated single-cell transcriptomic analyses identify a novel lineage plasticity-related cancer cell type involved in prostate cancer progression
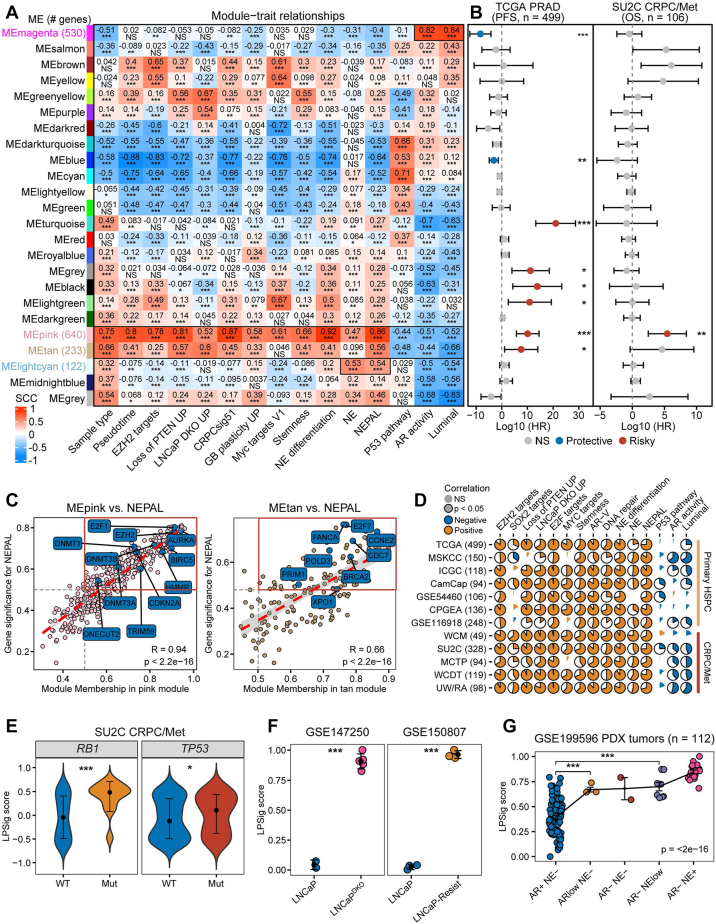
Abstract
Background: Cancer cell plasticity is the ability of neoplastic cells to alter their identity and acquire new biological properties under microenvironmental pressures. In prostate cancer (PCa), lineage plasticity often results in therapy resistance and trans-differentiation to neuroendocrine (NE) lineage. However, identifying the cancer cells harboring lineage plasticity-related status remains challenging.
Methods: Based on 13 multi-center human PCa bulk transcriptomic cohorts (samples = 3314) and 9 bulk transcriptomic datasets derived from PCa experimental models, we established an integrated lineage plasticity-related gene signature, termed LPSig. Leveraging this gene signature, AUCell enrichment analysis was applied to identify the cell population with high lineage plasticity from a comprehensive single-cell RNA-sequencing (scRNA-seq) meta-atlas assembled by us, which consisted of 10 public human PCa scRNA-seq datasets (samples = 93, cells = 222,529). Moreover, additional scRNA-seq dataset of human PCa, multiplex immunohistochemistry staining for human PCa tissues, in vitro and in vivo functional experiments, as well as qPCR and Western blot analyses were employed to validate our findings.
Findings: We found that LPSig could finely capture the dynamics of tumor lineage plasticity throughout the progression of PCa, accurately estimating the status of lineage plasticity. Based on LPSig, we identified a previously undefined minority population of lineage plasticity-related PCa cells (LPCs) from the human PCa scRNA-seq meta-atlas assembled by this study. Furthermore, in-depth dissection revealed pivotal roles of LPCs in trans-differentiation, tumor recurrence, and poor patient survival during PCa progression. Furthermore, we identified HMMR as a representative cell surface marker for LPCs, which was validated using additional scRNA-seq datasets and multiplexed immunohistochemistry. Moreover, HMMR was transcriptionally inhibited by androgen receptor (AR), and was required for the aggressive adenocarcinoma features and NE phenotype.
Interpretation: Our study uncovers a novel population of lineage plasticity-related cells with low AR activity, stemness-like traits, and elevated HMMR expression, that may facilitate poor prognosis in PCa.
Funding: This work was supported by National Key R&D Program of China (2022YFA0807000), National Natural Science Foundation of China (82160584), Advanced Prostate Cancer Diagnosis and Treatment Technology Innovation Team of Kunming Medical University (CXTD202216), and Reserve Talents of Young and Middle-aged Academic Leaders in Yunnan Province (202105AC160013).
Keywords: HMMR; LPCs; Lineage plasticity; Neuroendocrine prostate cancer; Single-cell.
Copyright © 2024 The Author(s). Published by Elsevier B.V. All rights reserved.
Conflict of interest statement
Declaration of interests The authors declare no competing interest.
Figures


References
MeSH terms
Substances
LinkOut - more resources
Full Text Sources
Medical
Research Materials
