. 2024 Nov 7;111(11):2561-2565.
doi: 10.1016/j.ajhg.2024.09.007. Epub 2024 Oct 16.

Inverse relationship between polygenic risk burden and age of onset of autoimmune vitiligo

Affiliations

Inverse relationship between polygenic risk burden and age of onset of autoimmune vitiligo

Genevieve H L Roberts et al. Am J Hum Genet. .

Abstract

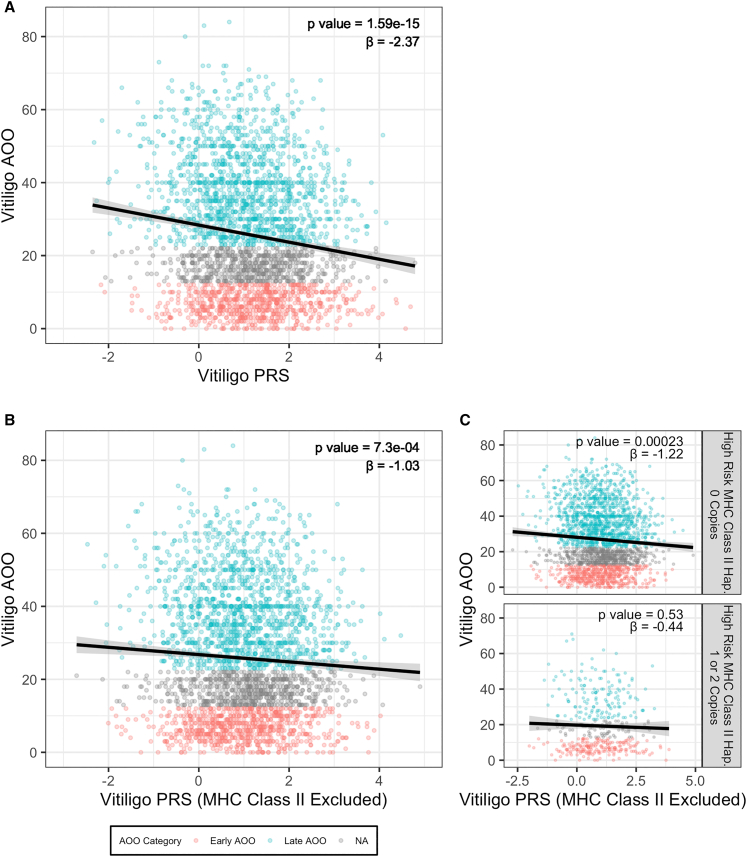
Vitiligo is a common autoimmune disease characterized by patches of depigmented skin and overlying hair due to destruction of melanocytes in the involved regions. We investigated the relationship between vitiligo risk and vitiligo age of onset (AOO) using a vitiligo polygenic risk score that incorporated the most significant SNPs from genome-wide association studies. We find that vitiligo genetic risk and AOO are strongly inversely correlated; subjects with higher common-variant polygenic risk tend to develop vitiligo at an earlier age. Nevertheless, the correlation is not simple. In individuals who carry a single high-risk major histocompatibility complex class II haplotype, the effect of additional polygenic risk on vitiligo AOO is reduced. Particularly among those with early-AOO vitiligo (onset ≤12 years of age), genetic risk can reflect contributions from high common-variant burden but also rare variants of high effect and sometimes both. While the heritability of vitiligo is relatively high, and we here show that genetic risk factors predict vitiligo AOO, vitiligo is never congenital, and thus environmental triggers also play an important role in disease onset.

Keywords: MHC class II; PRS; age of onset; autoimmune diseases; environmental risk factors; heritability; polygenic risk score; vitiligo.


Conflict of interest statement

Declaration of interests The authors declare no competing interests.

Figures

Figure 1
Figure 1
Vitiligo AOO is linearly correlated with the vitiligo PRS In each panel, each point represents one of n = 2,766 unrelated individuals with vitiligo for which we have AOO data. The color of the point represents whether the individual was assigned to the early-AOO group (red), the late-AOO group (blue), or could not be assigned based on the finite mixture model defining the two overlapping distributions. The black line represents the fitted regression line between vitiligo PRS on the x axis and AOO on the y axis. The 95% CI of the regression line slope is represented by the gray area. The p value and slope associated with this regression line are annotated in the upper-right corner of the plot. (A) The full vitiligo PRS is shown on the x axis. (B) The vitiligo PRS after removing the MHC class II variants known to be associated with early AOO, rs145954018, and rs927159711 is shown on the x axis. (C) The stratified relationship between the vitiligo PRS (MHC class II variants removed) and AOO in individuals that have 0 copies of the high-risk MHC class II SNP haplotype (top) and 1 or 2 copies of the high-risk MHC class II haplotype (bottom).
Figure 2
Figure 2
Attenuation of effect sizes across 46 non-MHC vitiligo GWAS risk alleles in early-onset vitiligo vs. late-onset vitiligo Each point represents one of the 46 non-MHC variants identified by GWAS, where the x axis represents the mean bootstrap effect estimate (β) of the risk allele in the late-AOO vitiligo population and the y axis represents the mean bootstrap effect estimate of the risk allele in the early-AOO vitiligo population. The gray bars around each point represent the standard error of each estimate. If the effect estimates were generally the same, these points should fall along the diagonal represented by the black dashed line. The solid black line represents the fitted regression line. The bootstrap p value and slope associated with this regression line are annotated in the upper-right corner of the plot.

References

    1. Picardo M., Taieb A. Springer; Heidelberg, New York: 2019. Vitiligo. - DOI
    1. Roberts G.H.L., Santorico S.A., Spritz R.A. Deep genotype imputation captures virtually all heritability of autoimmune vitiligo. Hum. Mol. Genet. 2020;29:859–863. doi: 10.1093/hmg/ddaa005. - DOI - PMC - PubMed
    1. Roberts G.H.L., Santorico S.A., Spritz R.A. The genetic architecture of vitiligo. Pigment Cell Melanoma Res. 2020;33:8–15. doi: 10.1111/pcmr.12848. - DOI - PMC - PubMed
    1. Spritz R.A., Santorico S.A. The genetic basis of vitiligo. J. Invest. Dermatol. 2021;141:265–273. doi: 10.1016/j.jid.2020.06.004. - DOI - PubMed
    1. Roberts G.H.L., Paul s., Yogov D., Santorico, Spritz R.A. Family clustering of autoimmune vitiligo results principally from polygenic inheritance of common risk alleles. Am. J. Hum. Genet. 2019;105:1–9. doi: 10.1016/j.ajhg.2019.06.013. - DOI - PMC - PubMed