. 2024 Oct 18;15(1):8992.
doi: 10.1038/s41467-024-53334-x.

Early evolutionary branching across spatial domains predisposes to clonal replacement under chemotherapy in neuroblastoma

Affiliations

Early evolutionary branching across spatial domains predisposes to clonal replacement under chemotherapy in neuroblastoma

Jenny Karlsson et al. Nat Commun. .

Abstract

Neuroblastoma (NB) is one of the most lethal childhood cancers due to its propensity to become treatment resistant. By spatial mapping of subclone geographies before and after chemotherapy across 89 tumor regions from 12 NBs, we find that densely packed territories of closely related subclones present at diagnosis are replaced under effective treatment by islands of distantly related survivor subclones, originating from a different most recent ancestor compared to lineages dominating before treatment. Conversely, in tumors that progressed under treatment, ancestors of subclones dominating later in disease are present already at diagnosis. Chemotherapy treated xenografts and cell culture models replicate these two contrasting scenarios and show branching evolution to be a constant feature of proliferating NB cells. Phylogenies based on whole genome sequencing of 505 individual NB cells indicate that a rich repertoire of parallel subclones emerges already with the first oncogenic mutations and lays the foundation for clonal replacement under treatment.


Conflict of interest statement

D.B. has received research funding from Healx, aPODD foundation, and Captor Therapeutics for unrelated work. The other authors declare no competing interests.

Figures

Fig. 1
Fig. 1. Experimental approach and patient cohort.
Evolutionary analysis, illustrated by Patient 12 with multiregional sampling (a) of primary tumor (Pre1-Pre3) and a metastatic relapse (MR), followed by clonal deconvolution (b), construction of a maximum likelihood (ML) phylogeny and subclonal compositions (c); subclones are backtracked to samples to reconstruct their geographical positions (areas of different colors; d). Gains of 7pq and chromosome 15 (both including chromothripsis like [CHL] events) and MAP10 mutation are truncal events, a DOCK2 mutation is confined to MR and a subclonal ARHGAP31 mutation to Pre2. e Sampling strategy before and after treatment. Patient cohort with sampled tumor sites and age at presentation (m, months; f) and the number (n) of spatiotemporal comparisons allowed by the cohort (g).
Fig. 2
Fig. 2. Spatiotemporal evolution of somatic mutations under neuroblastoma treatment.
a ML phylogeny from Patient 4, illustrating collateral clonal replacement during chemotherapy response. Time line, days; R, regression; DOD, dead of disease. The tree is based on CNAs and SNV/indels with n indicating number of samples before treatment (Pre;green), after treatment (Post;red) and at metastatic relapse (MR;blue). Amplification (amp) of MYCN, 17q + , and 1q+ are truncal events (scale bar, one event). Capital letters indicates the same chromosome arm affected by >1 events with different breakpoints. Allelic compositions of 17q gain are denoted by numbers in parenthesis. Gene symbols signify non-synonymous SNVs/indels of likely importance to NB pathogenesis. b ML tree for Patient 8, based on samples from before (Pre;green), during (Post A;red) and after (Post B;purple) chemotherapy. Summary statistics of trees (n = 10) with CNA and SNV/indel data; index of genomic diversity (IGD) (c) with time points on x-axis (horizontal line, median value), total branch length (d) with patient color code above plot and time points on x-axis and irregularity (e) calculated on patients separated based on if a metastatic relapse sample (MR) was present (“yes” or “no” on the x-axis). P values were calculated using the Wilcoxon two sided test. Source data are provided as a Source Data file. ML phylogenies from patients with metastatic relapse (MR, f) or metastatic progression under treatment (MP, g, h), annotated as in (a) (P, local progression; LP, lymph node progression). In Patient 2 (h), parallel evolution of deletions of CDKN2A/CDKN2B with different breakpoints in 9p (ad) are identified in metastases. Red arrows denote linear evolution at progression from ancestral subclones in primary tumors. i Overview across patients P1-P12 of chemotherapy response (%; for details see Supplementary Data 1a), sampling time points, spatial phylogenetic pattern in primary tumors, and temporal evolutionary dynamics. A filled square indicates the presence of a sample or an observation. NT* =Not treated with chemotherapy; up-front surgical removal. **Linear evolution for relapse at metastatic site after non-radical surgery, collateral clonal replacement for primary tumor compared to metastatic relapse.
Fig. 3
Fig. 3. Subclonal evolution under progressive growth in chemotreated neuroblastoma PDXs.
a Genetically identical populations of MYCN-amplified NB PDX cells from a partly cisplatin sensitive tumor (PDX3) were injected in mice to form cohorts of untreated tumors (n = 4) and cisplatin-treated tumors (n = 6). Cisplatin treatment resulted in either stationary (n = 3) or progressive (n = 3) disease. A fourth group of PDXs (n = 4) was first allowed free growth, followed by partial resection and regrowth. Phylogenetic ideogram (b) and subclone composition (c) emerging in PDX3 (a) based on CNA profiles. From each PDX tumor, two biopsies were analyzed, large circles (A and B) in (c), in which each small circle corresponds to 10% of tumor cells. Clonal sweeps are annotated in (b) by “s” followed by the CNA denoting the sweep and in which PDXs it was observed; each CNA is annotated by chromosome number, chromosome arm (q) and structural variant (AC). Evolution follows a pattern of linear radiation from the homogenous STEM population detected in the mother culture (CC, gray demarcation). d Phylogenetic ideogram based on WES of PDX3 tumors (same as in ac), illustrating presence of RAS-MAP kinase pathway mutations (BRAF and MAP34K) in linear radiations from subclones in the culture (CC, gray demarcation). Mother clones are denoted as monochrome circles close to the stem, daughter clones as smaller rings inside the mother clones, and private mutations as black oval shapes (the number corresponds to the number of nonsynonymous mutations). Mutations predicted to be damaging by Polyphen are displayed. e Experimental setup in which PDXs from a MYCN-amplified treatment-resistant NB (PDX1), were allowed either free growth or progressed under high-dose multimodal chemotherapy (rapid COJEC protocol). Phylogenetic ideogram (f) and subclone composition (g) emerging in PDX1 (e) based on CNA profiles, annotated as in (b, c). A similar evolution as in the cisplatin resistant model (ad) is observed, where subclones in emerging PDX tumors, irrespective of whether treated or not, are linear radiations from the main population present in the original cultures (CC1-2, gray demarcations). Details are provided in Supplementary Fig. 2b–g. See Mañas et al. for raw data and experimental setup.
Fig. 4
Fig. 4. Clonal evolution under effective chemotherapy in vivo.
a Experimental setup of neuroblastoma PDX tumors, red arrowheads indicate the time point for sampling and time is given as mean number of days (d) for each cohort consisting of n animals. b Fish plots of clonal evolution in a representative untreated (C1) and treated (T16) PDX tumor, with the upper and lower halves (A and B) representing two regions of the same tumor. Subclones signified by specific sets of CNAs are denoted by color fields, while aberrations in the mother culture are grouped around the stem of the C1 plot. Deletions affecting one gene are denoted by the gene name followed by del, while larger CNAs are denoted by chromosome or chromosome arm (p, q) followed by specification of gain (+), loss (–) or copy number neutral allelic imbalance (cnni). c SNP array plot of the segmental gain (blue highlight) in chromosome 1 that signifies the most commonly expanding clone in both PDX cohorts (1pq + 17q + +), exemplified by its appearance in untreated C1. In T16, this clone did not expand and there was an alternative structural rearrangement of chromosome 1. d The number of differential subclonal, region-private subclonal CNAs, and the total number of CNAs per tumor in rapid COJEC untreated (–) or treated (+) PDXs. P values by Mann–Whitney U test (two-sided) with significance limit adjusted to 0.0055 after Bonferroni correction; ns, not significant. Source data are provided as a Source Data file. e Shift in clonal landscapes between primary treated and relapsed T1, showing how the subclone denoted 7p+ is replaced by a set of other clones detailed in (f). A and B denote sampled tumor regions. f–g Maximum likelihood trees showing CCR between primary treated PDX tumors (T1 and T5) and their relapses (T1R and T5R). CNAs are annotated as in (b), with chromosome segments targeted by further rearrangement marked by colored letters. Roman numerals denote exons in the PTPRD tumor suppressor targeted by sequential deletions. Pies denote the proportion of cells harboring a certain CNA. See Supplementary Fig. 3 for subclonal landscapes of other PDXs.
Fig. 5
Fig. 5. Clonal evolution under chemotherapy treatment in vitro.
a–c (I) Schematic presentation of experimental set ups using cultured IMR-32 cells. All experiments were performed in technical triplicates. CC corresponds to the mother cell culture. A treatment resulting in a substantial decrease in cell numbers is illustrated with smaller circles. The time period in days from the start of the treatments to the collection of the cells is indicated by the arrow to the right in the figure. (II) The clonal landscapes were identified with CNA analyses and illustrated as bar charts. The y-axes correspond to clone sizes. Rectangles denote ancestral clones and triangles denote daughter clones. An asterisk (*) indicates the presence of a clonal sweep. Cultures having transitioned through CCR is indicated by blue arrowheads, with the lost parallel clone denoted by a red arrowhead in CC. a. IMR-32 cells under free growth (cell cultures A1-A3), continuous low dose cisplatin exposure (B1–B3), or a single high dose of cisplatin (C1–C3). b Cells subjected to a single mechanical bottleneck (SB1-3), consisting of restricting cell numbers at passage to a population with the same size as the number of viable cells remaining after the high dose cisplatin treatment. c Cell cultures subjected to multiple mechanical bottlenecks (MB1-3) and multiple high-dose cisplatin treatments (MB cis1-3). Details on clonal landscapes are provided in Supplementary Fig. 4a–d with a summary in Supplementary Fig. 4e.
Fig. 6
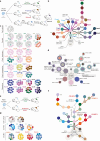
Fig. 6. Subclone territories.
Images of histopathological specimens are combined with phylogenies to map subclone territories before (pre) and after (post) treatment. a–c Microscopy images, gross specimen, subclone phylogeny, and territories from Patient 7. d Phylogeny, ideogram of gross specimen and microscopic image of core needle biopsy from Patient 11. e, f Gross specimen with ideogram and phylogeny from Patient 6. g, h Microscopic images, territories and phylogeny from Patient 8. i–j and k–l corresponding images and ideograms from patients 5 and 3, respectively. The positions of subclone territories in relationship to phylogenetic trees and anatomic maps are linked by broken lines. Differently colored regions represent territories of specific subclones, with sizes (areas) inferred from frequency distributions of clones across biopsies from the same patients. Regions with black borders represent taxa whose precise anatomic locations are ascertained by multiregional sampling while regions without marked borders correspond to taxa whose locations are inferred from a specific cancer cell fraction in a single sample. In the phylogeny of Patient 8 (panel h, lower) clones detected before, under and after chemotherapy are marked by broken line boxes (green, orange and red, respectively). Tumor nodules surrounded by fibrous capsules are enhanced by gray lines in Patient 6 (e). While taxa are tightly variegated without anatomic borders before treatment (c left, d lower, i, k), they are distinctly segregated by necrosis (c right, d right, h, l) or encapsulating fibrosis (e, f) after treatment. Details of metastatic cases are presented in Supplementary Fig. 5.
Fig. 7
Fig. 7. Evolution from ancestral MYCN copy number gain.
a Single cell whole genome sequencing (scWGS) copy number profiles of MYCN-amplified (MNA) neuroblastoma S1 and corresponding patient derived xenograft (PDX) generation 7 (G7). Left, low-resolution whole genome plot (1 Mb binning); right, high-resolution plot (40 kb binning) of the MYCN region. Red type, deviant copy numbers. Single cells _037 (ancestral stage), _21 and _085 show evolution from MYCN gain in absence of copy number alterations (CNAs), to cells with 1p deletion, 17q gain, and MNA (amplicon cassettes A and B; see panel c). Cell G7_012, loss of the amplicon in a PDX subpopulation. b Fluorescence in situ hybridization analysis (S1 biopsy) confirming cells with low-level MNA and normal 17q status (17q N) along with cells showing MNA and 17q gain (17q + ; 51-154 cells scored /tumor). c MYCN region breakpoint clusters (BPC; S1) defines: primordial cell (P) with heterogeneous breakpoints, population Ap with BPC#17 as common breakpoint, amplicon cassette A with BPCs #14 and #17, Ae with evolved variants of A in single cells, and clonal variants B and C defined by BPCs #15 and #16. d scWGS phylogeny of S1 biopsy based on BPCs and CNAs. Early branching (blue circles) results from MYCN diversity, followed by clonal expansion of amplicon A (6 cells; filled green circle), then 1p deletion and 17q gain (1p-/17q + ). e scWGS phylogeny of S1 biopsy, PDXs, and tumor organoids. f, g MYCN copy numbers by scWGS in the S1 biopsy, subdivided by clonal ancestry in biopsy (f, compare d), and origin from biopsy, and corresponding PDXs and tumor organoids (g). Red circles represent median; significance testing by Mann–Whitney U test (two-sided) using Benjamini-Hochberg correction. h scWGS CNA-based clonal dynamics (fish plot) over time in Patient S1 biopsy, and corresponding xenograft (PDX3) and tumor organoids. i scWGS CNA-based clonal dynamics in PDXs and tumor organoids from a different MNA patient (PDX2). j scWGS phylogeny of PDX cells and tumor organoids from a third patient (PDX1). Note aneuploidization at transition from PDX to organoids. Source data are provided as a Source Data file (f, g).

References

    1. Maris, J. M., Hogarty, M. D., Bagatell, R. & Cohn, S. L. Neuroblastoma. Lancet369, 2106–2120 (2007). - PubMed
    1. Morgenstern, D. A. et al. The challenge of defining “ultra-high-risk” neuroblastoma. Pediatr. Blood Cancer66, e27556 (2019). - PubMed
    1. London, W. B. et al. Clinical and biologic features predictive of survival after relapse of neuroblastoma: a report from the International Neuroblastoma Risk Group project. J. Clin. Oncol.29, 3286–3292 (2011). - PMC - PubMed
    1. London, W. B. et al. Historical time to disease progression and progression-free survival in patients with recurrent/refractory neuroblastoma treated in the modern era on Children’s Oncology Group early-phase trials. Cancer123, 4914–4923 (2017). - PMC - PubMed
    1. Zage, P. E. Novel therapies for relapsed and refractory neuroblastoma. Children (Basel)5, 148 (2018). - PMC - PubMed

Publication types

Substances