. 2024 Oct 18;15(1):8988.
doi: 10.1038/s41467-024-53164-x.

The integrated molecular and histological analysis defines subtypes of esophageal squamous cell carcinoma

Affiliations

The integrated molecular and histological analysis defines subtypes of esophageal squamous cell carcinoma

Guozhong Jiang et al. Nat Commun. .

Abstract

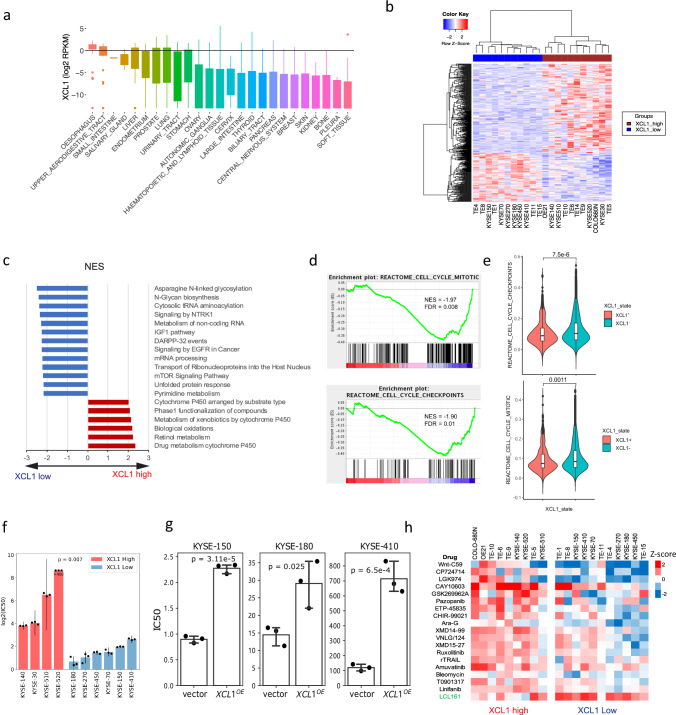
Esophageal squamous cell carcinoma (ESCC) is highly heterogeneous. Our understanding of full molecular and immune landscape of ESCC remains limited, hindering the development of personalised therapeutic strategies. To address this, we perform genomic-transcriptomic characterizations and AI-aided histopathological image analysis of 120 Chinese ESCC patients. Here we show that ESCC can be categorized into differentiated, metabolic, immunogenic and stemness subtypes based on bulk and single-cell RNA-seq, each exhibiting specific molecular and histopathological features based on an amalgamated deep-learning model. The stemness subgroup with signature genes, such as WFDC2, SFRP1, LGR6 and VWA2, has the poorest prognosis and is associated with downregulated immune activities, a high frequency of EP300 mutation/activation, functional mutation enrichment in Wnt signalling and the highest level of intratumoural heterogeneity. The immune profiling by transcriptomics and immunohistochemistry reveals ESCC cells overexpress natural killer cell markers XCL1 and CD160 as immune evasion. Strikingly, XCL1 expression also affects the sensitivity of ESCC cells to common chemotherapy drugs. This study opens avenues for ESCC treatment and provides a valuable public resource to better understand ESCC.


Conflict of interest statement

The authors declare no competing interests.

Figures

Fig. 1
Fig. 1. Transcriptomic subtypes of Chinese ESCC.
a Four distinct transcriptomic subtypes were identified using non-negative matrix factorisation (NMF). The expression heatmap of all representative genes from the four clusters is displayed, and the top five representative genes are shown next to each cluster. Each row represents a representative gene, and each column represents a patient. b Heatmap of top enriched pathways for each subtype is shown. Each row represents a significant pathway curated from the mSigDB database (v.6.2). Four subtypes are shown in the column. The ‘−log10’ transformed p-values from the hypergeometric test were used to generate this heatmap. Red indicates that the pathway is highly enriched for the gene set. Blue indicates that no enrichment was observed for the gene set. For the stemness subtype, results of three mostly downregulated pathways, ‘interferon gamma signalling’, ‘TCR pathway’ and ‘chemokine signalling pathway’ from GSEA are shown. Normalised enrichment scores (NES) and FDR values are also displayed. c Representative histopathology images for the four subtypes are shown. A deep-learning model was developed to extract and compare subtype-specific histological features based on histology slides. The high-magnification pictures were shown with arrows indicating their locations in the slides in the right panel. These features clearly discriminate the molecular subtypes. d A Kaplan–Meier curve is shown comparing patients from the four subtypes with a log-rank p-value calculated. e A Kaplan–Meier curve is shown for patient samples with high and low stemness signatures in an independent cohort (n = 63). The stemness signature was measured as the average expression readout of four genes, LGR6, VWA2, WFDC1 and SFRP1, by RT-PCR. The patients were split into high and low groups based on an optimal cut-off with R survminer package (see Methods). For all survival curves, significance was determined using a two-sided log-rank test. f The effect of SFRP1 overexpression (in KYSE-70, n = 6) or knock-down (in KYSE-520, n = 6) on the tumour growth of ESCC was evaluated by the tumour growth of SFRP1-modified ESCC cells in immune-deficient mice. All mice in the overexpression group developed tumours, while two mice in the knockdown group had no tumour formation. The tumour size is presented at the end time point of the study (30 days after transplantation of the ESCC cells). The box bounds the interquartile range divided by the median, with the whiskers extending to the min and max values. Significance was determined using a two-sided Wilcoxon test. Source data are provided as a Source Data file.
Fig. 2
Fig. 2. Heterogeneity of immune cell infiltration in ESCC.
a The immune cell infiltration profiling across our cohort is shown, clustered by the level of estimated immune cell infiltration. Each row represents an immune cell type as estimated by the method used by Danaher et al. Immune cells are natural killer (NK) cells, neutrophils, B cells, macrophages, CD4+ mature cells, regulatory T cells (Treg), CD56dim NK cells, total T cells (T cells), CD8+ T cells, cytotoxic cells, exhausted CD8+ T cells (exhausted CD8), dendritic cells (DC) and mast cells. Consensus clustering was performed. Each column represents a patient sample. Three immune infiltration clusters were identified: C1, C2 and C3. b Levels of gene expression of XCL1 and XCL2 for n = 120 samples are shown among the three immune subtypes as a box and whisker plot. Significance in each pairwise comparison is shown using the two-sided Wilcoxon rank-sum test. c IHC analysis revealed that the C2 immune subtype had significantly increased levels of CD8 (67 samples) and CD56 (75 samples) expression. Significance was determined using a two-sided Wilcoxon test; *p < 0.05, ***p < 0.001. d The survival analysis of all profiled immune cell types against overall survival for 102 samples is shown. The hazard ratio (HR) derived from the multivariate Cox regression model is shown as a whisker plot. The blue square indicates the HR value, and the error bars represent 95% confidence intervals. Significance is determined using a two-sided log-rank test (■ p < 0.1; * p < 0.05). e A Kaplan–Meier curve is shown for NK cell estimates against overall survival for our cohort (China, 102 samples) and TCGA (90 samples). Multivariant survival analysis was performed for the China cohort. HR and p-value derived from the log-rank test are shown. f The number of cases of the four transcriptomic subtypes is shown among the three immune subtypes C1, C2 and C3. Fisher´s exact test was used to test if there is any difference in the proportion of transcriptomic subtypes between different immune subtypes (**** p < 0.0001). g The scatter plot of expression levels between LGR6 and three NK cell markers, XCL1, XCL2 and CD160, is shown. Two-sided Pearson’s correlation coefficient and associated p-value are displayed. h IHC (Immunohistochemistry) staining of XCL1 and LGR6 from one patient, Sample 427, and IHC of CD160 and LGR6 from a different patient, Sample 341, are shown. The IHC results show that XCL1 and LGR6, CD160 and LGR6 are co-expressed in tumour cells. Furthermore, to provide a more comprehensive understanding of our findings, we included a larger visualisation of IHC results depicting CD160, LGR6, XCL1, and CD56 in both normal control and tumour samples for Sample 333 in Supplementary Fig. 11a. In b, c, the box bounds the interquartile range divided by the median, with the whiskers extending to a maximum of 1.5 times the interquartile range beyond the box. Source data are provided as a Source Data file.
Fig. 3
Fig. 3. Characteristics of XCL1-high ESCC cells.
a The expression of XCL1 across all 1,019 profiled cell lines in the Cancer Cell Line Encyclopaedia (CCLE) is shown. The expression was measured in log2 transformed RPKM. The whiskers extend to a maximum of 1.5 times the interquartile range beyond the box. b The heatmap of significantly differentially expressed genes between ESCC cells of XCL1 high and low groups is shown. c The top upregulated and downregulated pathways (GSEA) derived from the XCL1 high and low differential expression analysis is shown. The pathways were sorted based on the normalised enrichment score (NES). d The cell cycle gene sets were downregulated in XCL1-high cells compared to XCL1-low cells based on GSEA of RNA-seq data. e The violin plots depict the distribution of cell cycle gene set enrichment levels between 515 XCL1-positive cells and 32,944 XCL1-negative cells obtained from single-cell data collected by Zhang et al.. The levels of cell cycle activity were compared between these two groups using Wilcoxon rank-sum test (**P < 0.01, ****P < 0.0001). The inset box bounds the interquartile range divided by the median, with the whiskers extending to a maximum of 1.5 times the interquartile range beyond the box. f The cytotoxicity of 5-FU in a panel of human ESCC cell lines is shown. The cells are divided into XCL1 high (red) and low (blue) groups based on the CCLE separation. For each cell line we conducted three repeated experiments to determine the IC50, here log2 transformed mean IC50 scores and standard deviation are shown, the P value was calculated using two-sided Mann Whitney test. g The mean IC50 value of 5-FU and their standard deviation derived from three repeat experiments between control and XCL1 overexpressing cells of KYSE-150 (P = 3.11e−5), KYSE-180 (P = 6.5e−4) and KYSE-410 (P = 0.025) is shown. The IC50 difference was compared using a two-sided t-test. h The drug screening profiling between ESCC XCL1-high and low cells is shown, based on data generated by the Genomics of Drug Sensitivity in Cancer (GDSC) resource. The drugs that show significant differences in IC50 (Student’s t-test, P < 0.05) between the two groups are selected. High and low levels of resistance are indicated in red and blue, respectively. Source data are provided as a Source Data file.
Fig. 4
Fig. 4. The landscape of genomic alterations in ESCC.
a The genomic landscape of ESCC driver genes and previously reported ESCC subtype-specific genes is shown among four transcriptomic subtypes in our cohort. ESCC1/2/3 denotes the ESCC subtypes identified by the TCGA 2017 EC study. Additional significant genes reported from previous large Chinese ESCC cohort studies were also included. For copy number aberrations, only amplifications and deletions were included. Cases of copy gain or loss were not counted. b The genomic landscape of significant ESCC genes across XCL1-high and low ESCC cell lines. c The overall survival of EP300-mutated (Mut) versus wildtype (Wt) cases. d The overall survival of EP300 and/or CREBBP mutated (Mut) versus wildtype (Wt) samples. e The EP300 gene expression levels for 102 samples were compared between EP300-mutated and wild-type samples using the Wilcoxon rank sum test to assess the significance of expression differences between groups. (**P < 0.01). Two cases with amplification or deletion only were excluded. The box bounds the interquartile range divided by the median, with the whiskers extending to a maximum of 1.5 times the interquartile range beyond the box. f Reference and alternative allele counts and percentages between DNA WES and RNA-seq for three EP300-mutated cases, 369, 390 and 463, with missense and splice site mutations. Fisher’s exact test was performed to determine the allelic imbalance between DNA and RNA, *P < 0.05, ***P < 0.001. Source data are provided as a Source Data file.
Fig. 5
Fig. 5. EP300 mutations, overexpression in ESCC and pathway functional mutation enrichment.
a GSEA normalised enrichment score (NES) of EP300 Mut (mutated) versus Wt (wildtype) samples (green bars) and EP300 high versus low expression samples (red bars), against representative (upregulated) gene sets of four transcriptomic subtypes and upregulated genes in XCL-high ESCC cell lines (XCL_up). The values of FDR were shown within the bars. b GSEA plots of ‘stemness_up’ and ‘differentiated_up’ gene sets for the EP300 Mut (mutated) versus Wt (wildtype) comparison, and the ‘stemness_up’ and ‘XCL1_up’ gene sets for the EP300 high versus low-expression comparison. FDR q-values were shown. c Gene expression of CD160 between EP300 mutated and wildtype samples. Wilcoxon rank-sum test was used to compare the level between groups. d Pathway functional mutation enrichment adjusted for tumour mutation burden and the correlation between functional mutation enrichment ratio and tumour cellularity are plotted together for each hallmark gene set. P-values derived from the Kruskal–Wallis test comparing the enrichment ratio among the four subtypes were used for y-axis values. For significant hallmark gene sets, they were coloured to represent the subtype which had the highest enrichment for this gene set. e Significance P-values (−log10 transformed) comparing the enrichment scores among the four subtypes against P-values comparing GSVA values among the four subgroups are plotted for each hallmark gene set. For significant hallmark gene sets that passed both significance thresholds (P < 0.05), they were coloured to represent the subtype which had the highest enrichment for that gene set in both functional mutation and pathway expression levels. f The intra-tumour heterogeneity for 102 samples, measured as the Shannon density, is shown across the four transcriptomic and immune subtypes, using the Wilcoxon rank-sum test. g The survival analysis of the Shannon density index against overall survival is shown using a multivariate analysis. The P-value derived from the log-rank test was shown, along with the hazard ratio and 95% confidence interval. All significance is shown in the figure, *P < 0.05, **P < 0.01, and ****P < 0.0001. In c, f, the box bounds the interquartile range divided by the median, with the whiskers extending to a maximum of 1.5 times the interquartile range beyond the box. Source data are provided as a Source Data file.

References

    1. Bray, F. et al. Global cancer statistics 2018: GLOBOCAN estimates of incidence and mortality worldwide for 36 cancers in 185 countries. CA Cancer J. Clin.68, 394–424 (2018). - PubMed
    1. Malhotra, G. K. et al. Global trends in esophageal cancer. J. Surg. Oncol.115, 564–579 (2017). - PubMed
    1. Abnet, C. C., Arnold, M. & Wei, W. Q. Epidemiology of esophageal squamous cell carcinoma. Gastroenterology154, 360–373 (2018). - PMC - PubMed
    1. Smyth, E. C. et al. Oesophageal cancer. Nat. Rev. Dis. Prim.3, 17048 (2017). - PMC - PubMed
    1. Cui, Y. et al. Whole-genome sequencing of 508 patients identifies key molecular features associated with poor prognosis in esophageal squamous cell carcinoma. Cell Res30, 902–913 (2020). - PMC - PubMed

Publication types

MeSH terms