. 2024 Oct 17;15(1):8557.
doi: 10.1038/s41467-024-52569-y.

SUMOylation of Warts kinase promotes neural stem cell reactivation

Affiliations

SUMOylation of Warts kinase promotes neural stem cell reactivation

Yang Gao et al. Nat Commun. .

Abstract

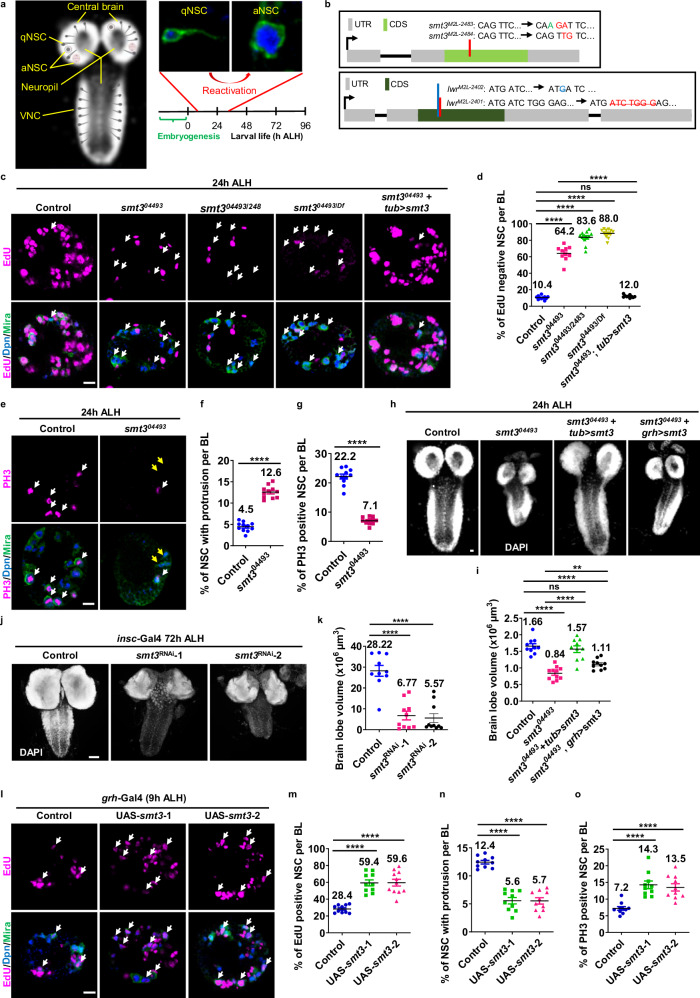
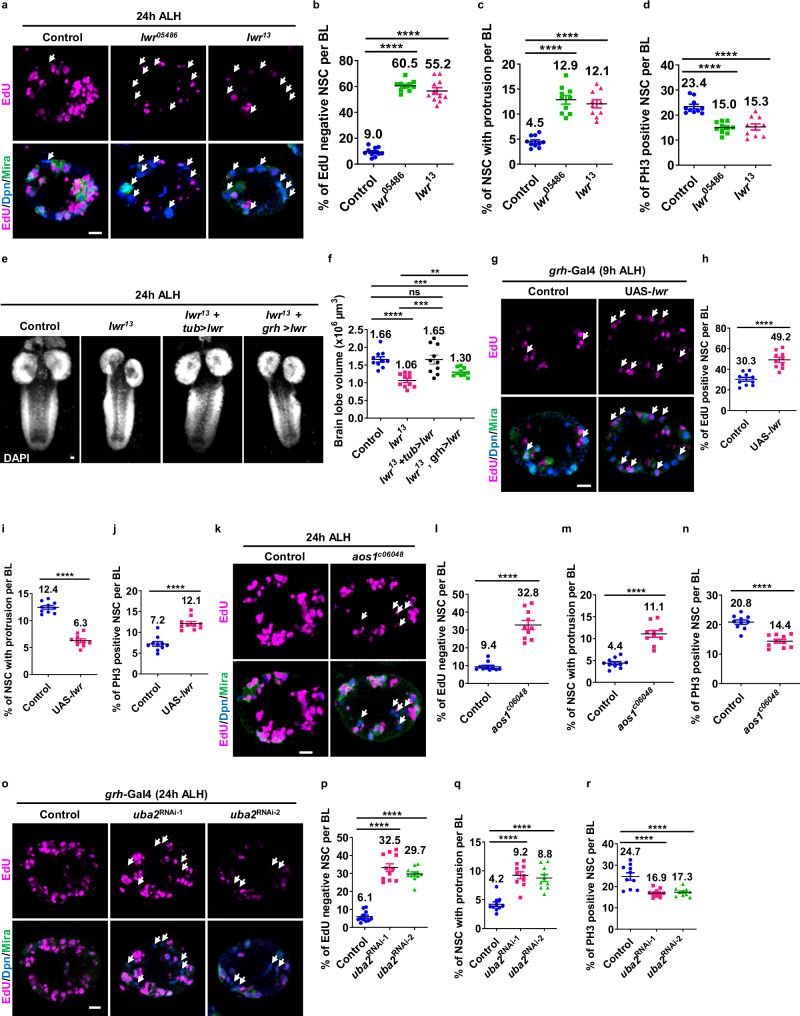
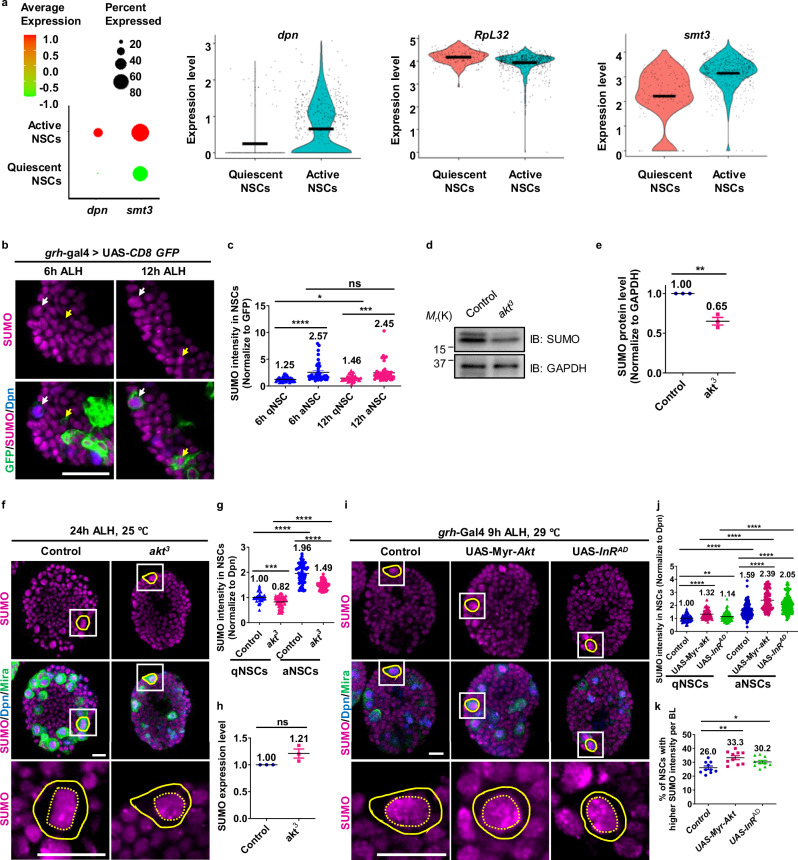
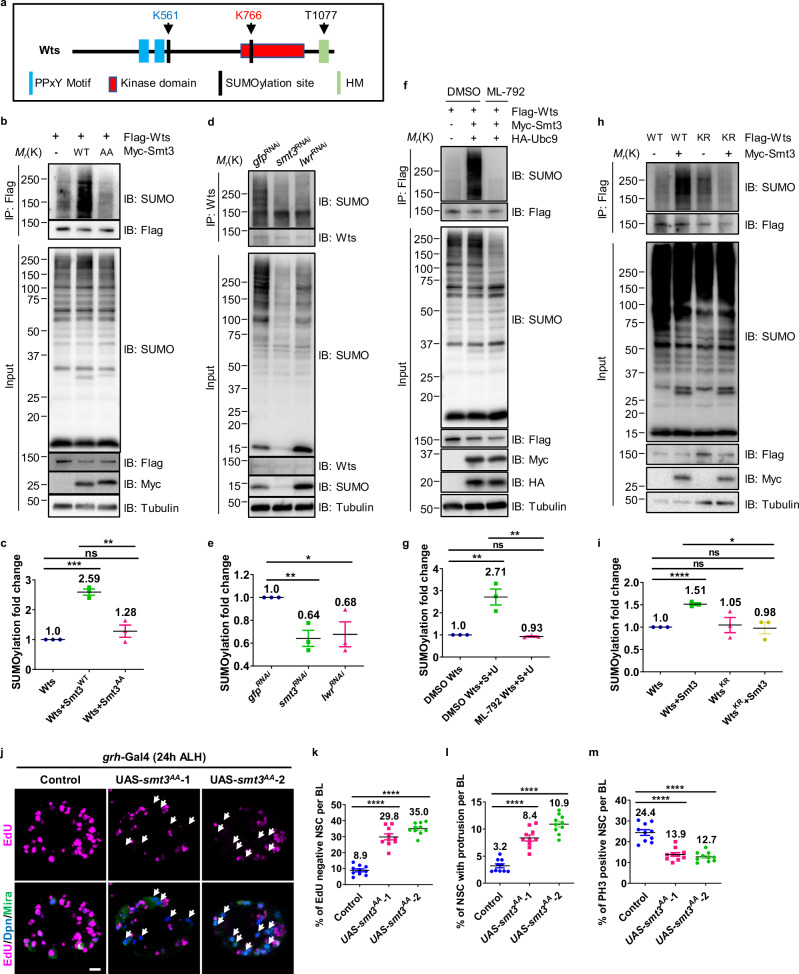
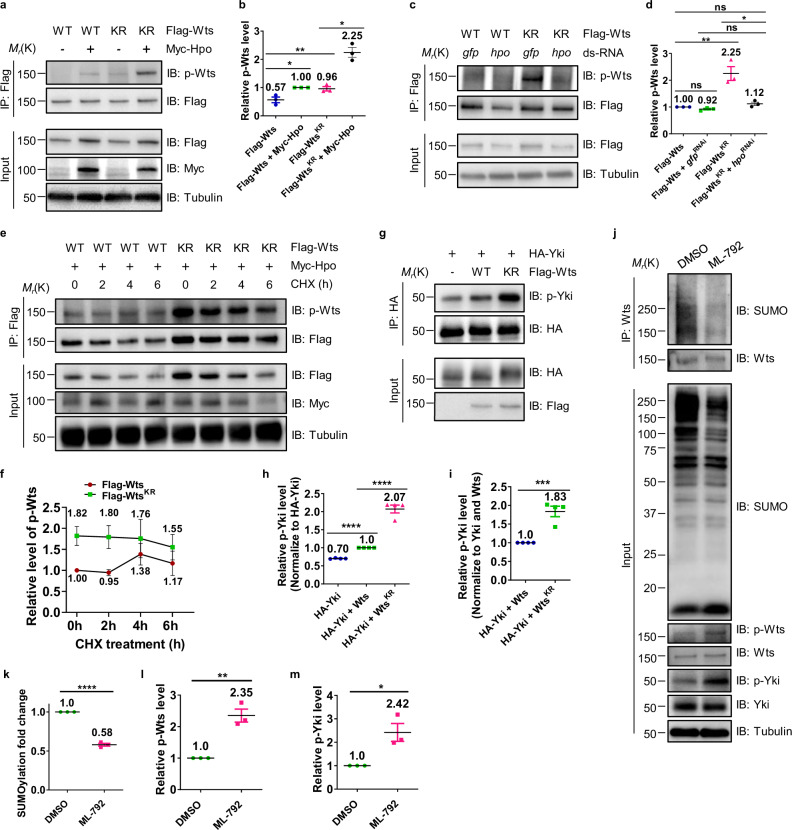
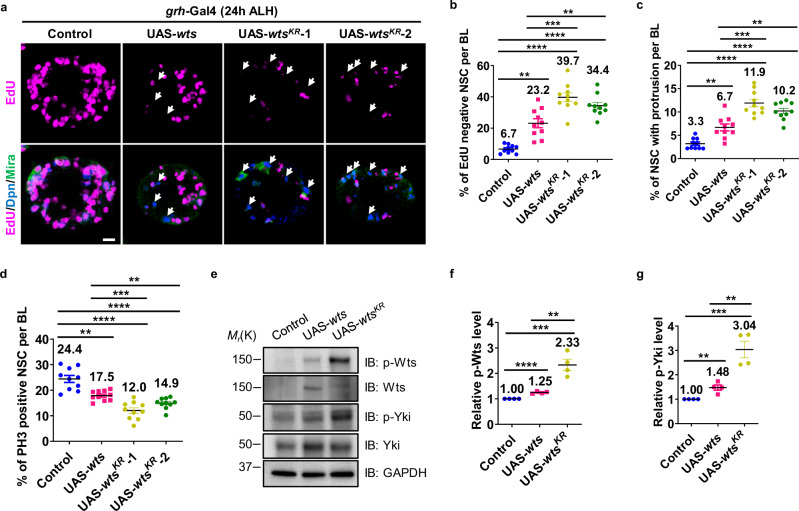
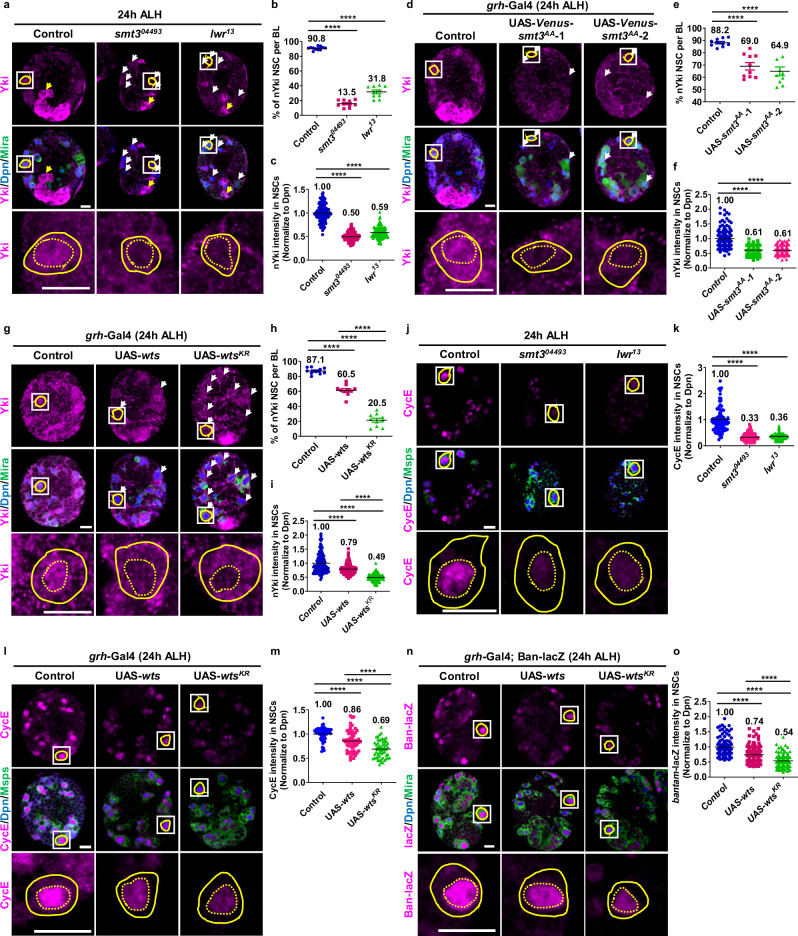
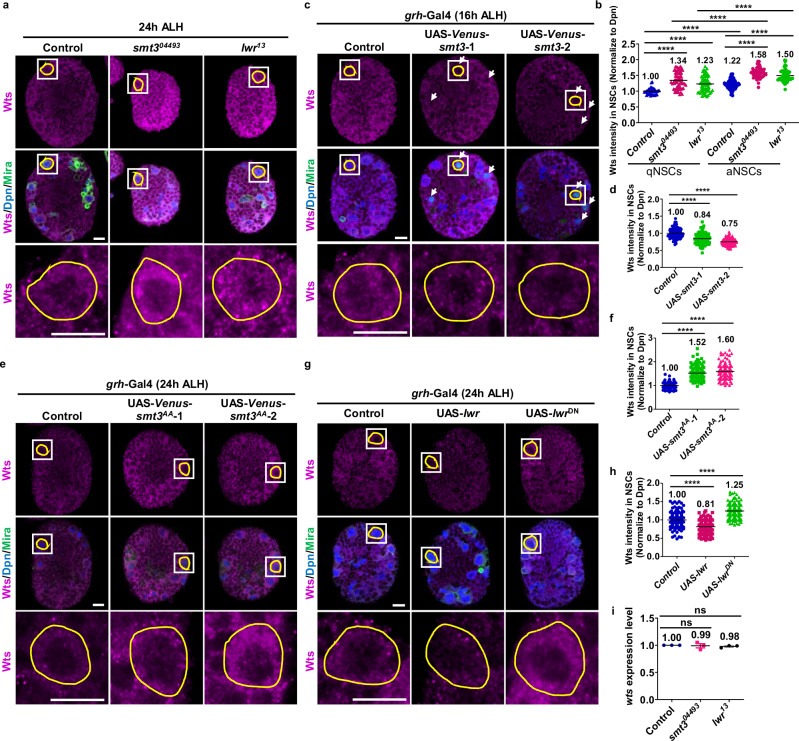
A delicate balance between neural stem cell (NSC) quiescence and proliferation is important for adult neurogenesis and homeostasis. Small ubiquitin-related modifier (SUMO)-dependent post-translational modifications cause rapid and reversible changes in protein functions. However, the role of the SUMO pathway during NSC reactivation and brain development is not established. Here, we show that the key components of the SUMO pathway play an important role in NSC reactivation and brain development in Drosophila. Depletion of SUMO/Smt3 or SUMO conjugating enzyme Ubc9 results in notable defects in NSC reactivation and brain development, while their overexpression leads to premature NSC reactivation. Smt3 protein levels increase with NSC reactivation, which is promoted by the Ser/Thr kinase Akt. Warts/Lats, the core protein kinase of the Hippo pathway, can undergo SUMO- and Ubc9-dependent SUMOylation at Lys766. This modification attenuates Wts phosphorylation by Hippo, leading to the inhibition of the Hippo pathway, and consequently, initiation of NSC reactivation. Moreover, inhibiting Hippo pathway effectively restores the NSC reactivation defects induced by SUMO pathway inhibition. Overall, our study uncovered an important role for the SUMO-Hippo pathway during Drosophila NSC reactivation and brain development.


Conflict of interest statement

The authors declare no competing interests.

Figures

Fig. 1
Fig. 1. Smt3, the single SUMO protein in Drosophila, is required for NSC reactivation and brain development.
a Diagrammatic representation of Drosophila brain and quiescent NSC reactivation time line. aNSC: active NSC, qNSC: quiescent NSC. b Diagram of CRISPR-Cas9 mediated gene deletion mutants on smt3 and lwr. c Larval brain lobes from control (yw), smt304493, smt304493/smt3M2L-2483, smt304493/smt3Df24652 and smt304493+tub>smt3 were analyzed for EdU incorporation. NSCs were marked by Dpn and Mira. White arrows point to EdU- qNSCs. d Quantification of EdU- NSCs per brain lobe (BL) for (c). Control, 10.4 ± 2.2, n = 11; smt304493, 64.2 ± 8.9, P = 5.6E-14, n = 10; smt304493/smt3M2L-2483, 83.6 ± 7.7, P = 8.9E-09, n = 12; smt304493/smt3Df24652, 88 ± 5.2, P = 2.6E-10, n = 12; smt304493 + tub>smt3, 12 ± 1.6, p = 0.07, P = 5.0E-13, n = 10. e Larval brain lobes from control (yw) and smt304493 were labeled with Dpn, PH3 and Mira. White arrows point to PH3+ NSCs, yellow arrows point to qNSCs with protrusion. f Quantification of NSCs retaining cellular protrusion per BL for (e). Control, 4.5 ± 1.1, n = 11; smt304493, 12.6 ± 1.4, P = 8.5E-14, n = 11. g Quantification of PH3+ NSCs per BL for (e). Control, 22.2 ± 2.7, P = 3.5E-13, n = 11; smt304493, 7.1 ± 1.2, n = 11. h Maximum intensity z-projection of larval brains from control (yw), smt304493, smt304493+tub>smt3, and smt304493+grh>smt3 were stained with DAPI. i Quantification of brain volume in (h). Control, 1.66 ± 0.23, n = 10; smt304493, 0.84 ± 0.19, P = 4.4E-08, n = 11; smt304493+tub>smt3, 1.57 ± 0.32, P = 0.48, n = 10; smt304493+grh>smt3, 1.11 ± 0.15, P = 8.3E-06, n = 10. j Larval brain lobes in control (β-galRNAi) and smt3RNAi lines driven by insc-Gal4 were stained with DAPI. k Quantification of brain volume in (j). Control, 28.22 ± 8.2, n = 10; smt3RNAi-1, 6.77 ± 6.6, P = 2.5E-06, n = 10; smt3RNAi-2, 5.57 ± 6.7, P = 4.6E-06, n = 11. l Larval brain lobes in control (β-galRNAi) and two UAS-venus-smt3 lines driven by grh-Gal4 were analyzed for EdU incorporation. White arrows point to EdU+ NSCs. m Quantification of EdU+ NSCs per BL in (j). Control, 28.4 ± 4.6, n = 10; UAS-venus-smt3-1, 59.4 ± 11.3, P = 2.3E-07, n = 10; venus-smt3-2, 59.6 ± 13.3, P = 1.0E-06, n = 11. n Quantification of NSCs retaining cellular protrusion per BL in (j). Control, 12.4 ± 1, n = 10; UAS-venus-smt3-1, 5.6 ± 1.8, P = 4.0E-09, n = 10; venus-smt3-2, 5.7 ± 2, P = 2.3E-08, n = 10. o Quantification of PH3+ NSCs per BL in (j). Control, 7.2 ± 1.7, n = 10; UAS-venus-smt3-1, 14.3 ± 3.6, P = 2.9E-05n = 10; venus-smt3-2, 13.5 ± 3.5, P = 7.0E-05, n = 10. Data are presented as mean ± SD. **** for P ≤ 0.0001, ns for P > 0.05. Scale bars are 10 μm except in (j), which is 50 μm.
Fig. 2
Fig. 2. SUMO E2 and E1 are required for NSC reactivation.
a, k, o At 24 h ALH, larval brain lobes from various genotypes were analyzed for EdU incorporation. NSCs were marked by Dpn and Mira. White arrows point to EdU- qNSCs. b Quantification of EdU- NSCs per BL for (a). Control (yw), 9 ± 3.3, n = 11; lwr05486, 60.5 ± 4.2, P = 8.1E-18, n = 10; lwr13, 55.2 ± 8.5, P = 1.9E-13, n = 11. c Quantification for percentage of NSCs retaining cellular protrusion per BL for (a). Control, 4.5 ± 1.1, n = 10; lwr05486, 12.9 ± 2.7, P = 4.2E-08, n = 10; lwr13, 12.1 ± 1.6, P = 9.6E-08, n = 10. d Quantification of PH3+ NSCs per BL for (a). Control, 23.4 ± 3, n = 10; lwr05486, 15 ± 2.2, P = 1.1E-06, n = 10; lwr13, 15.3 ± 3.8, P = 5.1E-05, n = 10. e Maximum intensity z-projection of larval brains from control (yw), lwr13, lwr13+tub>lwr and lwr13+grh>lwr were stained with DAPI. f Quantification of brain volume for (e). Control, 1.66 ± 0.23, n = 10; lwr13, 1.06 ± 0.19, P = 6.9E-06, n = 10; lwr13+tub>lwr, 1.65 ± 0.4, P = 0.98, P = 0.0005, n = 10 BL; lwr13+grh>lwr, 1.3 ± 0.12, P = 0.0004, P = 0.0038, n = 10. g At 9 h ALH, larval brain lobes in control (β-galRNAi) and UAS-lwr line driven by grh-Gal4 were analyzed for EdU incorporation. White arrows point to EdU+ NSCs. h Quantification of EdU+ NSCs per BL for (g). Control, 30.3 ± 6, n = 10; UAS-lwr, 49.2 ± 8, P = 2.6E-05, n = 10. i Quantification of NSCs retaining cellular protrusion per BL for (g). Control, 12.4 ± 1, n = 10; UAS-lwr, 6.3 ± 1.1, P = 1.4E-10, n = 10. (j Quantification of PH3+ NSCs per BL for (g). Control, 7.2 ± 1.7, n = 10; UAS-lwr, 12.1 ± 1.5, P = 2.9E-06, n = 10. l Quantification of EdU- NSCs per BL for (k). Control (yw), 9.4 ± 2.5, n = 10 BL; aos1c06048, 32.8 ± 8, P = 6.2E-08, n = 10. m Quantification of NSCs retaining cellular protrusion per BL for (k). Control, 4.4 ± 1.1, n = 10; aos1c06048, 11.1 ± 2.4, P = 2.7E-07, n = 10. n Quantification of PH3+ NSCs per BL for (k). Control, 20.8 ± 2.3, n = 10; aos1c06048, 14.4 ± 2, P = 3.5E-06, n = 10. p Quantification of EdU- NSCs per BL for (o). Control (β-galRNAi), 6.1 ± 3, n = 11; uba2RNAi-1, 32.5 ± 7.1, P = 2.1E-10, n = 11; uba2RNAi-2, 29.7 ± 3.8, P = 5.7E-13, n = 11. q Quantification of NSCs retaining cellular protrusion per BL for (o). Control, 4.2 ± 1.3, n = 10; uba2RNAi-1, 9.2 ± 1.9, P = 2.1E-06, n = 10; uba2RNAi-2, 8.8 ± 2, P = 8.4E-06, n = 10. r Quantification of PH3+ NSCs per BL for (o). Control, 24.7 ± 5.4, n = 10; uba2RNAi-1, 16.9 ± 1.8, P = 0.0004, n = 10; uba2RNAi-2, 17.3 ± 1.9, P = 0.0007, n = 10. Data are presented as mean ± SD. **** for P ≤ 0.0001, *** for P ≤ 0.001, ns indicates p > 0.05. Scale bars: 10 μm.
Fig. 3
Fig. 3. Akt stabilizes SUMO protein level during NSC reactivation.
a Analysis of smt3 and dpn mRNA expression in qNSCs and aNSCs from the dataset of single-cell RNA seq. RpL32 works as a house keeping gene. b Larval brains expressing mCD8-GFP driven by grh-GAL4. White arrows point to aNSCs. Yellow arrows point to qNSCs. c Quantification of SUMO intensity (normalized to GFP) at 6 h ALH for (b) in aNSCs (big Dpn+ cells) (2.57 ± 1.79, P = 4.4E-06, n = 10) and qNSCs (Dpn+ cells with protrusion) (1.25 ± 0.42, n = 10), at 12 h ALH in aNSCs (2.45 ± 1.66, P = 0.0003, P = 0.75, n = 10) and qNSCs (1.46 ± 0.57, P = 0.041, n = 10). d Fly brains from yw control and akt3 at 24 h ALH were dissected to extract proteins for western blot. e Quantification of relative SUMO protein levels in (d), n = 3. Control, 1; akt3, 0.65 ± 0.08, P = 0.002. At 24 h ALH (f) and 9 h ALH (i), larval brain lobes were labeled with SUMO, Dpn and Mira. The yellow circles labeled NSCs, lower panels are enlarged views of cells in white squares in upper panels, yellow dotted circles labeled the nucleus of NSCs. g Quantification of SUMO intensity (normalized to Dpn) in qNSCs and aNSCs in (f). QNSCs in control (yw), 1 ± 0.21, n = 10; qNSCs in akt3, 0.82 ± 0.22, P = 0.0007, n = 10; aNSCs in control, 1.96 ± 0.38, P = 1.9E-20, n = 10; aNSCs in akt3, 1.49 ± 0.17, P = 5.2E-38, P = 7.4E-15, n = 10. h Quantification of smt3 mRNA fold enrichment in qPCR assay. At 24 h ALH, larva brains from yw control and akt3 were dissected for qPCR, P = 0.07, n = 3. i Larval brain lobes from control (β-galRNAi), UAS-InRAD and UAS-Myr-Akt lines driven by grh-Gal4. j Quantification graph of SUMO intensity (normalized to Dpn) in qNSCs and aNSCs in (i). qNSCs in control, 1 ± 0.26, n = 11; qNSCs in UAS-Myr-Akt, 1.32 ± 0.35, P = 2.1E-25, P = 7.8E-11, n = 10; qNSCs in UAS-InRAD, 1.14 ± 0.33, P = 2.5E-08, P = 0.003, n = 10; aNSCs in control, 1.59 ± 0.56, P = 3.6E-17, n = 11; aNSCs in UAS-Myr-Akt, 2.39 ± 0.72, P = 4.1E-16, n = 10; aNSCs in UAS-InRAD, 2.05 ± 0.63, P = 2.5E-08, n = 10. k Quantification of the % of NSCs with higher SUMO intensity per BL in (i). Control, 26 ± 11.8, n = 11; UAS-Myr-Akt, 33.3 ± 4.6, P = 0.001, n = 10; UAS-InRAD, 30.2 ± 3.7, P = 0.027, n = 10. Yellow dotted circles labeled cell nucleus. Data are presented as mean ± SD. **** for P ≤ 0.0001, *** for P ≤ 0.001, ** for P ≤ 0.01, ∗ for 0.05≤p ≤ 0.01, ns indicates p > 0.05. Scale bars: 10 μm.
Fig. 4
Fig. 4. Wts is SUMOylated by Smt3 at Lys766.
a The illustration of Wts protein. PPxY motif is required for Yki interaction. The SUMOylation site K766 is within the kinase domain of Wts protein. HM is hydrophobic motif, T1077 is the Thr phosphorylated by Hpo, and this site is within the hydrophobic motif of Wts protein. SUMOylation assays in S2 cells. IP was conducted with anti-Flag antibody (b, f, h) or anti-Wts antibody (d), and western blots were performed by using anti-SUMO and anti-Flag to detect SUMOylated Wts and overall levels of Flag-Wts, respectively. Tubulin serves as a loading control. b Flag-Wts and Myc-Smt3WT or Myc-Smt3AA were co-transfected into S2 cells. d S2 cells were treated with double stranded RNA against gfp, smt3 or lwr for 72 h to induce knockdown. f Flag-Wts, Myc-Smt3 and HA-Ubc9 were co-transfected into S2 cells. 6 h before harvested, S2 cells were treated with DMSO or ML-792. h Flag-WtsWT or Flag-WtsKR was co-transfected with Myc-Smt3 into S2 cells. c, e, g, i Quantification of Wts SUMOylation for (b, d, f, h) respectively, n = 3. c Control (Flag-Wts), 1; Flag-Wts + Myc-Smt3WT, 2.59 ± 0.18, P = 0.0001; Flag-Wts + Myc-Smt3AA, 1.28 ± 0.35, P = 0.24, P = 0.005. e Control (gfpRNAi), 1; smt3RNAi, 0.64 ± 0.12, P = 0.007; lwrRNAi, 0.68 ± 0.19, P = 0.004. g Control (Flag-Wts, DMSO), 1; Flag-Wts + Myc-Smt3 + HA-Ubc9 (DMSO), 2.71 ± 0.62, P = 0.009; Flag-Wts + Myc-Smt3 + HA-Ubc9 (ML-792), 0.93 ± 0.05, P = 0.07, P = 0.008. i Control (Flag-WtsWT), 1; Flag-WtsWT + Myc-Smt3, 1.51 ± 0.05, P = 7.4E-05; Flag-WtsKR, 1.05 ± 0.29, P = 0.79; Flag-WtsKR + Myc-Smt3, 0.98 ± 0.22, P = 0.87, P = 0.015. j At 24 h ALH, larval brain lobes from control (β-galRNAi) and UAS-smt3AA lines driven by grh-Gal4 were analyzed for EdU incorporation. NSCs were marked by Dpn and Mira. White arrows point to EdU- qNSCs. k Quantification of EdU- NSCs per BL for (j). Control, 8.9 ± 3, n = 10; UAS-smt3AA-1, 29.8 ± 5.8, P = 7.6E-09, n = 10; UAS-smt3AA-2, 35 ± 3.6, P = 7.8E-13, n = 10. l Quantification of NSCs that retaining cellular protrusion per BL for (j). Control, 3.2 ± 1.2, n = 10; UAS-smt3AA-1, 8.4 ± 1.8, P = 4.2E-07, n = 10; UAS-smt3AA-2, 10.9 ± 1.7, P = 6.2E-10, n = 10. m Quantification of PH3+ NSCs per BL for (j). Control, 24.4 ± 4.3, n = 10; UAS-smt3AA-1, 13.9 ± 3, P = 5.5E-06, n = 10; UAS-smt3AA-2, 12.7 ± 2.3, P = 5.5E-07, n = 10. Data are presented as mean ± SD. **** for P ≤ 0.0001, ** for P ≤ 0.01, ∗ indicates 0.05≤p ≤ 0.01, ns indicates p > 0.05. Scale bars: 10 μm.
Fig. 5
Fig. 5. SUMOylation of Wts at Lys766 suppresses its phosphorylation and attenuates its kinase activity.
a, c, e, g, j S2 cells transfected with various constructs or with indicated treatment were collected for IP followed by Western blotting. b, d, f, h, i, km Quantification of the indicated protein levels or fold changes in (a, c, e, g, j) respectively, from three-four independent repeats. b, d Relative p-Wts levels (normalize to Flag-Wts or Flag-WtsKD) in (a, c). b Control (Flag-Wts), 0.57 ± 0.17, P = 0.012; Flag-Wts + Myc-Hpo, 1; Flag-WtsKR, 0.96 ± 0.13, P = 0.036; Flag-WtsKR + Myc-Hpo, 2.25 ± 0.3, P = 0.002, P = 0.30. d Control (Flag-Wts + gfpRNAi), 1; Flag-Wts + hpoRNAi, 0.92 ± 0.05, P = 0.07, P = 0.054; Flag-WtsKR + gfpRNAi 2.25 ± 0.45, P = 0.008; Flag-WtsKR + hpoRNAi, 1.12 ± 0.11, P = 0.15, P = 0.013. e S2 cells were treated with cycloheximide (CHX) prior to IP. f Relative level of p-Wts for (e) (p-Wts normalized to Flag-Wts(KR)). WtsWT 0 h: 1, 2 h: 0.95 ± 0.07; 4 h: 1.38 ± 0.26; 6 h: 1.17 ± 0.29; WtsKR 0 h: 1.82 ± 0.22, 2 h: 1.79 ± 0.27; 4 h: 1.76 ± 0.45; 6 h: 1.55 ± 0.3. g Yki and p-Yki are detected in S2 cells transfected with various constructs. h Relative p-Yki levels in (g). Control (HA-Yki), 0.7 ± 0.01, P = 6.6E-09; HA-Yki + Flag-Wts, 1; HA-Yki + Flag-WtsKR 2.07 ± 0.22, P = 5.9E-05. i Quantification of relative p-Yki levels, which was first normalized to HA-Yki and then further normalized to Flag-Wts from four repeats in (g). HA-Yki + Flag-Wts, 1; HA-Yki + Flag-WtsKR 1.83 ± 0.28, P = 0.0009. j S2 cells transfected with various constructs were treated with DMSO or ML-792. Wts, p-Wts, Yki, and p-Yki were detected following IP. km Quantifications for (j). k Wts SUMOylation fold change. DMSO, 1; ML-792, 0.58 ± 0.03, P = 2.2E-05. l Relative p-Wts level. DMSO, 1; ML-792, 2.35 ± 0.36, P = 0.003. m p-Yki level. DMSO, 1; ML-792, 2.42 ± 0.66, P = 0.02. Data are presented as mean ± SD. ns indicates p ≥ 0.05; indicates 0.05≤ p ≤ 0.01, ∗∗ indicates p ≤ 0.01, ∗∗∗∗ indicates p ≤ 0.0001. Scale bars: 10 μm.
Fig. 6
Fig. 6. Wts SUMOylation deficient mutant functions as an active form of Wts kinase to suppress NSC reactivation.
a At 24 h ALH, larval brain lobes from control (β-galRNAi), UAS-wts and UAS-wtsKR driven by grh-Gal4 were analyzed for EdU incorporation. NSCs were marked by Dpn and Mira. White arrows point to EdU- qNSCs. b Quantification of EdU- NSCs per BL for (a). Control, 6.7 ± 2.6, n = 10; UAS-wts, 23.2 ± 9.1, P = 0.0012, n = 10; UAS-wtsKR−1, 39.7 ± 8.9, P = 1.4E-09, P = 0.0007, n = 10; UAS-wtsKR-2, 34.4 ± 6.7, P = 4.5E−10, P = 0.0059, n = 10. c Quantification of NSCs retaining cellular protrusion per BL for (a). Control, 3.3 ± 1.2, n = 10; UAS-wts, 6.7 ± 2.3, P = 0.0005, n = 10; UAS-wtsKR−1, 11.9 ± 2.6, P = 1.2E-08, P = 0.00014, n = 10; UAS-wtsKR−2, 10.2 ± 1.9, P = 7.9E-09, P = 0.0014, n = 10. d Quantification of PH3+ NSCs per BL for (a). Control, 24.4 ± 4.3, n = 10; UAS-wts, 17.5 ± 1.9, P = 0.007, n = 10; UAS-wtsKR-1, 12 ± 3.4, P = 0.0002, n = 10; UAS-wtsKR−2, 14.9 ± 2.1, P = 6.8E-06, n = 10. e Proteins were extracted from larval brains of control (β-galRNAi), UAS-wts and UAS-wtsKR driven by actin-Gal4 for Western blot. f, g Quantification of four independent repeats in (e). f Control 1; UAS-wts, 1.25 ± 0.05, P = 3.4E-05; UAS-wtsKR 2.33 ± 0.45, P = 0.0009, P = 0.003. g Control, 1; UAS-wts, 1.48 ± 0.22, P = 0.005; UAS-wtsKR 3.04 ± 0.68, P = 0.001, P = 0.005. Data are presented as mean ± SD. indicates 0.05≤ p ≤ 0.01, ∗∗ indicates p ≤ 0.01, ∗∗∗ indicates p ≤ 0.001, ∗∗∗∗ indicates p ≤ 0.0001. Scale bars: 10 μm.
Fig. 7
Fig. 7. Wts SUMOylation promotes Yki nuclear localization and Yki target genes expression in NSCs.
a, d, g, j, l, n At 24 h ALH, larval brain lobes were labeled with indicated proteins. NSCs were marked by Dpn and Mira or Msps. a, d, g White arrows point to NSCs without nYki localization. The Yki+ Dpn- cells pointed by yellow arrows are optic lobe cells. b, e, h Quantification of NSCs with nYki per BL in (a, d, g) respectively. b Control (yw), 90.8 ± 2.3, n = 11; smt304493, 13.5 ± 4.6, P = 2.8E−21, n = 12; lwr13, 31.8 ± 7.8, P = 5.0E-13, n = 10. e Control (β-galRNAi), 88.2 ± 3.1, n = 10; UAS-smt3AA-1, 69 ± 9.5, P = 9.7E-06, n = 10; UAS-smt3AA-2, 65 ± 11.1, P = 5.0E-06, n = 10. h Control (β-galRNAi), 87.1 ± 4.2, n = 10; UAS-wts, 60.5 ± 7.3, P = 1.6E-08, n = 10; UAS-wtsKR, 20.5 ± 8.5, P = 2.0E-14, P = 1.5E-09, n = 10. c, f, i Quantification of nYki intensity (normalized to Dpn) in NSCs in (a, d, g) respectively. (c) Control, 1 ± 0.18, n = 11; smt304493, 0.5 ± 0.09, P = 4.0E-82, n = 12; lwr13, 0.59 ± 0.12, P = 1.9E-56, n = 10. f Control (β-galRNAi), 1 ± 0.35, n = 10; UAS-smt3AA-1, 0.61 ± 0.14, P = 2.4E-27, n = 10; UAS-smt3AA-2, 0.61 ± 0.15, P = 7.3E-23, n = 10. i Control (β-galRNAi), 1 ± 0.35, n = 10; UAS-wts, 0.79 ± 0.18, P = 4.6E-09, n = 10; UAS-wtsKR, 0.49 ± 0.12, P = 4.3E-42, P = 1.8E-42, n = 10. k, m Quantification of CycE intensity (normalized to Dpn) in NSCs in (j, l) respectively. k Control (yw), 1 ± 0.47, n = 10; smt304493, 0.33 ± 0.13, P = 4.1E-37, n = 15; lwr13, 0.36 ± 0.11, P = 4.3E-29, n = 13. m control (β-galRNAi), 1 ± 0.14, n = 10; UAS-wts, 0.86 ± 0.22, P = 8.7E-05, n = 10; UAS-wtsKR, 0.69 ± 0.18, P = 3.2E-17, P = 2.1E-05, n = 10. n Larval brain lobes from control (β-galRNAi), UAS-wts and UAS-wtsKR lines driven by grh-Gal4; Ban-lacZ were labeled with Dpn, Msps, and β-gal (Ban-lacZ). o Quantification of Ban-lacZ intensity (normalized to Dpn) in NSCs in (n). Control, 1 ± 0.28, n = 10; UAS-wts, 0.74 ± 0.26, P = 1.6E-13, n = 13; UAS-wtsKR, 0.54 ± 0.2, P = 2.3E-13, P = 4.0E-41, n = 14. The yellow circles labeled the NSCs, the lower panels are enlarged views of the cells in the white squares in the upper panels, the yellow dotted circles labeled the nucleus of the NSCs. Data are presented as mean ± SD. ** for P ≤ 0.01, **** for P ≤ 0.0001. Scale bars: 10 μm.
Fig. 8
Fig. 8. The SUMO pathway downregulates Wts protein level in vitro.
a, c Western blotting in S2 cells expressing indicated proteins. e, g S2 Cells expressing indicated proteins were treated with cycloheximide (CHX) for indicated intervals and collected for Western blotting with indicated antibodies. b, d, f, h Quantification of Wts protein levels for (a, c, e, g) respectively (normalized to Tubulin). Data here is the mean of 3 independent experiments. b Flag-Wts, 1; Flag-Wts+HA-Smt3, 0.68 ± 0.06, P = 0.0007; Flag-Wts+2 HA-Smt3, 0.54 ± 0.07, P = 0.0003. d Flag-Wts, 1; Flag-Wts+HA-Ubc9, 0.72 ± 0.08, P = 0.004; Flag-Wts+2 HA-Ubc9, 0.55 ± 0.06, P = 0.0002. Flag-Wts, 0 h, 1; 2 h, 0.77 ± 0.02; 4 h, 0.65 ± 0.07; 6 h, 0.49 ± 0.12; Flag-Wts+Myc-Smt3, 0 h, 1; 2 h, 0.7 ± 0.1; 4 h, 0.49 ± 0.1; 6 h, 0.29 ± 0.04; (f) Flag-Wts, 0 h, 1; 2 h, 0.72 ± 0.07; 4 h, 0.61 ± 0.09; 6 h, 0.52 ± 0.12; Flag-Wts+Myc-Smt3AA, 0 h, 1; 2 h, 0.74 ± 0.1; 4 h, 0.55 ± 0.06; 6 h, 0.53 ± 0.18. Data are presented as mean ± SD. *** for 0.001 ≤ P ≤ 0.0001, ** for 0.01 ≤ P ≤ 0.001.
Fig. 9
Fig. 9. The SUMO pathway downregulates Wts protein level in vivo.
At 24 h ALH (a, e, g) or 16 h ALH (c), larval brain lobes from indicated genotypes were labeled with Wts, Dpn and Mira, Venus tag in (c) and (e) also showed expression in NSCs. The yellow dotted circles labeled the Dpn+ and Mira+ NSCs; white arrows pointed to Venus positive NSCs. The lower panels are enlarged views of the cells in yellow dotted circles in upper panels. b, d, f, h Quantification of Wts intensity in NSCs normalized to Dpn in various genotypes in (a, c, e, g) respectively. b, qNSCs in control (yw), 1 ± 0.1, n = 12; qNSCs in smt304493, 1.34 ± 0.26, P = 4.2E-11, n = 11; qNSCs in lwr13, 1.23 ± 0.25, P = 1.3E-06, n = 10; aNSCs in control, 1.22 ± 0.14, P = 1.6E-14, n = 12; aNSCs in smt304493, 1.58 ± 0.17, P = 1.0E-30, P = 1.3E-07, n = 11; aNSCs in lwr13, 1.5 ± 0.19, P = 3.5E-20, P = 5.4E-09, n = 10. d Control (β-galRNAi), 1 ± 0.14, n = 13; UAS-smt3-1, 0.84 ± 0.16, P = 3.6E-18, n = 11; UAS-smt3-2, 0.75 ± 0.1, P = 1.2E-45, n = 11. f Control (β-galRNAi), 1 ± 0.12, n = 12; UAS-smt3AA-1, 1.52 ± 0.28, P = 1.2E-51, n = 10; UAS-smt3AA-2, 1.6 ± 0.34, P = 5.1E-49, n = 10. h Control (β-galRNAi), 1 ± 0.2, n = 10; UAS-lwr, 0.81 ± 0.18, P = 1.4E-14, n = 10; UAS-lwrDN, 1.25 ± 0.2, P = 5.0E-21, n = 10. i Quantification of wts mRNA fold enrichment in qPCR assay. At 24 h ALH, larval brains from control (yw), smt304493 and lwr13 were dissected for qPCR, n = 3. Control, 1; smt304493, 0.99 ± 0.07, P = 0.82; lwr13, 0.98 ± 0.02, P = 0.15. The yellow circles labeled the NSCs, the lower panels are enlarged views of the cells in the white squares in the upper panels. Data are presented as mean ± SD. **** for P ≤ 0.0001. Scale bars: 10 μm.
Fig. 10
Fig. 10. SUMO pathway promotes NSC reactivation by inhibiting the Hippo pathway.
a, c At 24 h ALH, larval brain lobes in indicated genotypes were analyzed for EdU incorporation. NSCs were marked by Dpn and Mira. White arrows point to EdU negative quiescent NSCs. b, d Quantification graph of EdU- NSCs per BL for genotypes in (a, c) respectively. b Control (β-galRNAi; β-galRNAi), 11.9 ± 3.9, n = 13; smt3RNAi; β-galRNAi, 54.3 ± 8.7, P = 1.8E-13, n = 11; β-galRNAi; wtsRNAi, 9.2 ± 2.5, P = 0.07, n = 10; smt3RNAi; wtsRNAi, 28.6 ± 4.5, P = 4.1E-09, P = 9.3E-08, n = 10; β-galRNAi; ykiS168A, 16.1 ± 4.6, P = 0.025, n = 10; smt3RNAi; ykiS168A, 31 ± 5.3, P = 1.8E-09, P = 6.5E-07, n = 10. d Control (β-galRNAi; β-galRNAi),8.6 ± 4.1, n = 13; lwr13; β-galRNAi, 65.7 ± 10, P = 1.6E-15, n = 12; β-galRNAi; wtsRNAi, 8.8 ± 3, P = 0.89, n = 10; lwr13; wtsRNAi, 37.8 ± 7, P = 3.0E-11, P = 3.9E-07, n = 10; β-galRNAi; ykiS168A, 14.4 ± 4.7, P = 0.003, n = 11; lwr13; ykiS168A, 38.1 ± 5.7, P = 1.5E-06, P = 2.2E-07, n = 10. Data are presented as mean ± SD. **** for P ≤ 0.0001, ** for P ≤ 0.01 and ns for P > 0.05. Scale bars: 10 μm. e A working model illustrating the mechanism by which SUMO pathway promotes NSC reactivation. Wts kinase can be phosphorylated and activated by Hpo kinase. Phosphorylated Wts promotes Yki phosphorylation and cytoplasmic retention. Akt promotes the increase of SUMO protein. SUMO E1 Aos1/Uba2 and E2 Ubc9 promote Wts SUMOylation, resulting in Wts phosphorylation suppression and Wts protein degradation. As a result, Yki phosphorylation is decreased and more non-phosphorylated Yki enters the nucleus and binds to the transcription factor Sd, activating the target genes, such as cycE and bantam expression and, in turn, promoting quiescent NSC reactivation. P: Phosphate; S: SUMO.

References

    1. Morshead, C. M. et al. Neural stem cells in the adult mammalian forebrain: a relatively quiescent subpopulation of subependymal cells. Neuron13, 1071–1082 (1994). - PubMed
    1. Chiasson, B. J., Tropepe, V., Morshead, C. M. & van der Kooy, D. Adult mammalian forebrain ependymal and subependymal cells demonstrate proliferative potential, but only subependymal cells have neural stem cell characteristics. J. Neurosci.19, 4462–4471 (1999). - PMC - PubMed
    1. Tarpey, P. S. et al. Mutations in CUL4B, which encodes a ubiquitin E3 ligase subunit, cause an X-linked mental retardation syndrome associated with aggressive outbursts, seizures, relative macrocephaly, central obesity, hypogonadism, pes cavus, and tremor. Am. J. Hum. Genet.80, 345–352 (2007). - PMC - PubMed
    1. Zou, Y. et al. Mutation in CUL4B, which encodes a member of cullin-RING ubiquitin ligase complex, causes X-linked mental retardation. Am. J. Hum. Genet.80, 561–566 (2007). - PMC - PubMed
    1. Badura-Stronka, M. et al. A novel nonsense mutation in CUL4B gene in three brothers with X-linked mental retardation syndrome. Clin. Genet.77, 141–144 (2010). - PubMed

Publication types

MeSH terms

Substances

LinkOut - more resources