

doi: 10.1038/s41467-024-53477-x.
The human claustrum tracks slow waves during sleep
Affiliations
- PMID: 39419999
- PMCID: PMC11487173
- DOI: 10.1038/s41467-024-53477-x
Item in Clipboard
The human claustrum tracks slow waves during sleep
Nat Commun.
.
Abstract
Slow waves are a distinguishing feature of non-rapid-eye-movement (NREM) sleep, an evolutionarily conserved process critical for brain function. Non-human studies suggest that the claustrum, a small subcortical nucleus, coordinates slow waves. We show that, in contrast to neurons from other brain regions, claustrum neurons in the human brain increase their spiking activity and track slow waves during NREM sleep, suggesting that the claustrum plays a role in coordinating human sleep architecture.
© 2024. The Author(s).
Conflict of interest statement
The authors declare no competing interests.
Figures
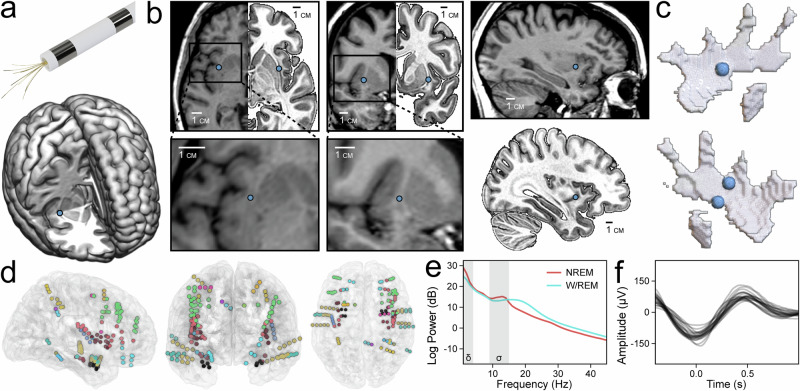
a Model of a Behnke–Fried depth electrode with protruding microwires for sampling the claustrum (top). Location of right claustrum microwires (blue dot) in Subject A on the MNI152 template (bottom). b Axial, coronal, and sagittal T1 MR images of Subject A with corresponding mirrored MNI152 templates in the axial and coronal views (top row) marking the location of right claustrum microwires and accompanied by magnified inserts and a sagittal MNI152 template (bottom row). c Locations of distal microwires when superimposed onto MNI152 models of the right and left claustrum, respectively (left top and bottom). Sagittal T1 MR image of Subject A (top right) marking the location of the right claustrum microwires. d Electrode locations for all subjects superimposed onto the N27 template in axial, coronal, and sagittal views (left, middle, right). e Power spectral density of NREM and W/REM sleep across all channels in Subject B, Night 03. Delta and sigma frequency bands (indicating SWA and sleep spindles, respectively) are shaded. f Average waveforms of detected slow waves in each channel of Subject B, Night 03.
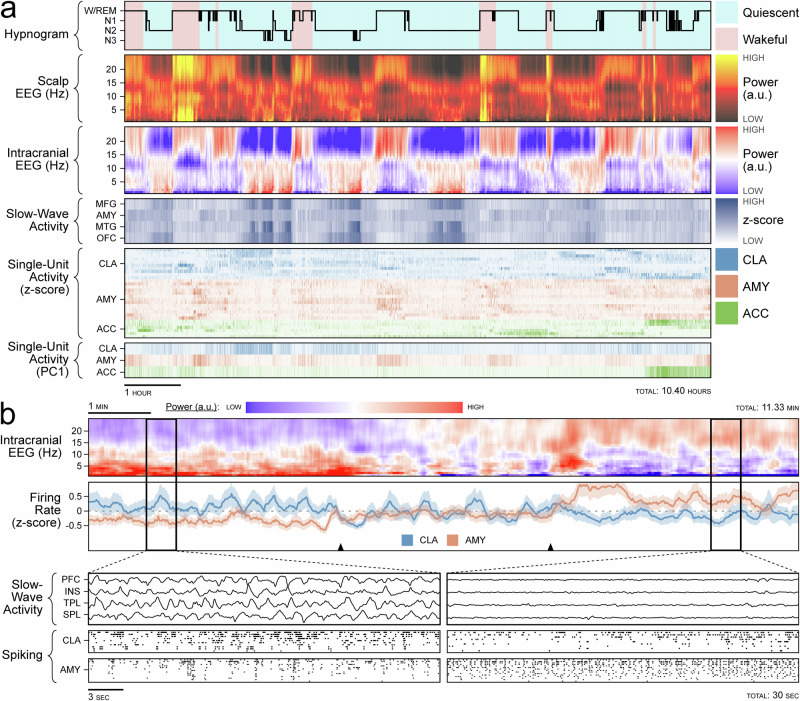
a Sleep recording from Subject B, Night 03. Hypnogram is colored by behavioral state observed on avEEG: red indicates wakefulness and blue indicates behavioral quiescence (first row). Power spectrogram from the C4 scalp electrode (second row). Illustrative power spectrogram from right middle frontal gyrus (third row). Binned z-score of slow-wave activity from four illustrative regions: middle frontal gyrus, amygdala, middle temporal gyrus, and orbitofrontal cortex (fourth row). Binned z-score of the firing rate for claustrum (blue), anterior cingulate cortex (green), and amygdala (orange) single units (fifth row). First principal component of the firing rate for single units in the above regions (sixth row). b Transition out of NREM sleep in Subject A. Power spectrogram of the left middle frontal electrode (first row). z-scored population firing rates in the claustrum (blue) and amygdala (orange) with black triangles indicating the transition period (second row). Magnified windows before and after sleep transition (bottom left and bottom right panels) showing SWA in the prefrontal cortex, insula, temporal lobe, and parietal lobe (first rows of bottom panels) and raster plots of spiking activity for the claustrum (second rows of bottom panels) and amygdala (third rows of bottom panels).
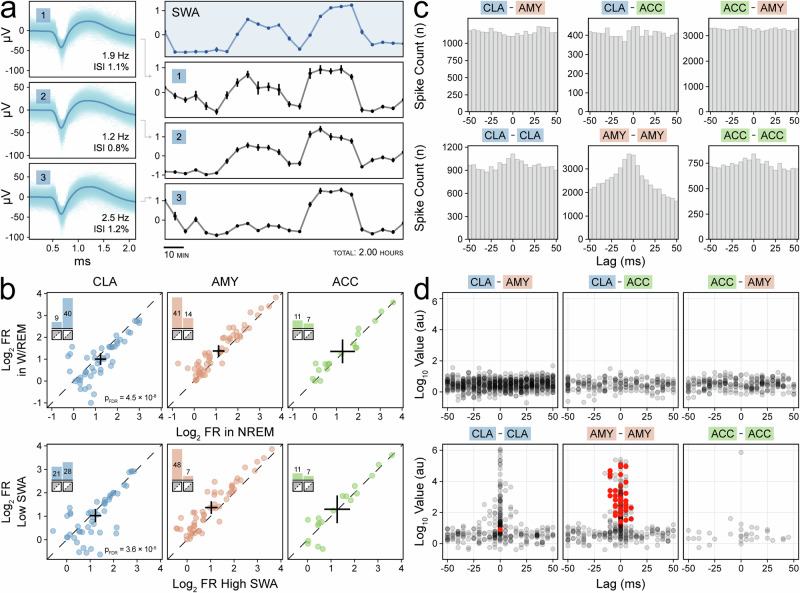
a Average waveforms of three claustrum units with inset firing rate and inter-spike interval violations (left panels) with corresponding mean z-scored firing rate (black panels) aligned to the illustrative z-scored slow-wave activity (SWA) in the right orbitofrontal cortex from Subject A (blue panels) (right panels). Standard error for each 5-min interval (30 epochs of 10 s each) is indicated by vertical bars. b Scatterplots of log2 firing rate of claustrum (blue), amygdala (orange), and anterior cingulate (green) units stratified by sleep stage (not NREM sleep vs. NREM sleep, left) and SWA (25th vs. 75th percentiles, middle). Crosses indicate population averages with 95% confidence intervals. Units in the lower triangle favor SWs. Inset bar plots indicate the number of units in the upper and lower triangles, and their sum indicates the sample size. c Example cross-correlograms during NREM sleep between single unit pairs with p < 0.05 prior to FDR correction on threshold-free cluster enhancement (TFCE) permutation testing (except for ACC–ACC). d Scatterplots stratified by region pairs showing the maximum TFCE value of each unit pair’s cross-correlogram (in log10) and the time lag at which it occurred; red indicates unit pairs with p < 0.05 after FDR correction on TFCE permutation testing.
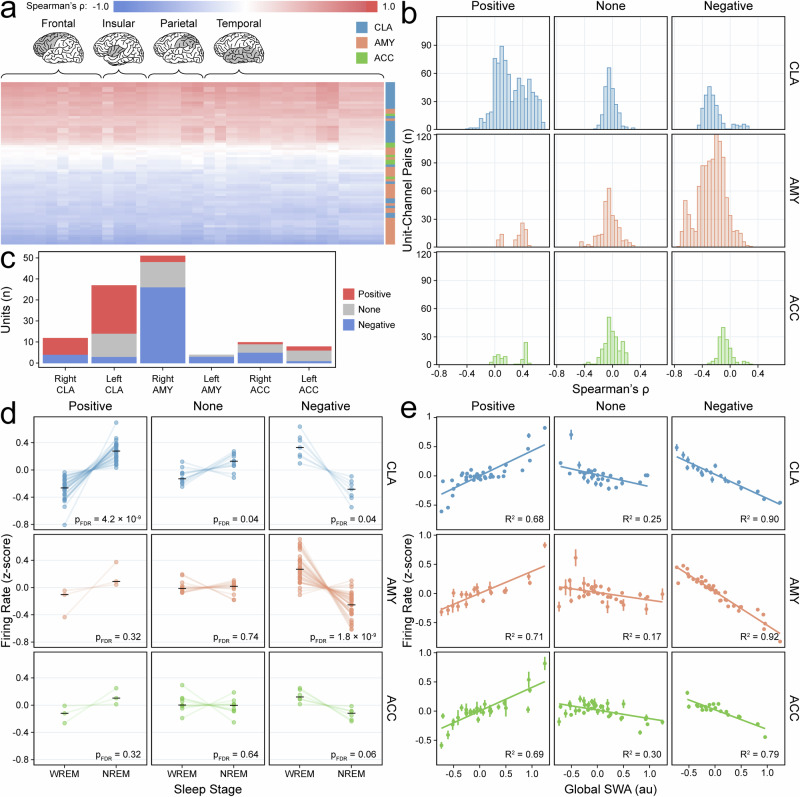
a Heatmap of Spearman’s ρ correlations between units (rows) and SWA across channels (columns) for Subject A. Colors indicate unit region. Highlighted lobes indicate channel locations. b Histogram of Spearman’s ρ values for unit-channel pairs (122 units and 64 unique channels across four recordings) stratified by unit response type and unit region. Colors indicate unit region. c Bar plot showing distribution of single units across all subjects with positive (red), negative (blue), or no correlation (gray) with ipsilateral SWA and SWs. d Paired dot plots of z-scored firing rates for units (n = 122) in WREM versus NREM sleep stratified by unit response type and unit region; black horizontal lines indicate group medians, and p-values are derived from FDR-corrected Wilcoxon signed-rank tests (two-sided). Colors indicate unit region. e Decile scatterplots stratified by unit response type and unit region show the average z-scored firing rate for each decile of SWA. Deciles are plotted separately for each of four sleep recordings and are derived from 10 s epochs (underlying sample size varies based on recording length and the number of units in each response-region subset); vertical lines indicate the standard error; fitted lines and R2 values are based on linear models. Colors indicate unit region.
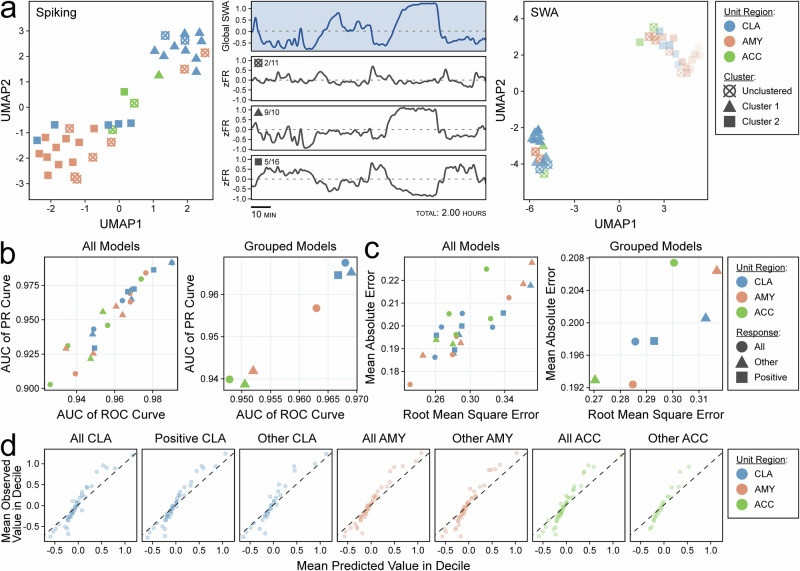
a Scatterplot of UMAP dimensions for Subject A’s single-unit spiking activity demonstrating self-segregation of single units into two clusters (and one unclustered group) indicated by shapes (left). Global slow-wave activity (middle, top panel) with aligned z-scored population firing rates for UMAP clusters with fractions indicating the proportion of claustrum units in each cluster (middle). Scatterplot of two UMAP dimensions for the same units after dimensionality reduction of correlation with slow wave presence across channels (right). b Scatterplot displaying the area under the curve (AUC) for the receiver operating characteristic (ROC) curve and the precision-recall (PR) curve for support vector machine (SVM) models classifying sleep stage using dimensionally reduced population activity from single unit groups stratified by microwire region, response type, and sleep recording (left panel). The same results are shown after averaging across sleep recordings (right panel). Colors indicate unit region, and shapes indicate unit response type. c Scatterplot displaying the root mean square error (RMSE) and mean absolute error (MAE) of SVM models regressing global SWA using dimensionally reduced population activity from single unit groups stratified by microwire region, response type, and sleep recording (left panel). The same results are shown after averaging across sleep recordings (right panel). Colors indicate unit region, and shapes indicate unit response type. d Decile-wise calibration plots for the models in (c) stratified by response type and unit region. Values are arbitrary units (z-scored log10 of global SWA power). Colors indicate unit region.
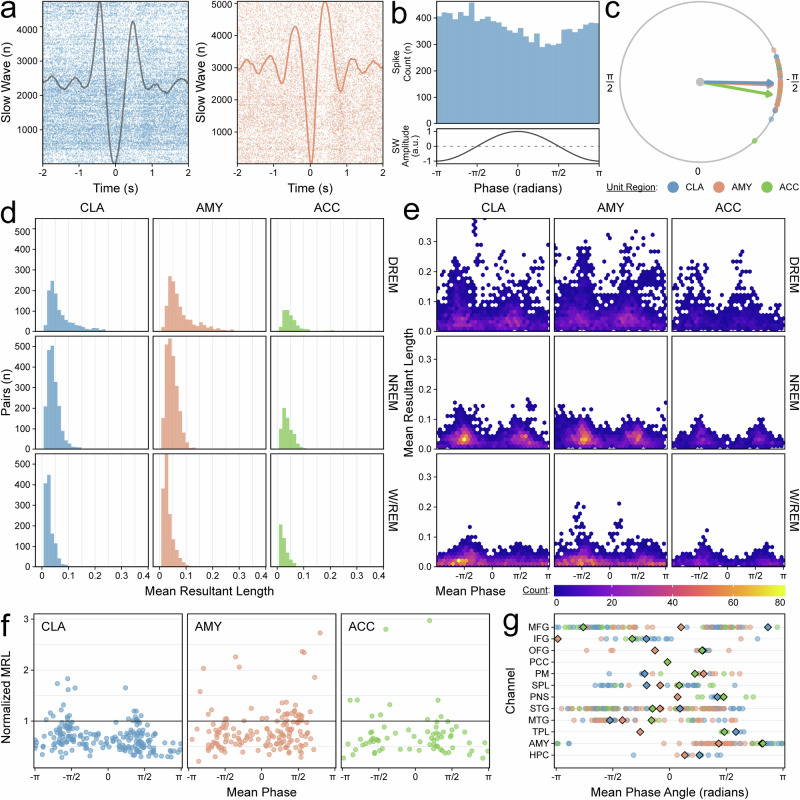
a Raster plot demonstrating phase-locking of a claustrum unit with slow waves (SW) in an illustrative orbitofrontal channel (top) compared to phase-locking in an amygdala unit with its adjacent amygdala channel (bottom) in Subject B, Night 03. The average slow-wave waveforms are superimposed. b Phase histogram for the same claustrum-orbitofrontal pair (top); the amplitude of an idealized slow wave for each phase is shown (bottom). c Polar plot for the same claustrum-orbitofrontal pair indicating the preferred phase angle for every unit-orbitofrontal pair with a phase distribution significantly different from uniform. Color indicates unit region, and arrows indicate the average preferred phase angle among all pairs of the same unit region. d Histograms of mean resultant lengths (MRLs) for unit-channel pairs stratified by unit region and sleep stage. High delta NREM (DREM) indicates NREM sleep ≥75th percentile of NREM SWA power. Colors indicate unit region. e Heatmaps of the phases at which MRLs occurred for each unit-channel pair, stratified by unit region and sleep stage. f Scatterplot of phases at which MRLs occurred during DREM sleep. Only pairs with a significant relationship in DREM sleep but not in WREM sleep are displayed. The MRLs have been normalized to the mean MRL of AMY-AMY pairs, which is indicated by the horizontal black line. Colors indicate unit region. g Region-wise preferred phase angles for all unit-channel pairs with a phase distribution significantly different from uniform in DREM sleep but not W/REM sleep (combined across all subjects). Colors indicate unit region. Diamonds indicate the average preferred phase angles for each unit region. See Supplementary Table 5 for abbreviations.
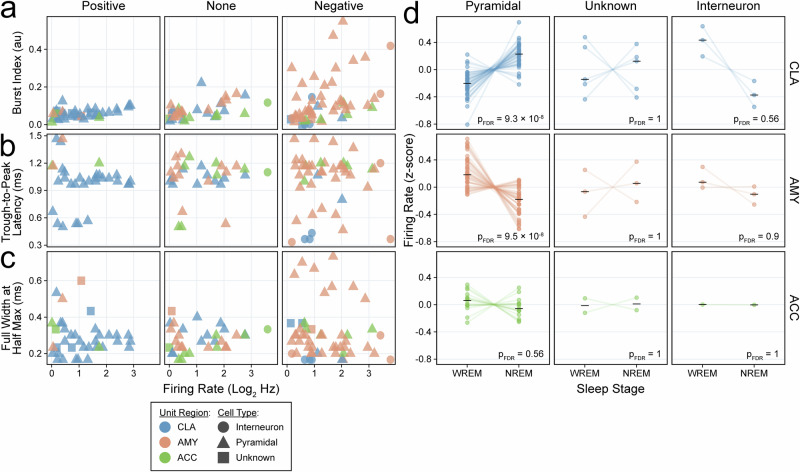
a–c Scatterplots of firing rate (log2, Hz) versus a burst index (au), b trough-to-peak latency (negative-spiking units only, ms), and c full-width at half-maximum (ms) stratified by unit response type. Colors indicate unit region and shapes indicate cell type classification. d Paired dot plots of z-scored firing rates for units in WREM versus NREM sleep stratified by cell type classification and unit region; black horizontal lines indicate group medians, and p-values are derived from FDR-corrected Wilcoxon signed-rank tests (two-sided). Colors indicate unit region.
Update of
-
The human claustrum tracks slow waves during sleep.bioRxiv [Preprint]. 2024 Jan 30:2024.01.29.577851. doi: 10.1101/2024.01.29.577851. bioRxiv. 2024. Update in: Nat Commun. 2024 Oct 17;15(1):8964. doi: 10.1038/s41467-024-53477-x. PMID: 38352615 Free PMC article. Updated. Preprint.
References
Publication types
MeSH terms
Grants and funding
LinkOut - more resources
Full Text Sources
