. 2024 Oct 17;15(1):8980.
doi: 10.1038/s41467-024-52885-3.

Multiple beta cell-independent mechanisms drive hypoglycemia in Timothy syndrome

Affiliations

Multiple beta cell-independent mechanisms drive hypoglycemia in Timothy syndrome

Maiko Matsui et al. Nat Commun. .

Abstract

The canonical G406R mutation that increases Ca2+ influx through the CACNA1C-encoded CaV1.2 Ca2+ channel underlies the multisystem disorder Timothy syndrome (TS), characterized by life-threatening arrhythmias. Severe episodic hypoglycemia is among the poorly characterized non-cardiac TS pathologies. While hypothesized from increased Ca2+ influx in pancreatic beta cells and consequent hyperinsulinism, this hypoglycemia mechanism is undemonstrated because of limited clinical data and lack of animal models. We generated a CaV1.2 G406R knockin mouse model that recapitulates key TS features, including hypoglycemia. Unexpectedly, these mice do not show hyperactive beta cells or hyperinsulinism in the setting of normal intrinsic beta cell function, suggesting dysregulated glucose homeostasis. Patient data confirm the absence of hyperinsulinism. We discover multiple alternative contributors, including perturbed counterregulatory hormone responses with defects in glucagon secretion and abnormal hypothalamic control of glucose homeostasis. These data provide new insights into contributions of CaV1.2 channels and reveal integrated consequences of the mutant channels driving life-threatening events in TS.


Conflict of interest statement

G.S.P. is on the scientific advisory board of Tevard Biosciences. All other Authors declare no competing interests.

Figures
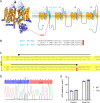
Fig. 1
Fig. 1. Generation of TS2 mouse.
A Left: structure of the homologous CaV1.1 channel (PDB: 5GJV) viewed from the membrane. The residue homologous to G406 in CaV1.2 is highlighted red. Right: schematic of the pore-forming α1C subunit of CaV1.2. The alternatively spliced exons 8 or exon 8A-encoded peptide that includes the IS6 transmembrane segment is highlighted in light blue and G406 are highlighted in red. B Comparison between the peptides encoded by exon 8 or exon 8a, with G406 highlighted in red. C A portion of the CaV1.2 cDNA sequence containing exon 8 (5’ and 3’ boundaries indicated by arrow heads), with G406 highlighted in red. D Genomic sequencing from a TS2 mouse showing the single point mutation for the G406R mutation in one of the alleles. E Relative ΔCt values for exon 8 and exon 8a from qPCR using RNA isolated from cerebral cortex of WT or TS2 mice (n = 4 each). Source data are provided as a Source Data file.
Fig. 2
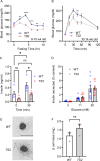
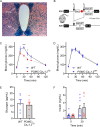
Fig. 2. TS2 mice show hypoglycemia and increased glucose tolerance independent of beta cell insulin secretion.
A Blood glucose over a 10 h fast (n = 6 each; two-way ANOVA [p = 0.004 for interaction] corrected for multiple comparisons; *p < 0.05; **p < 0.01; and ***p < 0.001). B GTT (n = 6 each; two-way ANOVA [p = 0.006 for interaction] corrected for multiple comparisons; **p < 0.01). C Basal serum insulin (0 min) and 30 min after i.p. glucose administration (n = 5 each; two-way ANOVA corrected for multiple comparisons; *p < 0.05). D Glucose stimulated insulin secretion from isolated islets (n = 6 [WT, 3 mM]; n = 9 [TS2, 3 mM]; n = 10 [all others]). E Exemplar islet insulin immunohistochemistry. Scale bar, 200 µm. F Pancreatic beta cell mass (n = 3 mice/genotype; n = 3 and 4 sections/mouse for WT and TS2, respectively; p = 0.18 two-sided, unpaired t-test). Source data are provided as a Source Data file.
Fig. 3
Fig. 3. Decreased white adipose depots and increased ketones are consistent with a hypoinsulinemic state in TS2 mice.
A Exemplar epididymal and subcutaneous fat depots (eWAT and sWAT, respectively) isolated from WT and TS2 mice. B Fat depot weight normalized to body weight (n = 7 [WT] and 9 [TS2] for eWAT; n = 7 each for sWAT, two-sided unpaired t-test, *p < 0.05; **p < 0.01). C Serum leptin (n = 14 [WT] and n = 11 [TS2], two-sided unpaired t-test, ***p < 0.001). D Serum β-hydroxybutyrate in fed and fasted states (n = 8 and 11 for WT fed and fasted, respectively; n = 15 and 12 for TS2 fed and fasted, respectively, two-way ANOVA corrected for multiple comparisons, *p < 0.05). Source data are provided as a Source Data file.
Fig. 4
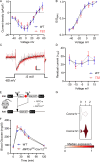
Fig. 4. CaV1.2TS expression within beta cells is not sufficient to affect blood glucose.
A Current-voltage relationship for Ca2+ currents recorded from beta cells isolated from pancreatic islets (n = 9 [WT] and10 [TS2] cells from 3 mice each). B Voltage dependence of activation for Ca2+ currents recorded from beta cells isolated from pancreatic islets (n = 9 [WT] and 10 [TS2] cells from 3 mice each). C Exemplar Ca2+ current traces for a 150 ms test pulse to −5 mV from pancreatic beta cells isolated from WT or TS2 mice. Scale bars, 10 pA, 20 ms. D Residual current (r150) for Ca2+ currents from pancreatic beta cells isolated from WT or TS2 mice (n = 10, each). E Schematic for transgenic CaV1.2TS expression from Rosa26. F GTT in mice expressing CaV1.2TS under control of a tamoxifen inducible Cre recombinase restricted to beta cells driven by the mouse insulin promoter (or WT controls, n = 3 each). G Violin plot of Cacna1c and Cacna1d expression in mouse beta cells from single cell RNA-seq dataset. Source data are provided as a Source Data file.
Fig. 5
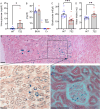
Fig. 5. TS2 mice display glycosuria.
A Urine glucose collected from fed mice (n = 9 [WT] and 8 [TS2], two-sided, unpaired t-test, *p = 0.024). B BUN and creatinine (n = 7 [WT] and 5 [TS2]). C Serum bicarbonate (n = 14 each, t-test, ***p = 0.0002). D Water intake (normalized to body mass) during metabolic cage housing (n = 9 [WT] and 8 [TS2], two-sided, unpaired t-test, **p = 0061). E Histology and LacZ staining (with eosin counterstain) of kidney from a CaV1.2 reporter mouse. F Inset from E showing CaV1.2 in the collecting ducts. G Magnified image of a glomerulus and proximal tubules. Scale bars, 50 µm. Source data are provided as a Source Data file.
Fig. 6
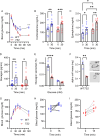
Fig. 6. TS2 mice display a blunted counterregulatory response.
A Insulin tolerance test (n = 19 [WT] and 18 [TS2], two-way ANOVA (p = 0.0005 for interaction) corrected for multiple comparisons, **p = 0.0035; ****p < 0.0001). Serum corticosterone (B, n = 11 each, mixed effects model, **p = 0.0018; ***p = 0.0008), epinephrine (C, n = 9 [WT] and 8 [TS2]; two-way ANOVA, p = 0.024 for WT 0 v. 30 min; p = 0.0025 for TS2 0 v. 30 min; p = 0.0445 WT v. TS2 0 min; p = 0.0020, WT v. TS2 30 min), and glucagon (D, n = 10, each; two-way ANOVA, p = 0.0028 WT 0 v. 30 min; p = 0.0111 TS2 0 v. 30 min) before (0) and 30 min after insulin administration. E Glucose regulated glucagon secretion from isolated islets (n = 4 mice each, two-way ANOVA, corrected for multiple comparisons, ****, p < 0.0001). F Pancreatic α cell mass (n = 3 mice/genotype; n = 3 and 4 sections/mouse for WT and TS2, respectively) Two-sided, unpaired t-test, p = 0.0065. Inset shows exemplar α cell staining. Scale bar, 200 µm. G Pyruvate tolerance test in fasted mice (n = 4 each; two-way ANOVA corrected for multiple comparisons, p = not significant). H, I Blood glucose before (n = 8, each) and 15 min after (n = 7, each) pyruvate injection in fed mice). Source data are provided as a Source Data file.
Fig. 7
Fig. 7. Expression of CaV1.2TS in Pomc+ neurons affects glucose homeostasis.
A Histology and LacZ staining (with eosin counterstain) of coronal section through the hypothalamus from a CaV1.2 reporter mouse. Arc arcuate nucleus, PVH paraventricular hypothalamic nucleus. Scale bar, 200 µm. B Schematic for transgenic CaV1.2TS or CaV1.2WT expression restricted to Pomc+ neurons from the Rosa26 locus. C GTT for mice expressing CaV1.2TS in Pomc+ neurons or controls (n = 4 [WT] and 5 [Pomc-CaV1.2TS], two-way ANOVA corrected for multiple comparisons (p = 0.0042 for interaction), *p = 0.0114; ***p < 0.001). D GTT for mice expressing CaV1.2WT in Pomc+ neurons or controls (n = 8, each). E Fasting serum glucagon in WT and Pomc-CaV1.2TS mice (n = 5 [WT] and 6 [TS2]). Two-way ANOVA, p not significant. F Fasting and glucose-stimulated serum insulin in WT and Pomc-CaV1.2TS mice (n = 9 [WT] and 8 [TS2]). Two-way ANOVA, p not significant. Source data are provided as a Source Data file.

References

    1. Splawski, I. et al. Severe arrhythmia disorder caused by cardiac L-type calcium channel mutations. Proc. Natl Acad. Sci. USA102, 8089–8096 (2005). - PMC - PubMed
    1. Splawski, I. et al. Ca(V)1.2 calcium channel dysfunction causes a multisystem disorder including arrhythmia and autism. Cell119, 19–31 (2004). - PubMed
    1. Pitt, G. S., Matsui, M. & Cao, C. Voltage-Gated Calcium Channels in Nonexcitable Tissues. Annu Rev. Physiol.83, 183–203 (2021). - PMC - PubMed
    1. Yates, D., Yates, A. & Collyer, T. A life-threatening complication of the arterial tourniquet in Timothy syndrome. Paediatr. Anaesth.17, 492–495 (2007). - PubMed
    1. Joseph-Reynolds, A., Auden, S. & Sobczyzk, W. Perioperative considerations in a newly described subtype of congenital long QT syndrome. Paediatr. Anaesth.7, 237–241 (1997). - PubMed

Publication types

MeSH terms

Supplementary concepts

Associated data