. 2024 Oct 17;15(1):8971.
doi: 10.1038/s41467-024-53380-5.

Methionine-SAM metabolism-dependent ubiquinone synthesis is crucial for ROS accumulation in ferroptosis induction

Affiliations

Methionine-SAM metabolism-dependent ubiquinone synthesis is crucial for ROS accumulation in ferroptosis induction

Chaoyi Xia et al. Nat Commun. .

Abstract

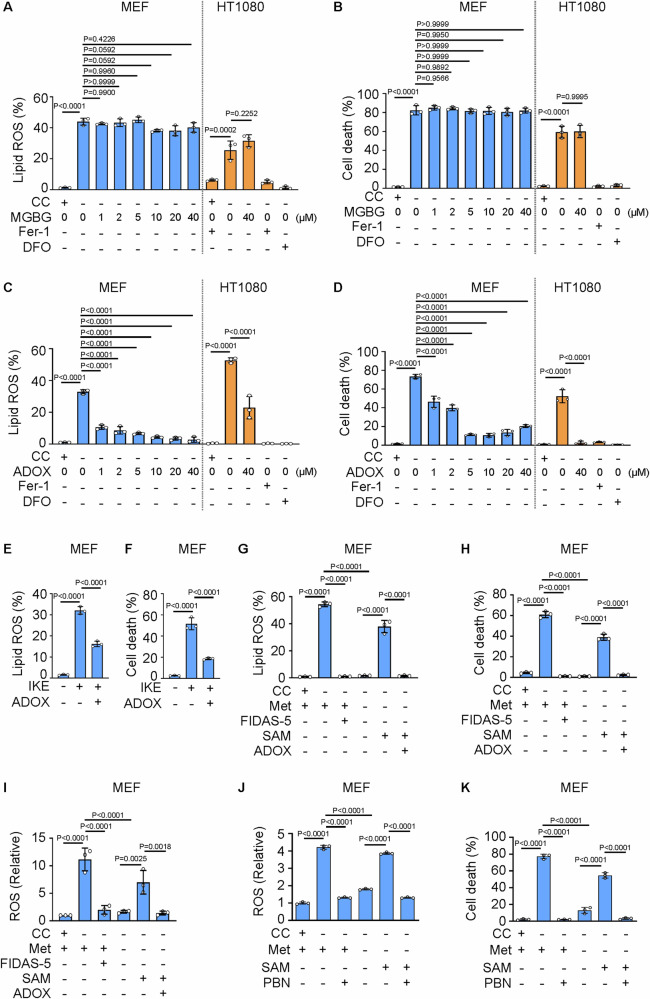
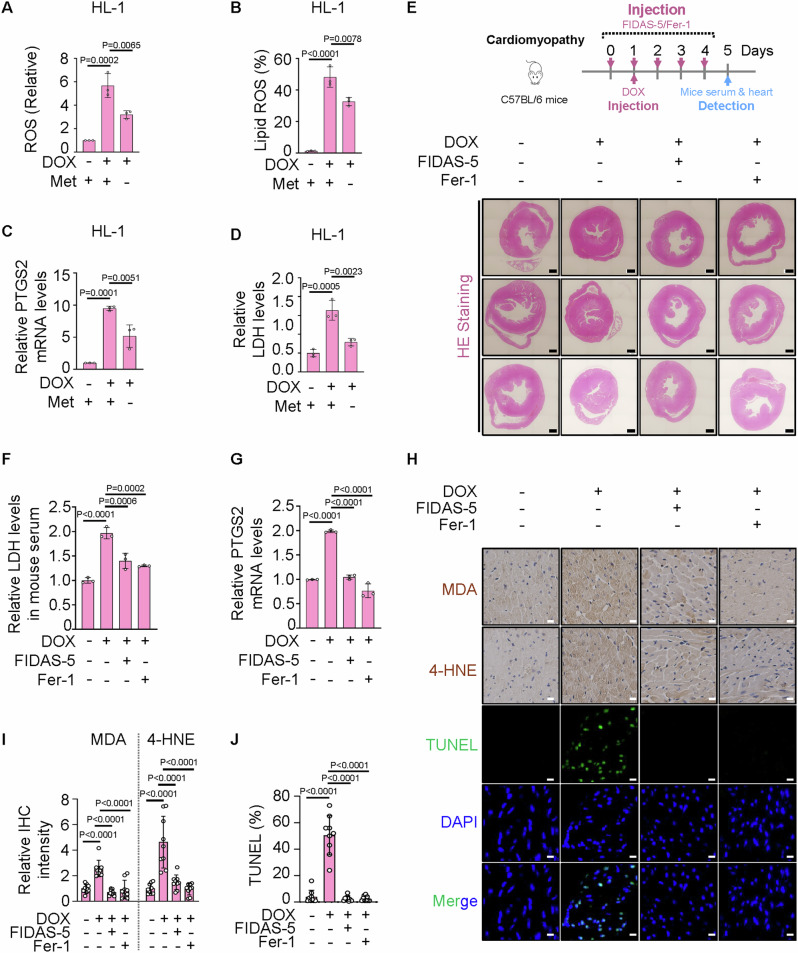
Ferroptosis is a cell death modality in which iron-dependent lipid peroxides accumulate on cell membranes. Cysteine, a limiting substrate for the glutathione system that neutralizes lipid peroxidation and prevents ferroptosis, can be converted by cystine reduction or synthesized from methionine. However, accumulating evidence shows methionine-based cysteine synthesis fails to effectively rescue intracellular cysteine levels upon cystine deprivation and is unable to inhibit ferroptosis. Here, we report that methionine-based cysteine synthesis is tissue-specific. Unexpectedly, we find that rather than inhibiting ferroptosis, methionine in fact plays an essential role during cystine deprivation-induced ferroptosis. Methionine-derived S-adenosylmethionine (SAM) contributes to methylation-dependent ubiquinone synthesis, which leads to lipid peroxides accumulation and subsequent ferroptosis. Moreover, SAM supplementation synergizes with Imidazole Ketone Erastin in a tumor growth suppression mouse model. Inhibiting the enzyme that converts methionine to SAM protects heart tissue from Doxorubicin-induced and ferroptosis-driven cardiomyopathy. This study broadens our understanding about the intersection of amino acid metabolism and ferroptosis regulation, providing insight into the underlying mechanisms and suggesting the methionine-SAM axis is a promising therapeutic strategy to treat ferroptosis-related diseases.


Conflict of interest statement

The authors declare no competing interests.

Figures

Fig. 1
Fig. 1. The synthesis of the cellular cysteine from methionine via the transsulfuration pathway might function in a tissue specific manner.
AD, F, G MEF cells were cultured ± cystine as indicated for 8–12 h. The levels of lipid ROS (A, F), cysteine (C) and total GSH (D) were measured respectively at the 8 h. The cell death levels (B, G) were quantified at the 10 h. E Schematic of metabolic intermediates and enzymes in methionine-based cysteine synthesis pathway. H The protein levels of the indicated metabolic enzymes in the mouse tissues were measured by western blot (WB). One representative experiment out of three is shown. I The mRNA levels of the indicated metabolic enzymes in the human tissues were analyzed basing the data from TCGA database and shown in heatmap. Blue color indicated high expression, and the red color indicated low expression. N normal tissues, T tumor tissues. JM The cells were cultured in cystine-free medium as indicated for 8–24 h. The levels of cysteine (J), total GSH (K), and lipid ROS (L) were measured respectively (AML12 and MIHA for 24 h, MEF for 8 h, HT1080 for 10 h). The cell death levels (M) were quantified respectively (AML12 and MIHA for 30 h, MEF for 10 h, HT1080 for 14 h). CC cystine, 0.4 mM, Met methionine, 0.4 mM, SAM S-adenosylmethionine, 0.4 mM, SAH S-adenosylhomocysteine, 0.4 mM, Hcy homocysteine, 0.4 mM, Cta cystathionine, 0.4 mM, Cys cysteine, 0.4 mM, Ser serine, R methylated substrates, MAT1A methionine adenosyltransferase 1A, MAT2A methionine adenosyltransferase 2A, MAT2B methionine adenosyltransferase 2B, GAMT guanidinoacetate N-methyltransferase, GNMT glycine N-methyltransferase, NNMT nicotinamide N-methyltransferase, PEMT phosphatidylethanolamine N-methyltransferase, AHCY adenosylhomocysteinase, AHCYL1 adenosylhomocysteinase like 1, AHCYL2 adenosylhomocysteinase like 2, CBS cystathionine beta-synthase, CTH cystathionine gamma-lyase, MTR methionine synthase, MTRR methionine synthase reductase, BHMT1 betaine-homocysteine S-methyltransferase 1, BHMT2 betaine-homocysteine S-methyltransferase 2. For AD, F, G, JM, n = 3 biological replicates, data were represented as mean ± SD with p values determined by one-way (AD, F, G) or two-way (JM) ANOVA test. Source data are provided as a Source Data file.
Fig. 2
Fig. 2. Methionine-derived SAM accounts for cystine deprivation-induced ferroptosis.
A, B The cells were cultured as indicated for 8–24 h. A The lipid ROS levels were determined (AML12/MIHA for 24 h, MEF for 8 h, HT1080 for 10 h). B The cell death levels were quantified (AML12/MIHA for 30 h, HT1080 for 14 h). C HT1080 cells were cultured as indicated for 10 h. The metabolites levels were measured by UHPLC-HRMS. Metabolites with FC ≥ 2 and p < 0.05 were considered as hits. Blue color indicated the decreased metabolites; red color indicated the increased ones. DJ The cells were simultaneously treated as indicated for 8–30 h. D, G, I The lipid ROS levels were determined (MEF for 8 h, HT1080 for 10 h, OS-RC-2 for 14 h, HL-1 for 24 h). F The mRNA levels of PTGS2 were determined at the 8 h. E, H, J The cell death levels were determined (MEF for 12 h, HT1080 for 14 h, OS-RC-2 for 18 h, HL-1 for 30 h). K, L HT1080 was transfected with non-targeting siRNA (siControl) or targeting MAT2A siRNA for 48 h, and then cultured as indicated for another 10–14 h. K The lipid ROS levels were determined at the 10 h. L The cell death levels were quantified at the 14 h. M, N HT1080 cells were transfected without or with CHAC1 plasmid for 48 h, then cultured as indicated for another 10–14 h. M The levels of total GSH and CHAC1 proteins were determined at the 10 h. N The cell death levels were quantified at the 14 h. CC, 0.4 mM; Met, 0.4 mM; SAM, 0.4 mM; SAH, 0.4 mM; Hcy, 0.4 mM; Cta, 0.4 mM; Cys, 0.4 mM; Erastin, 2 μM; IKE, 2 μM; FIDAS-5, 5 μM. n = 3 (AM) or n = 5 (N) biological replicates, data were represented as mean ± SD with p values determined by unpaired two-tailed t test (C), one-way (A, B, DJ, M, N) or two-way (K, L) ANOVA test. Source data are provided as a Source Data file.
Fig. 3
Fig. 3. Methionine-SAM metabolism-based methylation invests cellular ROS accumulation during ferroptosis.
A, B The cells were cultured in cystine-free medium in the absence or presence of MGBG, Fer-1 or DFO as indicated for 8–14 h. A The lipid ROS levels were determined (MEF for 8 h, HT1080 for 10 h). B The cell death levels were quantified (MEF for 12 h, HT1080 for 14 h). CH The cells were cultured in the medium ± cystine in the absence or presence of ADOX, Fer-1, DFO, IKE or FIDAS-5 for 8–14 h. C, E, G The Lipid ROS levels were determined (MEF for 8 h, HT1080 for 10 h). D, F, H The cell death levels were quantified (MEF for 12 h, HT1080 for 14 h). IK MEF cells were cultured in the medium ± cystine or ± methionine in the absence or presence of SAM, FIDAS-5, ADOX or PBN for 8–12 h. I, J The cellular levels of ROS were respectively quantified at the 8 h. K The cell death levels were quantified at the 12 h. CC, 0.4 mM; Met, 0.4 mM; SAM, 0.4 mM; MGBG, mitoguazone, 40 μM; ADOX, adenosine dialdehyde, 20 μM; Fer-1, ferrostatin-1, 10 μM; DFO, deferoxamine, 80 μM; FIDAS-5, 5 μM; IKE, 2 μM; PBN, alpha-phenyl-tert-N-butylnitrone, 1 mM. For AK, n = 3 biological replicates, data were represented as mean ± SD with p values determined by one-way ANOVA test. Source data are provided as a Source Data file.
Fig. 4
Fig. 4. Mitochondrial OXPHOS-based ROS accumulation downstream methionine-SAM axis is the causality in the induction of ferroptosis.
A, B MEF cells were cultured in the medium ± cystine, ± methionine, ± SAM or ± ADOX as indicated for 6 h. A The OCR was determined with Seahorse XFp. B The max OCR was calculated by Wave software 2.3.0. C, D MEF cells were cultured in the medium ± cystine or ± methionine in the absence or presence of SAM or Oligo for 8–12 h. C The cellular levels of ROS were respectively quantified at the 8 h. D The cell death levels were quantified at the 12 h. E, F HT1080 cells were transfected with the GFP-tagged Mito-pHyPer plasmid for 48 h, and then cultured as indicated for another 8 h. The fluorescence intensities of Mito-pHyPer were analyzed and quantified by fluorescent confocal microscopy. E Representative images and (F) dot plots showing intensities of Mito-pHyPer were shown. From left, n = 266, 78, 318, 476, 395, 130, 128, 150 cells. Scale bar, 5 μm. a.u. arbitrary unit. For all box plots, the bottom, middle line, and top of the box and the whiskers indicate the 25th, 50th, 75th and 10th–90th percentiles, respectively, and means are shown as green “+” symbols. G, H HT1080 cells were cultured in the medium ± cystine or ± methionine in the absence or presence of SAM or Mito-TEMPO for 10–14 h. CC, 0.4 mM; Met, 0.4 mM; SAM, 0.4 mM; FIDAS-5, 5 μM; ADOX, 20 μΜ; Oligo, oligomycin, 1 μM for OCR and 10 μM for lipid ROS and cell death; FCCP, 2 μM; Rot, rotenone, 0.5 μM; AA, antimycin A, 0.5 μM; MT, Mito-TEMPO, 5 μM. n = 3 (BD) or n = 4 (G, H) biological replicates, data were represented as mean ± SD with p values determined by one-way ANOVA test (BD, FH). Source data are provided as a Source Data file.
Fig. 5
Fig. 5. Methylation-originated ubiquinone synthesis is implicated in ROS generation during ferroptosis.
A Schematic of key proteins in SAM-based ubiquinone synthesis pathway. B HT1080 cells were transfected with the GFP-tagged Mito-pHyPer plasmid for 48 h, and then cultured as indicated for another 8 h. The mean fluorescence intensities (MFI) of Mito-pHyPer were quantified. C–E HT1080 cells were cultured as indicate to quantify the cellular levels of ROS (C) at the 10 h, the cell death levels (D) at the 14 h and the UQ levels (E) at the 8 h. FI HT1080 cells were respectively transfected with siRNA targeting SLC25A26 (siSLC25A26-1/2 mixture), CoQ3 (siCoQ3-1/2 mixture) or CoQ5 (siCoQ5-1/2 mixture) for 48 h, and then cultured as indicated for another 8–14 h. (F) The UQ levels were detected at the 8 h. G, H The levels of cellular ROS and lipid ROS were determined at the 10 h. I The cell death levels were quantified at the 14 h. J HT1080 cells were transfected with SLC25A26 plasmid for 48 h, and then cultured in the medium ± cystine, ± methionine as indicated for another 14 h to quantify the cell death. The proteins of SLC25A26 and tubulin were determined by WB. KM HT1080 cells were co-transfected with SLC25A26 and Mito-pHyper for 48 h, and then cultured in the medium ± cystine, ± methionine in the absence or presence of Mito-TEMPO as indicated for another 8–10 h. K, L The UQ levels and the MFI of Mito-pHyper were respectively quantified at the 8 h. M The lipid ROS levels were determined at the 10 h. CC, 0.4 mM; Met, 0.4 mM; SAM, 0.4 mM; FIDAS-5, 5 μM; ADOX, 20 μM; AA, 10 μM; MT, 5 μM. For B-M, n = 3 biological replicates, data were represented as mean ± SD with p values determined by one-way ANOVA test. Source data are provided as a Source Data file.
Fig. 6
Fig. 6. SAM-dependent methylation synergizes with IKE in tumor growth suppression.
AC OS-RC-2 cells were cultured in the medium ± IKE, ± methionine, ± FIDAS-5, ± SAM, or ± ADOX as indicated for 24–30 h. A The cellular levels of ROS were respectively quantified at the 24 h. B The lipid ROS levels were determined at the 24 h. C The cell death levels were quantified at the 30 h. IKE, 2 μM; Met, 0.4 mM; SAM, 0.4 mM; FIDAS-5, 5 μM; ADOX, 20 μΜ. DF The effect of IKE combined with FIDAS-5, SAM, or ADOX on tumors. OS-RC-2 cells were injected into athymic nude mice. Eighteen days after tumor colonization, IKE (40 mg/kg), SAM (250 mg/kg) or ADOX (2 mg/kg) was injected intraperitoneally every 2 day, and FIDAS-5 (20 mg/kg) was injected intragastrically every 2 day. The xenograft tumors were sampled and photographed after 12 days. D The tumors dissected from the mice were photographed. Tumor volume (E) and tumor mass (F) were measured. G The PTGS2 mRNA level in tumor xenografts were determined by qPCR. H Representative immunohistochemical images of MDA, 4-HNE and Ki67 are shown. Scale bars, 10 μm; Representative images of TUNEL staining are shown. Scale bars, 10 μm. I, J, L Relative intensities of MDA, 4-HNE or Ki67 in tumor xenografts were calculated. K The TUNEL-positive ratios in tumor xenografts were calculated. n = 3 biological replicates (AC); n = 5 mice per group (E, F); n = 3 random samples from each tumor xenograft tissue of the five analyzed mice per group (G); n = 5 random fields from each tumor xenograft tissue of the five analyzed mice per group (IL); data were represented as mean ± SD with p values determined by one-way ANOVA test (AC, EG, IL). Source data are provided as a Source Data file.
Fig. 7
Fig. 7. Inhibition of methionine-SAM metabolic axis alleviates DOX-induced cardiomyopathy.
AD HL-1 cells were cultured ± methionine and simultaneously treated with DOX as indicated for 12 h. A The cellular levels of ROS were respectively quantified. B The lipid ROS levels were determined. C The PTGS2 mRNA levels were determined by qPCR. D The LDH levels were measured by kits. DOX, Doxorubicin, 4 μM; Met, 0.4 mM; FIDAS-5, 5 μM; Fer-1, 10 μM. E The mice were injected with DOX (10 mg/kg) only or combined with FIDAS-5 (20 mg/kg) or Fer-1 (1 mg/kg) as indicated for 4 days. The mice heart tissues were subjected to histological examination by HE-staining. Representative images were shown. Scale bars, 500 μm. F The LDH levels in mice serum were measured by kits. G The PTGS2 mRNA levels in mice heart tissues were determined by qPCR. H Representative immunohistochemical images of MDA and 4-HNE are shown. Scale bars, 10 μm; Representative images of TUNEL staining are shown. Scale bars, 10 μm. I Relative intensities of MDA and 4-HNE in mice heart were calculated. J TUNEL-positive ratios in mice heart were analyzed. n = 3 biological replicates (AD); n = 3 samples from each mouse serum of the three analyzed mice per group (F); n = 3 samples from each mouse heart tissue of the three analyzed mice per group (G); n = 9, three random fields from each mouse heart tissue of the three analyzed mice per group (I, J); data were represented as mean ± SD with p values determined by one-way ANOVA test (AD, F, G, I, J). Source data are provided as a Source Data file.

References

    1. Dixon, S. J. et al. Ferroptosis: an iron-dependent form of nonapoptotic cell death. Cell149, 1060–1072 (2012). - PMC - PubMed
    1. Gao, M., Monian, P., Quadri, N., Ramasamy, R. & Jiang, X. Glutaminolysis and transferrin regulate ferroptosis. Mol. Cell59, 298–308 (2015). - PMC - PubMed
    1. Friedmann Angeli, J. P. et al. Inactivation of the ferroptosis regulator Gpx4 triggers acute renal failure in mice. Nat. Cell Biol.16, 1180–1191 (2014). - PMC - PubMed
    1. Bao, W. D. et al. Loss of ferroportin induces memory impairment by promoting ferroptosis in Alzheimer’s disease. Cell Death Differ.28, 1548–1562 (2021). - PMC - PubMed
    1. Ashraf, A., Jeandriens, J., Parkes, H. G. & So, P. W. Iron dyshomeostasis, lipid peroxidation and perturbed expression of cystine/glutamate antiporter in Alzheimer’s disease: evidence of ferroptosis. Redox Biol.32, 101494 (2020). - PMC - PubMed

Publication types

LinkOut - more resources