. 2024 Oct 17;15(1):8960.
doi: 10.1038/s41467-024-53404-0.

OTUD5 promotes end-joining of deprotected telomeres by promoting ATM-dependent phosphorylation of KAP1S824

Affiliations

OTUD5 promotes end-joining of deprotected telomeres by promoting ATM-dependent phosphorylation of KAP1S824

Shiu Yeung Lam et al. Nat Commun. .

Abstract

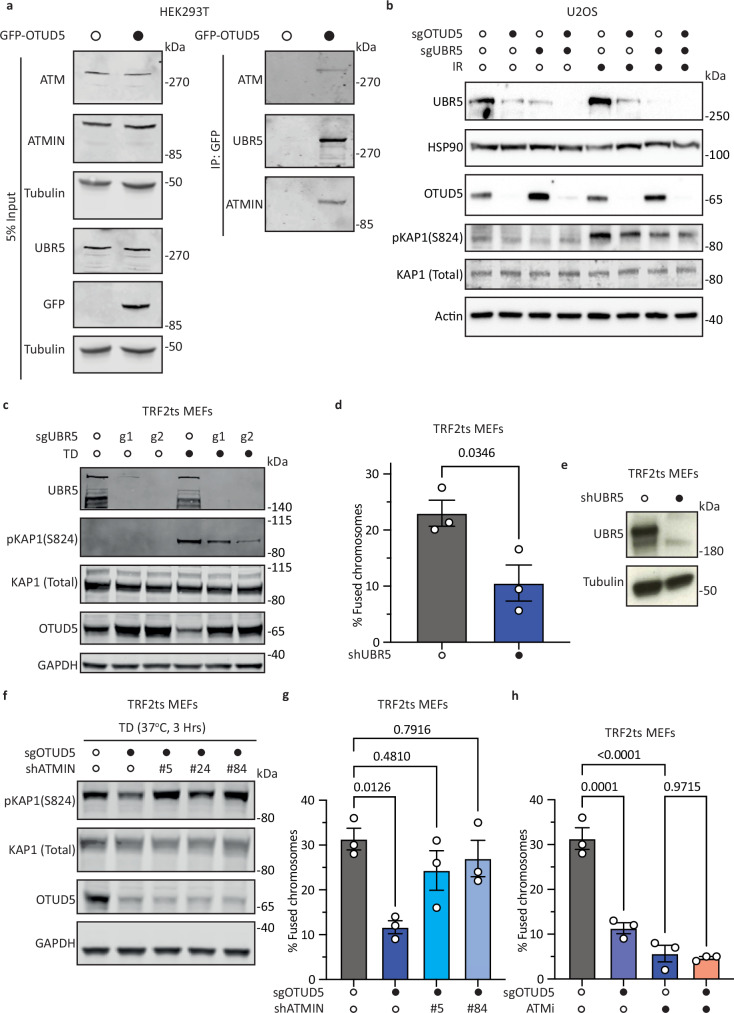
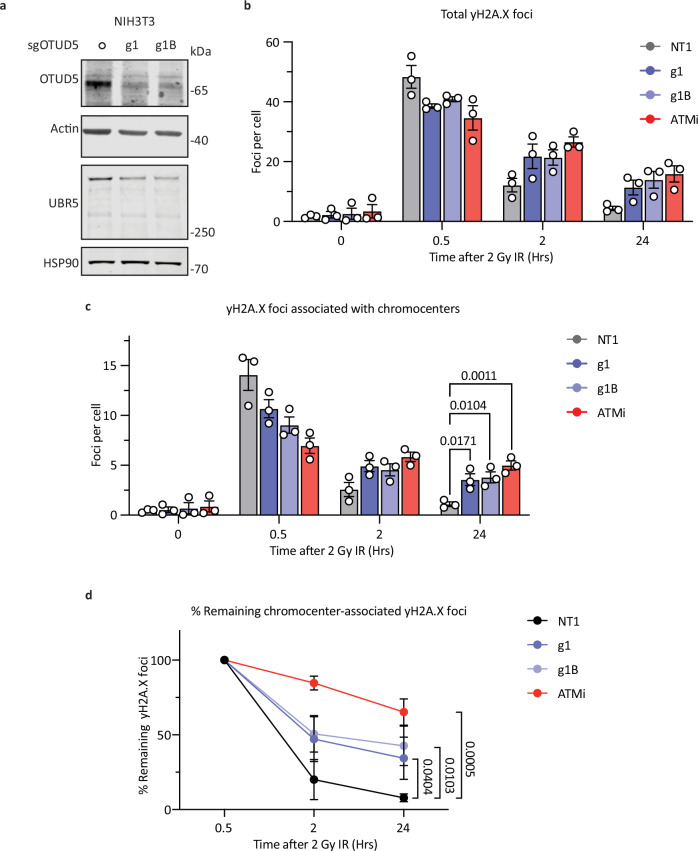
Appropriate repair of damaged DNA and the suppression of DNA damage responses at telomeres are essential to preserve genome stability. DNA damage response (DDR) signaling consists of cascades of kinase-driven phosphorylation events, fine-tuned by proteolytic and regulatory ubiquitination. It is not fully understood how crosstalk between these two major classes of post-translational modifications impact DNA repair at deprotected telomeres. Hence, we performed a functional genetic screen to search for ubiquitin system factors that promote KAP1S824 phosphorylation, a robust DDR marker at deprotected telomeres. We identified that the OTU family deubiquitinase (DUB) OTUD5 promotes KAP1S824 phosphorylation by facilitating ATM activation, through stabilization of the ubiquitin ligase UBR5 that is required for DNA damage-induced ATM activity. Loss of OTUD5 impairs KAP1S824 phosphorylation, which suppresses end-joining mediated DNA repair at deprotected telomeres and at DNA breaks in heterochromatin. Moreover, we identified an unexpected role for the heterochromatin factor KAP1 in suppressing DNA repair at telomeres. Altogether our work reveals an important role for OTUD5 and KAP1 in relaying DDR-dependent kinase signaling to the control of DNA repair at telomeres and heterochromatin.


Conflict of interest statement

The authors declare no competing interests.

Figures

Fig. 1
Fig. 1. ATD screen reveals ubiquitin system factors that promote KAP1S824 phosphorylation upon telomere deprotection.
a Schematic illustration of temperature-dependent telomere deprotection and telomeric DDR activation in TRF2ts MEFs. Created with BioRender.com released under a Creative Commons Attribution-NonCommercial-NoDerivs 4.0 International license (b) Assessment of pKAP1S824 in TRF2ts MEFs with (39 °C, 3 h) or without (32 °C) telomere deprotection by immunofluorescent staining of pKAP1S824 detected by FACS. c Assessment of pKAP1S824 in TRF2ts MEFs pretreated with DMSO or ATM inhibitor (ATMi), with (39 °C, 3 h) or without (32 °C) telomere deprotection. For ATM inhibition, cells were pretreated with 10 μM KU-55933 30 min before telomere deprotection. d. Assessment of pKAP1S824 in ATM-depleted TRF2ts MEFs (shATM) and control (shScr), with (39 °C, 3 h) or without (32 °C) telomere deprotection. e Workflow of the ATD screen. Created with BioRender.com released under a Creative Commons Attribution-NonCommercial-NoDerivs 4.0 International license. f Graphical representation of gene ranking of the ATD screen generated by MAGeCK-RRA analysis. A full list of hits and corresponding p-values is included in Supplementary Data 1. g Immunoblot analysis of pKAP1S824 in OTUD5-depleted TRF2ts MEFs (shOTUD5 #55/#56/#58) and control (shScramble), untreated or treated with telomere deprotection (TD; 39 °C, 3 h). Actin serves as loading control. Representative blot from three independent experiments. h Quantification of pKAP1S824 intensities in (g). Relative pKAP1 intensities were obtained by first correcting pKAP1S824 intensities to the respective total KAP1 levels, followed by a normalization to the corrected pKAP1S824 intensity in control (shScramble). Bars represent means ± SEM. Each dot represents one of three independent experiments. Statistical analysis was performed according to one-way ANOVA with Dunnett’s multiple comparisons test. i Immunoblot analysis of pKAP1S824 in OTUD5-depleted TRF2ts MEFs (sgOTUD5 g1/g1B) and control (sgNT1), untreated or treated with telomere deprotection (TD; 37 °C, 3 h). Actin serves as loading control. Representative blot from three independent experiments. j Quantification of pKAP1S824 intensities in (i). Relative pKAP1 intensities were obtained by first correcting pKAP1S824 intensities to the respective total KAP1 levels, followed by a normalization to the corrected pKAP1S824 intensity in control (sgNT1). Bars represent means ± SEM. Each dot represents one of three independent experiments. Statistical analysis was performed according to one-way ANOVA with Dunnett’s multiple comparisons test. Source data are provided as a Source Data file.
Fig. 2
Fig. 2. OTUD5 promotes KAP1S824 phosphorylation by enhancing ATM activation.
a Immunoblot analysis of pKAP1S824 levels in OTUD5-depleted U2OS (sgOTUD5 KO1/KO3) and control (sgNT1), untreated or treated with ionizing radiation (IR; 3 Gy, 30 min recovery at 37 °C). Actin serves as loading control. Representative blot from three independent experiments. b Quantification of pKAP1S824 intensity in (a). Relative pKAP1 intensities were obtained by first correcting pKAP1S824 intensities to the respective total KAP1 levels, followed by a normalization to the corrected pKAP1S824 intensity in control (sgNT1). Bars represent means ± SEM. Each dot represents one of three independent experiments. Statistical analysis was performed according to one-way ANOVA with Dunnett’s multiple comparisons test between samples. c Immunoblot analysis of pATMS1981 and downstream phospho-substrates of ATM in OTUD5-depleted U2OS (sgOTUD5 KO1/KO3) and control (sgNT1), untreated or treated with ionizing radiation (IR; 3 Gy, 30 min recovery at 37 °C). Actin and HSP90 serve as loading controls. Representative blot from three independent experiments. d Quantification of pATMS1981 intensity in (c). Relative pATMS1981 intensities were obtained by first correcting pATMS1981 intensities to the respective total ATM levels, followed by a normalization to the corrected pATMS1981 intensity in control (sgNT1). Bars represent means ± SEM. Each dot represents one of three independent experiments. Statistical analysis was performed according to one-way ANOVA with Dunnett’s multiple comparisons test between samples. e Immunoblot analysis of pKAP1S824 levels in control (sgNT1) and OTUD5-depleted (sgOTUD5 KO3) U2OS complemented with either empty-vector, wild-type OTUD5 (WT), phospho-dead mutant OTUD5S177A (SA) or catalytic-dead mutant OTUD5C224S (CS) delivered with pCDH-Puro expression vector. Cells were untreated or treated with ionizing radiation (IR; 3 Gy, 30 min recovery at 37 °C) as indicated. Actin serves as loading control. Representative blot from three independent experiments. f Quantification of pKAP1S824 intensity in (e). Relative pKAP1S824 intensities were obtained by first correcting pKAP1S824 intensities to the respective total KAP1 levels, followed by a normalization to the corrected pKAP1S824 intensity in control (sgNT1, IR-treated). Bars represent means ± SEM. Each dot represents one of three independent experiments. Statistical analysis was performed according to one-way ANOVA with Dunnett’s multiple comparisons test between samples. Source data are provided as a Source Data file.
Fig. 3
Fig. 3. OTUD5 promotes NHEJ and MMEJ preferentially at telomeres.
a Quantification of chromosome end-to-end fusions in control (sgNT1) and OTUD5-depleted (sgOTUD5 g1/g1B) TRF2ts MEFs with (37 °C, 36 h) or without (32 °C) telomere deprotection. For ATM inhibition (ATMi), cells were pretreated with 10 μM KU-55933 1 h before telomere deprotection. Bars represent means ± SEM. Each dot represents one of three independent experiments. Statistical analysis: one-way ANOVA with Dunnett’s multiple comparisons test. b Representative images from one of three independent replicates in (a). Scale bar represents 10 μm. c Quantification of chromosome fusions in control (sgNT1) and OTUD5-depleted (sgOTUD5 KO1/KO3) HeLa doxycycline-inducible shTRF2 cells with (6 days doxycycline, 2 µg/mL) or without (no doxycycline) telomere deprotection. For ATM inhibition (ATMi), cells were pretreated with 10 μM KU-55933 1 h before telomere deprotection. Bars represent means ± SEM. Each dot represents one of three independent experiments. Statistical analysis was performed according to one-way ANOVA with Dunnett’s multiple comparisons test between samples. d Assessment of chromosome fusions upon Cre-mediated TRF1 and TRF2 loss in OTUD5-depleted (sgOTUD5 g1/g1B) Trf1 f/f;Trf2 f/f;Ku70−/−;Cre-ERT2 MEFs treated with 0.5 μM 4-hydroxytamoxifen (4-OHT) for 108 h. For PARP inhibition (PARPi), cells were treated with 0.5 μM Olaparib 60 h before harvesting. The % fused chromosomes in each sample is normalized to control (sgNT1). Bars represent means ± SEM. Each dot represents one of three independent experiments. Statistical analysis: one-way ANOVA with Dunnett’s multiple comparisons test. e Immunoblot analysis of OTUD5 and UBR5 in Trf1 f/f;Trf2 f/f;Ku70−/−;Cre-ERT2 MEFs used in (d). Actin and HSP90 serve as loading controls for OTUD5 and UBR5 respectively. Representative blot from three independent experiments. f Assessment of NHEJ efficiency by random plasmid integration in control (sgNT1), OTUD5-depleted (sgOTUD5 KO1/KO3) and MAD2L2-depleted (shMAD2L2) U2OS cells. NHEJ scores in each sample are normalized to control (sgNT1). Bars represent means ± SEM. Each dot represents one of three independent experiments. Statistical analysis: one-way ANOVA with Dunnett’s multiple comparisons test. g Immunoblot analysis for OTUD5 and MAD2L2 in U2OS cells used in (f). Actin serves as loading control. Representative blot from three independent experiments. h Assessment of NHEJ efficiency (% BFP) in control (sgNT1), OTUD5-depleted (sgOTUD5 KO3), DNAPKi-treated (10 μM KU-57788) and ATMi-treated (10 μM KU-55933) DSB-Spectrum_V1 reporter HEK293T cells. Bars represent means ± SEM. Each dot represents one of three independent experiments. Statistical analysis: one-way ANOVA with Dunnett’s multiple comparisons test. Source data are provided as a Source Data file.
Fig. 4
Fig. 4. OTUD5-dependent promotion of KAP1S824 phosphorylation and telomere NHEJ are epistatic with the UBR5-ATMIN axis.
a Immunoblot analysis of ATM, ATMIN, and UBR5 levels upon immunoprecipitation of GFP-OTUD5 in HEK293T cells. Tubulin serves as loading control. Representative blot from three independent experiments. b Immunoblot analysis of pKAP1S824 levels in OTUD5-depleted (sgOTUD5 KO1), UBR5-depleted (sgUBR5 KO1), OTUD5/UBR5 double-depleted and control (sgNT1) U2OS cells, untreated or treated with ionizing radiation (IR; 3 Gy, 30 min recovery at 37 °C). Actin serves as loading control for KAP1 and OTUD5. HSP90 serves as loading control for UBR5. Representative blots from three independent experiments. c Immunoblot analysis of pKAP1S824 levels in UBR5-depleted (sgUBR5 g1/g2) and control (sgNT1) TRF2ts MEFs with (37 °C, 3 h) or without (32 °C) telomere deprotection. GAPDH serves as loading control. Representative blots from three independent experiments. d Quantification of chromosome fusions in control (shScramble) and UBR5-depleted (shUBR5) TRF2ts MEFs, with (37 °C, 36 h) telomere deprotection. Bars represent means ± SEM. Each dot represents one of three independent experiments. Statistical analysis was performed according to unpaired two-tailed Student’s t-test between samples as indicated. e Immunoblot validation of UBR5 depletion (shUBR5) in TRF2ts MEFs used in (d). Tubulin serves as loading control. Representative blot from three independent experiments. f Immunoblot analysis of pKAP1S824, KAP1 and OTUD5 in control TRF2ts MEFs (sgNT1) and OTUD5-depleted TRF2ts MEFs (sgOTUD5 g1b) with or without ATMIN depletion (shATMIN #5/#24/#84) and subjected to telomere deprotection. GAPDH serves as loading control. Representative blots from three independent experiments. g Quantification of chromosome fusions in control (sgNT1) and OTUD5-depleted (sgOTUD5 g1b) TRF2ts MEFs with or without ATMIN depletion (shATMIN #5/#84) and subjected to telomere deprotection (37 °C, 36 h). Bars represent means ± SEM. Each dot represents one of three independent experiments. Statistical analysis: one-way ANOVA with Dunnett’s multiple comparisons test. h Quantification of chromosome fusions in control (sgNT1), OTUD5-depleted (sgOTUD5 g1b) TRF2ts MEFs with (37 °C, 36 h) or without (32 °C) telomere deprotection. For ATM inhibition, cells were pretreated with 10 μM KU-55933 30 min before telomere deprotection. Bars represent means ± SEM. Each dot represents one of three independent experiments. Statistical analysis: one-way ANOVA with Dunnett’s multiple comparisons test. Source data are provided as a Source Data file.
Fig. 5
Fig. 5. OTUD5 promotes end-joining at deprotected telomeres in a KAP1 and pKAP1S824-dependent manner.
Quantification of average 53BP1 (a) or RIF1 (b) telomere dysfunction-induced foci (TIFs) per cell in OTUD5-depleted TRF2ts MEFs (sgOTUD5 g1/g1B), untreated or treated with telomere deprotection (37 °C, 3 h), compared to control (sgNT1) and ATM inhibitor (10 μM KU-55933)-treated cells. For ATM inhibition, cells were pretreated with 10 μM KU-55933 30 min before telomere deprotection. Statistical analysis was performed according to one-way ANOVA with Dunnett’s multiple comparisons test. Each dot represents a data point from three independent experiments. Assessment of telomere fusions in OTUD5-depleted TRF2ts MEFs (sgOTUD5 g1B) with or without KAP1 depletion. c Immunoblot validation of KAP1 and OTUD5 depletion in TRF2ts MEFs used in (d). Actin serves as loading control. Representative blots from three independent experiments. d Quantification of chromosome fusions in control (sgNT1), OTUD5-depleted, KAP1-depleted, and OTUD5-KAP1 double depleted TRF2ts MEFs upon telomere deprotection at 37 °C for 36 h. Bars represent means ± SEM. Each dot represents one of three independent experiments. Statistical analysis was performed according to unpaired two-tailed Student’s t-test between paired samples as indicated. e, f Assessment of telomere fusions in OTUD5-depleted TRF2ts MEFs (sgOTUD5 g1B) with or without complementation of pLX304-V5-KAP1 (wildtype (WT) or S824D). e Immunoblot validation of OTUD5 depletion and V5-KAP1 (wildtype (WT) or S824D) overexpression in TRF2ts MEFs used in (f). Actin serves as loading control. Representative blots from three independent experiments. f Quantification of chromosome fusions in control (sgNT1), OTUD5-depleted (sgOTUD5 g1b) TRF2ts MEFs with or without complementary expression of V5-KAP1 (wildtype (WT) or S824D (SD)) upon telomere deprotection at 37 °C for 36 h. Bars represent means ± SEM. Each dot represents one of three independent experiments. Statistical analysis was performed according to one-way ANOVA with Dunnett’s multiple comparisons test. g Quantification of chromosome fusions in control (sgNT1), OTUD5-depleted (sgOTUD5 g1b) Trf1 f/f;Trf2 f/f;Ku70−/−;Cre-ERT2 MEFs with or without complementary expression of V5-KAP1 (wildtype (WT) or S824D (SD)) upon telomere deprotection by treatment with 0.5 μM 4-OHT for 108 h. Bars represent means ± SEM. Each dot represents one of three independent experiments. Statistical analysis was performed according to one-way ANOVA with Dunnett’s multiple comparisons test between samples. Source data are provided as a Source Data file.
Fig. 6
Fig. 6. OTUD5 promotes DNA repair at heterochromatin.
a Immunoblot validation of OTUD5 depletion (sgOTUD5 g1/g1B) in NIH3T3 cells used in (bd). Actin serves as loading control. bd Assessment of rates of resolution of IR-induced γH2A.X foci (total/chromocenter-associated) in OTUD5-depleted NIH3T3. b Quantification of total γH2A.X foci in control (sgNT1), OTUD5-depleted (sgOTUD5 g1/g1B) and ATM inhibitor-treated (ATMi, KU-55933, 10 μM, treated 30 min before IR) cells at 0 (untreated), 0.5, 2, 24 h after IR (2 Gy). Bars represent means ± SEM. Each dot represents one of three independent experiments. c Quantification of chromocenter-associated γH2A.X foci in control (sgNT1), OTUD5-depleted (sgOTUD5 g1/g1B) and ATM inhibitor-treated (ATMi; 10 μM KU-55933) cells at 0 (untreated), 0.5, 2, 24 h after IR (2 Gy). Bars represent means ± SEM. Each dot represents one of three independent experiments. Statistical analysis was performed according to two-way ANOVA with Dunnett’s multiple comparisons test. d Quantification of the percentage of chromocenter-associated γH2A.X foci remaining in control (sgNT1), OTUD5-depleted (sgOTUD5 g1/g1B) and ATM inhibitor-treated (ATMi; 10 μM KU-55933) cells at 0.5, 2, 24 h after IR (2 Gy), individually normalized to the respective amount of chromocenter-associated γH2A.X foci at 0.5 h after IR (2 Gy). Bars represent means ± SEM. Statistical analysis was performed according to two-way ANOVA with Dunnett’s multiple comparisons test. Source data are provided as a Source Data file.

References

    1. Hanahan, D. & Weinberg, R. A. Hallmarks of cancer: the next generation. Cell144, 646–674 (2011). - PubMed
    1. Maciejowski, J. & de Lange, T. Telomeres in cancer: tumour suppression and genome instability. Nat. Rev. Mol. Cell Biol.18, 175–186 (2017). - PMC - PubMed
    1. Shay, J. W. & Wright, W. E. Hayflick, his limit, and cellular ageing. Nat. Rev. Mol. Cell Biol.1, 72–76 (2000). - PubMed
    1. Karlseder, J., Smogorzewska, A. & de Lange, T. Senescence induced by altered telomere state, not telomere loss. Science295, 2446–2449 (2002). - PubMed
    1. Denchi, E. L. & de Lange, T. Protection of telomeres through independent control of ATM and ATR by TRF2 and POT1. Nature448, 1068–1071 (2007). - PubMed

Publication types

MeSH terms

LinkOut - more resources