. 2024 Dec;43(23):5857-5882.
doi: 10.1038/s44318-024-00271-6. Epub 2024 Oct 17.

Macropinocytosis mediates resistance to loss of glutamine transport in triple-negative breast cancer

Affiliations

Macropinocytosis mediates resistance to loss of glutamine transport in triple-negative breast cancer

Kanu Wahi et al. EMBO J. 2024 Dec.

Abstract

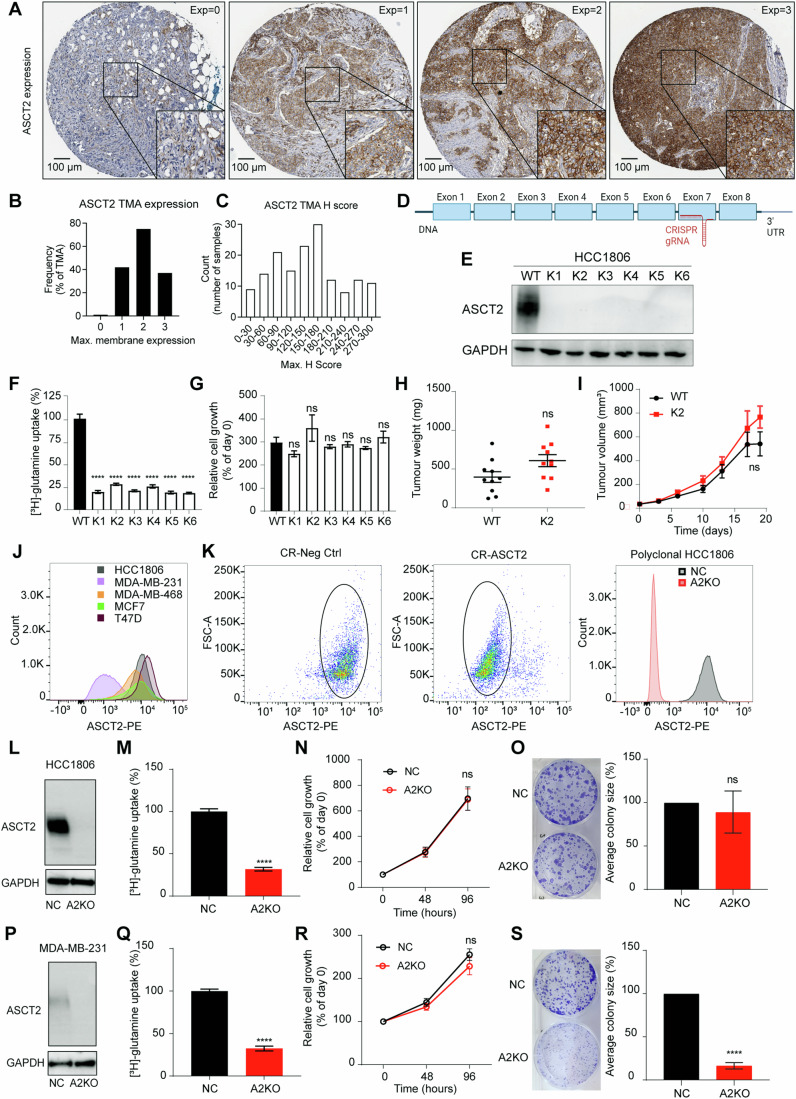
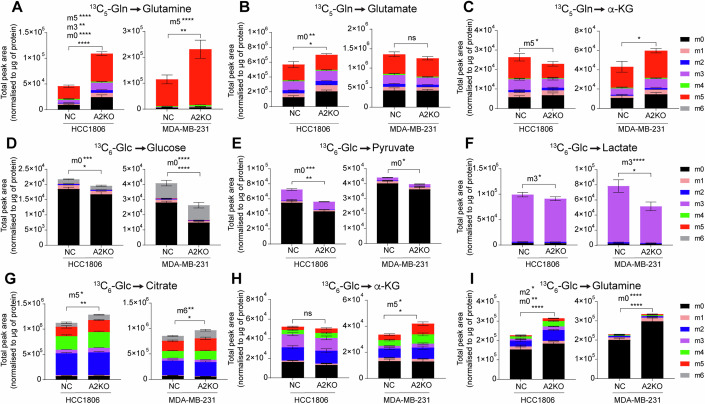
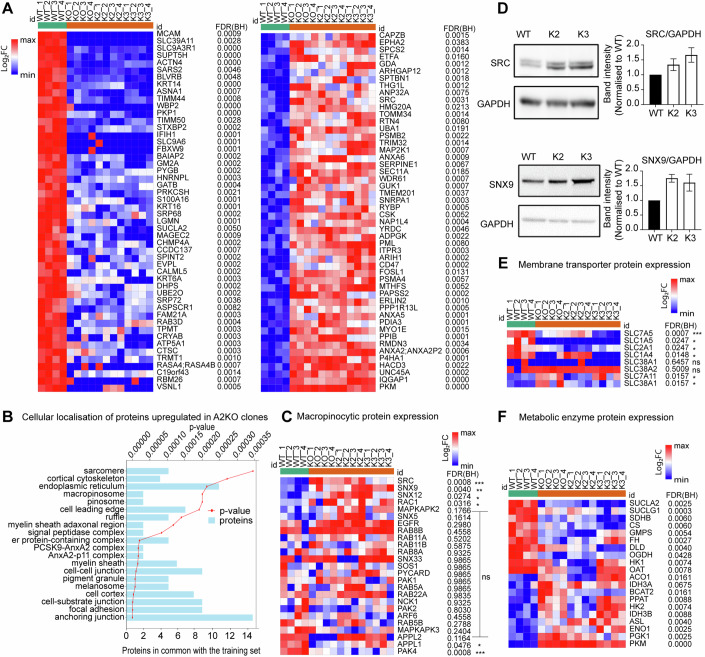
Triple-negative breast cancer (TNBC) metabolism and cell growth uniquely rely on glutamine uptake by the transporter ASCT2. Despite previous data reporting cell growth inhibition after ASCT2 knockdown, we here show that ASCT2 CRISPR knockout is tolerated by TNBC cell lines. Despite the loss of a glutamine transporter and low rate of glutamine uptake, intracellular glutamine steady-state levels were increased in ASCT2 knockout compared to control cells. Proteomics analysis revealed upregulation of macropinocytosis, reduction in glutamine efflux and increased glutamine synthesis in ASCT2 knockout cells. Deletion of ASCT2 in the TNBC cell line HCC1806 induced a strong increase in macropinocytosis across five ASCT2 knockout clones, compared to a modest increase in ASCT2 knockdown. In contrast, ASCT2 knockout impaired cell proliferation in the non-macropinocytic HCC1569 breast cancer cells. These data identify macropinocytosis as a critical secondary glutamine acquisition pathway in TNBC and a novel resistance mechanism to strategies targeting glutamine uptake alone. Despite this adaptation, TNBC cells continue to rely on glutamine metabolism for their growth, providing a rationale for targeting of more downstream glutamine metabolism components.

Keywords: ASCT2; Glutamine Metabolism; Macropinocytosis; Metabolomics; Triple-Negative Breast Cancer.


Conflict of interest statement

Disclosure and competing interests statement. The authors declare no competing interests.

Figures

Figure 1
Figure 1. Growth adaption observed in TNBC cells to the loss of ASCT2.
(A) Tissue microarray analysis (TMA) for ASCT2 (HPA035240, 1:2000, Sigma) protein expression in triple-negative breast cancer (TNBC) sections from 155 patients were scored based on the staining intensity from 0 to 3 as shown by the representative images. (B) ASCT2 expression scores for 154 samples were between 1 and 3, and only one sample scored 0, indicating no ASCT2 protein expression. (C) TMA H-score shows the spread of ASCT2 expression across samples. (D) Schematic for SLC1A5 gene (ASCT2) showing 8 exons (boxes), introns (lines), as well as the CRISPR guide target (not to scale). (E) Western blot expression of ASCT2 (CST #8057S, 60–80 kDa) and GAPDH protein (Abcam #ab8245, 37 kDa) in HCC1806 wildtype (WT) and ASCT2 knockout single-cell clones (K1–6) showed complete loss of ASCT2 expression. (F) [3H]-L-glutamine uptake in HCC1806 WT and K1–K6 ASCT2 KO cell lines. Error bars are mean ± SEM from three independent experiments. Asterisks indicate p values, ****p < 0.0001 from a one-way ANOVA with Dunnett’s multiple comparisons test. (G) Relative cell growth was measured by MTT assay in HCC1806 WT and K1–K6 ASCT2 KO cell lines after 3 days of cell growth and normalised to the respective day 0 MTT quantification for each cell line. Error bars are mean ± SEM from three independent experiments. No significant (ns) difference between WT and K1–K6 from a one-way ANOVA with Dunnett’s multiple comparisons test. (H, I) HCC1806 orthotopic xenograft model tumour weights (endpoint) and tumour volume over time. Ten tumours per cohort (n = 5 mice/group, 2 tumours per mouse) with no significant (ns) difference from an unpaired T-test (J) Histogram of ASCT2 surface expression in breast cancer cell lines, analysed by flow cytometry. Cells were stained with primary antibody anti-ASCT2 antibody (MedImmune) and secondary antibody goat anti-human IgG Fc-PE secondary antibody (Invitrogen). (K) Sorting strategy for HCC1806 cells transfected with CRISPR CR-Neg Ctrl (non-targeted control; NC) or CR-ASCT2 based on ASCT2 surface expression and post-sort histogram of ASCT2 expression in expanded polyclonal HCC1806 NC and A2KO cells. (L, P) Polyclonal HCC1806 and MDA-MB-231 NC and A2KO cell lines were assessed by western blot for ASCT2 protein (CST #8057S, 60–80 kDa) with GAPDH protein (Abcam #ab8245, 37 kDa) as a loading control. (M, Q) Cell uptake of 100 nM [3H]-l-glutamine over 30 min. Error bars are mean ± SEM from three independent experiments. ****p < 0.0001 from an unpaired T-test. (N, R) Cells were seeded at a density of 2 × 103 (HCC1806) and 5 × 103 (MDA-MB-231) per well, with cell growth measured via CCK8 assay, normalised to day 0. Error bars are mean ± SEM from three independent experiments. No significant (ns) difference between NC and A2KO determined by two-way ANOVA. (O, S) Colony formation assay (CFA) in a six-well plate at 1 × 103 cells (HCC1806) and 2.5 × 103 cells (MDA-MB-231) per well, fixed and stained with 0.5% crystal violet after 12–14 days. Error bars are mean ± SEM from three independent experiments with ns (O) and ****p < 0.0001 (S) from unpaired T-tests. Source data are available online for this figure.
Figure 2
Figure 2. Glutamine oxidation is altered in HCC1806 A2KO cells.
Modified Seahorse XF assay was used to determine oxygen consumption rate (OCR) and extracellular acidification rate (ECAR) for HCC1806 (AH) and MDA-MB-231 (IL) polyclonal NC and A2KO cells. (A) OCR was measured in HCC1806 cells over 14 min in complete media or media lacking glutamine, ****p < 0.0001 (BD) Seahorse assay was carried out in glutamine-free media, with sequential acute injection of 2 mM glutamine, followed by 3 μM BPTES (glutaminase inhibitor) and finally 50 mM 2-DG (glycolysis inhibitor). OCR (B) was measured, and OCR at baseline (first three readings) was compared to post glutamine injection (readings 5 and 6; C), p values for (C) ****p < 0.0001, **p = 0.0059. ECAR (D) was used to measure glycolysis at each time point. (E) OCR was measured in HCC1806 cells over 14 min in complete media or media lacking glucose, ****p < 0.0001, ***p = 0.002. (FH) Seahorse assay was carried out in glucose-free media, with a sequential acute injection of 11.1 mM glucose, followed by 3 μM BPTES (glutaminase inhibitor) and finally 50 mM 2-DG (glycolysis inhibitor). OCR (F) was measured, and OCR at baseline (first three readings) was compared to post glucose injection (readings 5 and 6; G), p values for (G) ****p < 0.0001. ECAR (H) was used to measure glycolysis at each time point. (I) OCR was measured in MDA-MB-231 cells over 14 min in complete media or media lacking glutamine, ***p = 0.0007, **p = 0.0079. (JL) Seahorse assay was carried out in glutamine-free media, with a sequential acute injection of 2 mM glutamine, followed by 3 μM BPTES (glutaminase inhibitor) and finally 50 mM 2-DG (glycolysis inhibitor). OCR (J) and ECAR (K) were measured at each time point. ECAR (L) was measured in MDA-MB-231 cells over 14 min in complete media or media lacking glutamine, p values for (L) *p = 0.0343. Data are mean ± SEM from three independent experiments with 4–6 repeats per treatment, analysed by one-way ANOVA with Šídák’s multiple comparisons test (ns not significant). Source data are available online for this figure.
Figure 3
Figure 3. Glutamine uptake and de novo glutamine synthesis were higher in HCC1806 A2KO cells.
(AC) Metabolomics was used to trace 13C5-glutamine (13C5-Gln) carbons in polyclonal HCC1806 and MDA-MB-231 NC and A2KO cells. The total peak area of intracellular glutamine, glutamate and α-KG derived from 13C5-glutamine were detected by LC-MS at 24 h. p values for differences between NC and A2KO cells for (A) glutamine in HCC1806 ****p < 0.0001, m0 ****p < 0.0001, m3 **p = 0.009, m5 ****p < 0.0001 and MDA-MB-231 ** p = 0.0044, m5 ****p < 0.0001, (B) glutamate in HCC1806 *p = 0.0197, m0 **p = 0.0041 and MDA-MB-231 not significant (ns) for all, (C) α-KG in HCC1806 m5 *p = 0.0153 and MDA-MB-231 *p = 0.0226. (DI) Metabolomics was used to trace 13C6-glucose (13C6-Glc) carbons in polyclonal HCC1806 and MDA-MB-231 NC and A2KO cells. p values for differences between NC and A2KO cells for (D) glucose in HCC1806 *p = 0.0440, m0 ***p = 0.0002 and MDA-MB-231 ****p < 0.0001, m0 ****p < 0.0001, (E) pyruvate in HCC1806 **p = 0.0025, m0 ***p = 0.0002 and MDA-MB-231 m0 *p = 0.0477, (F) lactate in HCC1806 m3 *p = 0.0428 and MDA-MB-231 *p = 0.0114, m3 ****p < 0.0001, (G) citrate in HCC1806 **p = 0.0018, m5 *p = 0.0489 and MDA-MB-231 *p = 0.0265, m6 **p = 0.0088, (H) α-KG in HCC1806 ns for all and MDA-MB-231 *p = 0.0452, m5 *p = 0.0224, (I) glutamine in HCC1806 ****p < 0.0001, m0 **p = 0.0062, m2 *p = 0.0145 and MDA-MB-231 ****p < 0.0001 and m0 ****p < 0.0001. The total peak area of intracellular glucose, pyruvate, lactate, citrate, α-KG and glutamine were detected by LC-MS at 24 h. Mass of the unlabelled metabolite (12C = m0), which changes with integration with 13C-labelled carbons, where (m#) indicates a metabolite with # of carbons labelled with 13C. (m0) isotopologue denotes that all carbons of the metabolite are 12C, and the metabolite is unlabelled. (m5) isotopologue signifies that five carbons are 13C isotopes (13C5-Gln). (m6) isotopologue signifies that 6 carbons are 13C isotopes (13C6-Glc). The total peak area was normalised to μg of protein for each sample. Error bars are mean ± SEM from three independent experiments performed in duplicate, analysed by two-way ANOVA. Where isotopologues are listed with asterisks, the unlisted isotopologues are ns. Source data are available online for this figure.
Figure 4
Figure 4. Macropinocytic and glycolytic proteins are upregulated in HCC1806 A2KO cells.
(A) Heatmaps for the top 50 differentially upregulated and downregulated proteins in three single-cell ASCT2 knockout clones (KO, K2 and K3) compared to HCC1806 WT, generated using Morpheus online software (Broad). Protein expression between WT and the 3 KO clones (n = 4 biological replicates) was analysed by unpaired t-test, and all listed proteins were statistically significant (FDR, false discovery rate). (B) Cellular localisation of the top 50 upregulated proteins in the KOs was determined using Toppfun online portal where proteins in common with the annotated proteins in each cellular compartment are shown as blue bars and the p value (red) represents the probability that the upregulated proteins shared with the annotated list are occurring by chance. The first 20 cellular compartments with the lowest p values are shown as determined by “Bonferroni” for the multiple correction method at 0.05 cut-off level for significance. (C) Heatmap for expression of proteins involved in macropinocytosis where asterisks indicate p value from unpaired t-test (*p ≤ 0.05, **p ≤ 0.01, ***p ≤ 0.001, ns is not significant). (D) Western blots for SRC (CST #2108S, ~60 kDa) and SNX9 (Abcam #ab181856, ~70 kDa) with GAPDH loading control (Abcam #ab8245, 37 kDa) and quantification of band intensity. Data are mean ± SEM band intensities from five independently collected lysates. (E, F) Heatmaps for expression of proteins involved in amino acid and glucose transport where all listed proteins are statistically significant (E) and metabolic enzymes involved in glutamine and glucose metabolism (F) where asterisks indicate p value from unpaired t-test (*p ≤ 0.05, ***p ≤ 0.001, ns is not significant). A relative colour scheme is used for heatmaps (A, C, E, F) where minimum (blue) and maximum (red) values in each row are converted to colours (https://software.broadinstitute.org/morpheus/). Source data are available online for this figure.
Figure 5
Figure 5. Macropinocytosis is induced by the loss of ASCT2 in HCC1806 but not in MDA-MB-231.
(A) Uptake of TMR-dextran (red) in HCC1806 shCtrl and ASCT2 KD, and WT and ASCT2 KO single-cell clones. Nuclei were visualised with Hoescht fluorescent stain (blue). The scale bar in white (K6 panel) is equivalent to 10 μM. shCtrl and KD were pre-incubated for 72 h in media + 1 μg/mL dox (as indicated) prior to uptake. Quantification of macropinocytic index in HCC1806 cell lines is macropinocytosis/cell (area of macropinosomes/number of cells in the field; SEM from 9–12 fields across three separate experiments). Asterisks indicate p value from a one-way ANOVA with Dunnett’s multiple comparisons test with WT and K1 ***p = 0.0003, WT and K4 ***p = 0.0004, WT and K3, K5, K6 ****p < 0.0001. (B) Western blot of pAKT (S473) protein (CST #9271, 60 kDa), Akt (CST #9272, 60 kDa) and GAPDH protein (Abcam #ab8245, 37 kDa) as a loading control in HCC1806 WT and single-cell ASCT2 KO clones. Representative images from two independent repeats are shown. (CE) Uptake of TMR-dextran (red) in polyclonal HCC1806, MDA-MB-231 and MDA-MB-468 NC and A2KO cell lines. Nuclei were visualised with Hoescht fluorescent stain (blue). The scale bar in white is equivalent to 10 μM. Quantification of macropinocytic index in A2KO cell lines is macropinocytosis/cell (area of macropinosomes/number of cells in the field) and normalised to NC cells. Data are mean ± SEM of indices calculated from five fields of view from three (D, E) or four (C) independent experiments. Asterisks indicate p value from an unpaired T-test comparing NC and A2KO cells in (C) HCC1806 **p = 0.0059 and (D, E) MDA-MB-231 and MDA-MB-468 ns (not significant). Source data are available online for this figure.
Figure 6
Figure 6. ASCT2 impairs growth in the non-macropinocytic breast cancer cell line, HCC1569.
(A) Western blot of ASCT2 protein (CST #8057S, 60–80 kDa) and GAPDH protein (Abcam #ab8245, 37 kDa) as a loading control in polyclonal HCC1569 (Her2+ cell line) NC and A2KO cell lines. (B) Uptake of 100 nM [3H]-glutamine in HCC1569 NC and A2KO cell lines over 30 min. Error bars are mean ± SEM from three independent experiments. ****p < 0.0001 from an unpaired T-test. (C) Growth of HCC1569 cells seeded at a density of 1 × 104 cells per well in a 12-well plate, measured by live cell imaging (IncuCyte® S3) over 240 h. Error bars are mean ± SEM from three independent experiments, each containing a single well due to limited cell numbers. ****p < 0.0001 from an unpaired T-test. (D) Colony formation assay (CFA) for HCC1569 cells in a six-well plate, fixed and stained with 0.5% crystal violet after 12–14 days. Error bars are mean ± SEM from three independent experiments. ****p < 0.0001 from an unpaired T-test. (E) Representative images of uptake of TMR-dextran (red) in HCC1569 NC and A2KO cells, and nuclei were visualised with Hoescht fluorescent stain (blue) from >5 fields of view across three independent experiments. The scale bar in white is equivalent to 10 μM. (F) Raw macropinocytic index across breast cancer cell lines. Error bars are mean ± SEM from three independent experiments. Data in (F) are mean ± SEM of indices calculated from >5 fields of view across three independent experiments. Source data are available online for this figure.
Figure EV1
Figure EV1. ASCT2 knockout in additional breast cancer cell lines, relates to Fig. 1.
(A) MTT assays for polyclonal HCC1806 NC and A2KO cells cultured in various glutamine concentrations with dialysed FBS (dFBS; 10% v/v). Mean ± SEM from three independent experiments performed in triplicate and analysed by two-way ANOVA; ns is not significant. (BM) Polyclonal MDA-MB-468 (BE), MCF7 (FI) and T47D (JM) NC and A2KO cell lines were generated by CRISPR. (B, F, J) Western blot for ASCT2 protein (CST #8057S, 60–80 kDa), with GAPDH protein (Abcam #ab8245, 37 kDa) as a loading control. (C, G, K) Uptake of 100 nM [3H]-l-glutamine over 30 min, mean ± SEM from three independent experiments in triplicate and analysed by unpaired T-test where ****p < 0.0001. (D, H, L) CCK8 growth assays over 96 h, measured at timepoints indicated and normalised to the day 0 reading. Cells were seeded at a density of 5 × 103 (MDA-MB-468) and 1 × 104 (MCF7 and T47D) per well. Mean ± SEM from three independent experiments performed in triplicate and analysed by two-way ANOVA where ns is not significant. (E, I, M) Colony formation assay (CFA) in a six-well plate at 2.5 × 103 cells (MDA-MB-468) and 5 × 103 cells (MCF7 and T47D) per well, fixed and stained with 0.5% crystal violet after 12–14 days. Mean ± SEM from three independent experiments in triplicate and analysed by unpaired T-test where ****p < 0.0001 (E) and ns (I, M). (N) Schematic for SLC1A5 gene (ASCT2) and CRISPR guide RNA (red) targeting exon 4. The image is not to scale. Polyclonal HCC1806 NC#2 and A2KO#2 cells generated with exon 4 guide RNA and assessed for (O) ASCT2 expression with GAPDH as control by western blot, (P) [3H]-l-glutamine uptake over 30 min, mean ± SEM from three independent experiments in triplicate and analysed by unpaired T-test where ****p < 0.0001 and (Q) cell growth (relative to day 0) over 96 h by CCK8 assay, data are mean ± SEM from three independent experiments performed in triplicate and analysed by two-way ANOVA where ns is not significant.
Figure EV2
Figure EV2. Rate of glycolysis appears to be lower in MDA-MD-231 A2KO cells, relates to Fig. 2.
(A) OCR was measured in MDA-MB-231 cells over 14 min in complete media or media lacking glucose, **p = 0.0067, *p = 0.0230. (B) Seahorse assay was carried out in MDA-MB-231 cells, and OCR was measured in glucose-free media, with sequential acute injection of 25 mM glucose, followed by 3 μM BPTES (glutaminase inhibitor) and finally 50 mM 2-DG (glycolysis inhibitor). (C) ECAR was measured in MDA-MB-231 cells over 14 min in complete media or media lacking glucose, **p = 0.0044, ****p < 0.0001. (D) Seahorse assay was carried out in MDA-MB-231 cells, and ECAR was measured in glucose-free media, with a sequential acute injection of 25 mM glucose, followed by 3 μM BPTES (glutaminase inhibitor) and finally 50 mM 2-DG (glycolysis inhibitor). Data are mean ± SEM from three independent experiments in triplicate, analysed by one-way ANOVA with Šídák’s multiple comparisons test (ns not significant).
Figure EV3
Figure EV3. TCA metabolite levels remain predominantly unchanged in A2KO cells, relates to Fig. 3.
(A) Schematic for tracing 13C5-glutamine or 13C6-glucose carbons through glycolysis and the TCA cycle in polyclonal HCC1806 and MDA-MB-231 NC and A2KO cells. (BE) Total peak area of 13C6-glucose (13C6-Glc) derived TCA metabolites succinate (B), fumarate (C) and malate (D) as well as glutamate (E) were detected by LC-MS at 24 h. p values for differences between NC and A2KO cells for (B) succinate in HCC1806 m0 *p = 0.0344 and MDA-MB-231 not significant (ns) for all, (D) fumarate in HCC1806 ns for all and MDA-MB-231 m0 *p = 0.0111, (D) malate in HCC1806 ns for all and MDA-MB-231 m0 ****p < 0.0001, (E) glutamate in HCC1806 ***p = 0.0006, m0 ****p < 0.0001 and MDA-MB-231 ns for all. Mass of the unlabelled metabolite (12C = m0), which changes with integration with 13C-labelled carbons, where (m#) indicates a metabolite with # of carbons labelled with 13C. Isotopologue (m0) denotes that all carbons of the metabolite are 12C, and the metabolite is unlabelled. Isotopologue (m6) signifies that six carbons are 13C isotopes (13C6-Glc). The total peak area was normalised to μg of protein for each sample. Error bars are mean ± SEM from three independent experiments performed in duplicate analysed by two-way ANOVA. Where isotopologues are listed with asterisks, the unlisted isotopologues are ns.
Figure EV4
Figure EV4. Macropinocytic and transporter mRNA expression heatmaps and effects of ASCT2 shRNA knockdown in HCC1806, relates to Fig. 4.
(A, B) Differentially expressed genes from RNA-seq relevant to macropinocytosis and membrane transport in HCC1806 cells. All data were normalised and log2-transformed, and a pseudocount of 0.1 was applied in DESeq2 v1.26.0 software. DESeq2 was also used to select differentially expressed genes (‘DEGs’) HCC1806 WT and each HCC1806 ASCT2 knockout clones (KO and K1–K6) (n = 2 biological replicates). A relative colour scheme is used for heatmaps (A, C, E, F) where minimum (dark brown) and maximum (beige) values in each row are converted to colours (https://software.broadinstitute.org/morpheus/). (C) Western blot of ASCT2 protein (CST #8057S, 60–80 kDa) and GAPDH protein (Abcam #ab8245, 37 kDa) as a loading control in HCC1806 cell lines stably transfected with shCtrl and shASCT2 after 72 h pre-incubation in dox. Cells were maintained in tetracycline-free media ±1 μg/mL dox (as indicated by -/+ dox). (D) Uptake of 100 nM [3H]-glutamine in HCC1806 cell lines over 30 min, after 72 h pre-incubation in dox, mean ± SEM from three independent experiments in triplicate and analysed by unpaired t-test where ****p < 0.0001. (E) CCK8 assay of HCC1806 cell lines measured at timepoints indicated ± dox. Cells were seeded at a density of 1 × 103 cells per well and grown in dox for the duration of the CCK8 assay where mean ± SEM from three independent experiments performed in triplicate and analysed by two-way ANOVA where *p = 0.0428. (F) Growth of HCC1806 cell lines measured by live cell imaging (IncuCyte® S3) over 168 h, at 3 h intervals. Cells were seeded at a density of 1 × 103 cells per well and grown ± dox for the duration of the assay, data are mean ± SEM from three independent experiments performed in triplicate and analysed by two-way ANOVA where **p = 0.0034. (G) Heatmap of concordantly enriched pathways comparing ASCT2 knockdown (KD) and ASCT2 KO (KO), where P indicates hypergeometric p value for enrichment computed in Metascape.
Figure EV5
Figure EV5. AMPK and Akt phosphorylation is higher in HCC1806 A2KO cells, relates to Fig. 5.
(A) Western blot of pAMPK protein (CST #2535, 62 kDa), AMPK (CST #5831, 62 kDa) and GAPDH protein (Abcam #ab8245, 37 kDa) and pAKT (S473) protein (CST #9271, 60 kDa), Akt (CST #9272, 60 kDa) and GAPDH protein (Abcam #ab8245, 37 kDa) as a loading control in polyclonal HCC1806 NC and A2KO cell lines. Representative image from two to three independent repeats is shown. (B) CCK8 assays for HCC1806 WT, K2 and K3 ASCT2 KO cell lines cultured in low glutamine conditions with dialysed FBS (dFBS; 10% v/v) ±5% fatty acid-free BSA. Mean ± SEM from four independent experiments in triplicate and analysed by two-way ANOVA where ns is not significant. (C) Area of DQ-BSA Green and Lysotracker Red co-localisation (yellow) quantified per cell in HCC1806 WT, K2 and K3 ASCT2 KO cell lines. Representative images, from three independent repeats of DQ-BSA Green and Lysotracker Red co-localisation, where nuclei were visualised with Hoescht fluorescent stain (blue). The scale bar in white is equivalent to 8 μM. Mean ± SEM of indices calculated from >30 cells (3–4 fields of view) across three independent experiments. Asterisks indicate p values, ns not significant, *p = 0.03 from a one-way ANOVA. (D) CCK8 assays for HCC1806 WT, K2 and K3 ASCT2 KO cell lines cultured in 2 mM glutamine with dialysed FBS (dFBS; 10% v/v) ± water control/chloroquine (CQ) (5–50 μM). Mean ± SEM from three independent experiments in triplicate and analysed by two-way ANOVA where ns is not significant, 10 μM CQ *p = 0.0487 for K3, 20 μM CQ **p = 0.0059 for WT, *p = 0.0239 for K2, **p = 0.0015 for K3 and 50 μM CQ ****p < 0.0001 for WT, K2 and K3. (E) Western blot of ASCT2 protein (CST #8057S, 60–80 kDa) and GAPDH protein (Abcam #ab8245, 37 kDa) as a loading control in HCC1806 WT cell line transduced with empty vector (EV) or ASCT2 KO cells transduced with EV or ASCT2 (A2; rescue). (F) Uptake of 100 nM [3H]-l-glutamine in HCC1806 cell lines over 30 min. Mean ± SEM from three independent experiments in triplicate where asterisks indicate p value from a one-way ANOVA where **p = 0.002 and ns is not significant. (G) CCK8 assay of HCC1806 cell lines measured at 96 h, mean ± SEM from three independent experiments done in triplicate and analysed by two-way ANOVA where ns is not significant. (H) Uptake of TMR-dextran (red) in HCC1806 WT + EV, KO + EV and KO + A2. Nuclei were visualised with Hoescht fluorescent stain (blue). The scale bar in white is equivalent to 10 μM. Quantification of macropinocytic index in HCC1806 cell lines is macropinocytosis/cell (area of macropinosomes/number of cells in field). Representative images are shown from three independent repeats. Mean ± SEM of indices calculated from >30 cells (3–4 fields of view) across three independent experiments. Asterisks indicate p value from a one-way ANOVA where *p = 0.01 and ns is not significant). (I, J) Western blot of pAMPK protein (CST #2535, 62 kDa), AMPK (CST #5831, 62 kDa) and GAPDH protein (Abcam #ab8245, 37 kDa) and pAKT (S473) protein (CST #9271, 60 kDa), Akt (CST #9272, 60 kDa) and GAPDH protein (Abcam #ab8245, 37 kDa) as a loading control in polyclonal MDA-MB-231 (I) and MDA-MB-468 (J) NC and A2KO cell lines. Representative image from two to three independent repeats is shown.

References

    1. Amyere M, Payrastre B, Krause U, Van Der Smissen P, Veithen A, Courtoy PJ (2000) Constitutive macropinocytosis in oncogene-transformed fibroblasts depends on sequential permanent activation of phosphoinositide 3-kinase and phospholipase C. Mol Biol Cell 11:3453–3467 - PMC - PubMed
    1. Ansari R, El, Craze ML, Althobiti M, Alfarsi L, Ellis IO, Rakha EA, Green AR (2020) Enhanced glutamine uptake influences composition of immune cell infiltrates in breast cancer. Br J Cancer 122:94–101 - PMC - PubMed
    1. Araki N, Johnson MT, Swanson JA (1996) A role for phosphoinositide 3-kinase in the completion of macropinocytosis and phagocytosis by macrophages. J Cell Biol 135:1249–1260 - PMC - PubMed
    1. Beckers RK, Selinger CI, Vilain R, Madore J, Wilmott JS, Harvey K, Holliday A, Cooper CL, Robbins E, Gillett D et al (2016) Programmed death ligand 1 expression in triple-negative breast cancer is associated with tumour-infiltrating lymphocytes and improved outcome. Histopathology 69:25–34 - PubMed
    1. Bhosle VK, Mukherjee T, Huang YW, Patel S, Pang BWF, Liu GY, Glogauer M, Wu JY, Philpott DJ, Grinstein S et al (2020) SLIT2/ROBO1-signaling inhibits macropinocytosis by opposing cortical cytoskeletal remodeling. Nat Commun 11:4112 - PMC - PubMed

MeSH terms

Substances