. 2024 Dec;25(12):5352-5382.
doi: 10.1038/s44319-024-00282-8. Epub 2024 Oct 17.

RNA binding protein ZCCHC24 promotes tumorigenicity in triple-negative breast cancer

Affiliations

RNA binding protein ZCCHC24 promotes tumorigenicity in triple-negative breast cancer

Yutaro Uchida et al. EMBO Rep. 2024 Dec.

Abstract

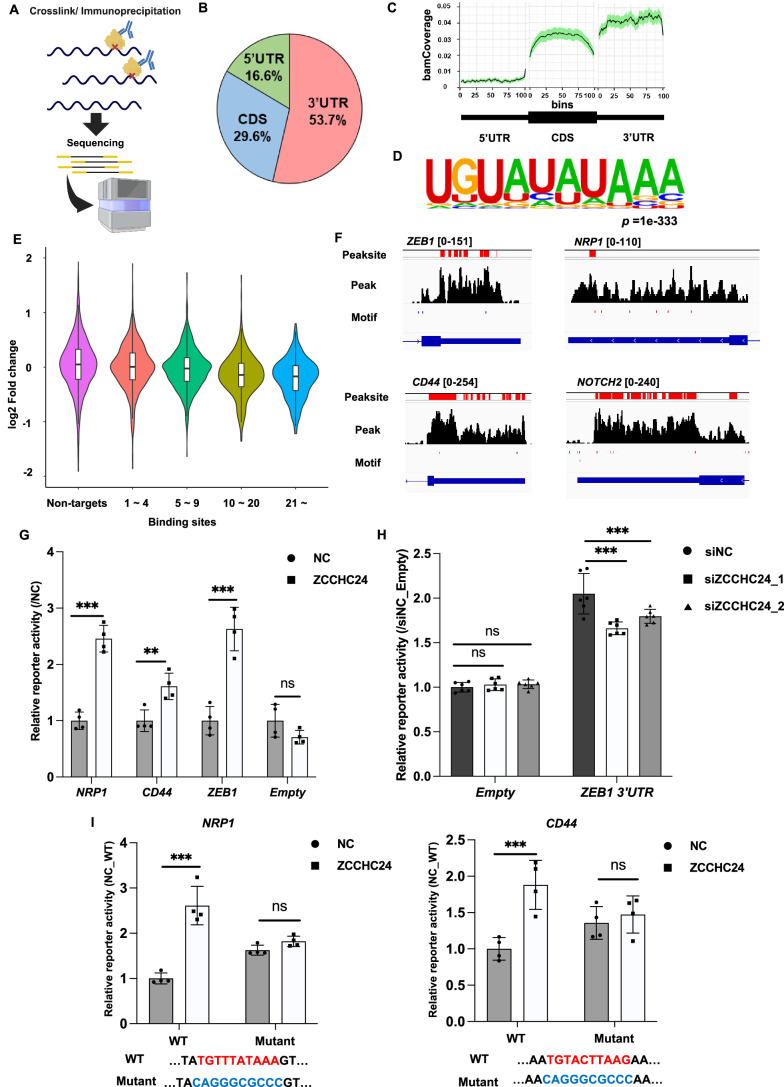
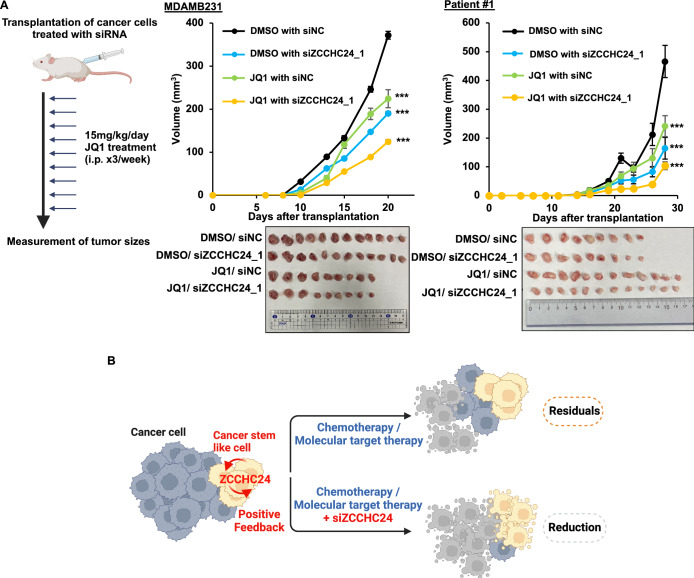
Triple-negative breast cancer (TNBC) lacks the expression of hormone and HER2 receptors and is highly malignant with no effective therapeutic targets. In TNBC, the cancer stem-like cell (CSC) population is considered to be the main cause of resistance to treatment. Thus, the therapeutic targeting of this population could substantially improve patient survival. Here, we identify the RNA-binding protein ZCCHC24 as enriched in the mesenchymal-like TNBC population. ZCCHC24 promotes the expression of a set of genes related to tumorigenicity and treatment resistance by directly binding to the cis-element "UGUWHWWA" in their mRNAs, thereby stabilizing them. One of the ZCCHC24 targets, ZEB1, is a transcription factor that promotes the expression of cancer stemness genes and reciprocally induces ZCCHC24 expression. ZCCHC24 knockdown by siRNAs shows a therapeutic effect and reduces the mesenchymal-like cell population in TNBC patient-derived xenografts. ZCCHC24 knockdown also has additive effects with the BET inhibitor JQ1 in suppressing tumor growth in TNBC patient-derived xenografts.

Keywords: Breast Cancer; Cancer Stem Cells; RNA Binding Protein; ZEB1; mRNA Stabilization.


Conflict of interest statement

Disclosure and competing interests statement. The authors declare no competing interests.

Figures

Figure 1
Figure 1. RNA-binding protein ZCCHC24 shows specific expression in a mesenchymal-like population.
(A) Dimensional reduction plot of single-cell RNA sequencing (scRNA-seq) of a patient-derived xenograft (PDX) (Patient #1). (B) Dot plot for PDX scRNA-seq (Patient #1). (C) Feature plots of PDX scRNA-seq for genes characterizing each population (ZEB1, NRP1, VIM, CD24, KRT19, KRT8, TGFB1, CDC42). (D) Venn diagram of mesenchymal-like population marker genes from scRNA-seq analyses of PDX and tumor tissues from five patients with TNBC. Among the 240 common marker genes, 17 genes with GO Term “RNA binding” were extracted and shown in the text box. (E) Violin plot of ZCCHC24 for scRNA-seq of PDX. (P value as a marker gene: 1.79 × 10−169) (Cell numbers: Epithelial population: 494, Mesenchymal-like population: 1801, TGFB1(+) population: 2717).
Figure 2
Figure 2. ZCCHC24 regulates genes related to tumorigenicity and chemoresistance via the stabilization of mRNAs.
(A) Distribution plots of RNA-seq analysis for the TNBC cell line MDAMB231 or patient-derived xenografts (patient #1) knocked down with ZCCHC24 siRNA. Differences in gene expression between siNC and siZCCHC24_1 were tested using DESeq2 (https://bioconductor.org/packages/release/bioc/html/DESeq2.html) following the manufacturer’s protocol. The cutoff for the determination of differentially expressed genes (DEGs) was as follows: log2 fold change < −0.4 and Padj <0.05 for downregulated genes (colored in orange) and log2 fold change >0.4, Padj <0.05 for upregulated genes (gene lists are shown in Dataset EV3). (Three biological replicates per group). (B) qPCR analysis of the TNBC cell lines MDAMB231 and HCC38 or patient-derived xenografts (patient #1) knocked down with ZCCHC24 siRNA. Differences in gene expression between the siNC and siZCCHC24_1 cells were tested using an unpaired t test for independent experiments. (P values; MDAMB231; ZCCHC24: 2.1 × 10−4, ZEB1: 0.020, CD44: 0.23, NRP1: 0.0045, NOTCH2: 0.0012, HCC38; ZCCHC24: 0.021, ZEB1: 0.015, CD44: 0.022, NRP1: 0.097, NOTCH2: 1.1 × 10−4, PDX (Patient#1); ZCCHC24: 8.0 × 10−5, ZEB1: 0.0087, CD44: 0.0027, NRP1: 0.094, NOTCH2: 9.8 × 10−5) (N = 3 biological replicates each, *P < 0.05, **P < 0.01, ***P < 0.005). (C) Schema of BRIC-Seq. MDAMB231 cells were knocked down with siRNA against ZCCHC24 or the negative control, labeled with bromouridine (BrU) overnight. The medium was then discarded and replaced with fresh medium. At each time point, RNA was collected from the cells and labeled RNA was isolated by immunoprecipitation for BrU. Libraries were prepared and sequenced from the immunoprecipitated RNAs. (D) BRIC-seq results. Transcripts with less than 0.8-fold half-life are indicated in orange. (E) RNA levels of the indicated genes upon actinomycin D treatment of the TNBC cell line MDA-MB-231 knocked down with siRNA against ZCCHC24, compared to the negative control (siRNA negative control (NC)). Differences in the proportions of the remaining RNA were assessed using unpaired t tests. (P values; ZEB1; 4 h: 0.099, 8 h: 0.0057; NRP1; 4 h: 0.17, 8 h: 0.0077) (N = 3 biological replicates each, **P < 0.01). Data information: Data are presented as the mean ± SD (B, E). Source data are available online for this figure.
Figure 3
Figure 3. ZCCHC24 stabilizes the mRNA of genes essential for breast cancer stemness by binding to cis-elements on 3’UTR.
(A) Schema of PAR-CLIP. MDAMB231 cells expressing ZCCHC24 were incubated with 4-thiouridine (s4U) and cross-linked under ultraviolet. RNA-protein complexes were immunoprecipitated and fragmented, and SDS-PAGE purified RNA. Libraries were created and sequenced using these RNAs. (B) Pie chart showing the proportions of ZCCHC24-binding sites identified using PAR-CLIP. (C) Coverage plot showing the distribution of peak sites among 5’UTR, CDS, and 3’UTR. (D) Results of motif analysis using HOMER for the peak sites of PAR-CLIP (P value = 1 × 10−133). (E) Violin plot showing the connection between the number of binding sites of PAR-CLIP in 3’UTR of target genes and the change in expression levels measured by RNA-Seq upon the knockdown of ZCCHC24 compared to the negative control. Box plots are shown with whiskers, medians, and lower and upper 25th percentiles of RNA-seq expression changes for each group. (Number of genes: non-targets: 3045; binding sites 1–4: 2515; binding sites 5–9: 1020; binding sites 10–20: 685; and binding sites >21: 296). (F) BigWig files, peak sites, and motif sites of PAR-CLIP for NOTCH2, NRP1, CD44, and ZEB1. (G) Luciferase reporter assay for reporter containing 3’UTR of NRP1, CD44, and ZEB1 upon expressing ZCCHC24 or empty vector as a control. Differences in reporter activity were tested using the unpaired t test as an independent test for each reporter. (P values; NRP1: 4.9 × 10−5, CD44: 0.0069, ZEB1: 4.0 × 10−4, Empty: 0.11) (N = 4 biological replicates each, **P < 0.01, ***P < 0.005, ns: not significant). (H) Luciferase reporter assays using reporters with ZEB1 3’UTR and siRNA against endogenous ZCCHC24. Differences in reporter activity were tested using ANOVA and Tukey’s post hoc test. (P values; Empty; siZCCHC24_1: 0.998, siZCCHC24_2: 0.995; ZEB1 3’UTR; siZCCHC24_1; 1.3 × 10−5, siZCCHC24_2; 4.5 × 10−3) (N = 6, biological replicate each, ***P < 0.005, ns: not significant). (I) Luciferase reporter assays using reporters with cis-elements from NRP1 (left) and CD44 mutated to the ZCCHC24-binding site and evaluating the effect of ZCCHC24 expression or an empty vector as a control on reporter activity. Differences in reporter activity were tested using ANOVA and Tukey’s post hoc test. (P values; NRP1 WT: 2.6 × 10−6, NRP1 Mutant: 0.652; CD44 WT: 0.0016, CD44 Mutant: 0.915) (N = 4 biological replicates each, ***P < 0.005, ns: not significant). Data information: Data are presented as mean ± SD (GI). Source data are available online for this figure.
Figure 4
Figure 4. The transcriptional regulator ZEB1 upregulates the expression of ZCCHC24.
(A) Topologically associated domains (TADs) for reanalyzed Hi-C of MDAMB231 (Beesley et al, 2020), reanalyzed ChIP-Seq data for ZEB1, YAP1, JUN, H3K4Me1, and H3K27Ac (Zanconato et al, ; Feldker et al, , and He et al, 2021), and reanalyzed TAC-Seq data for MDAMB231 cells knocked down with ZEB1 shRNA (Feldker et al, 2020). (B) qPCR analyses of MDAMB231 or PDX (Patient #1) cells knocked down using siRNA targeting ZEB1, JUN, and YAP1. Differences in gene expression between the siNC and siZCCHC24_1 cells were tested using an unpaired t test for independent experiments. (P values; MDAMB231; siZEB1_1: 0.0019, siYAP1_1: 0.020, siJUN_1: 0.044, PDX (Patient #1); siZEB1_1: 0.0061, siYAP1_1: 0.043, siJUN_1: 0.011) (N = 3 biological replicates each, *P < 0.05, **P < 0.01, ***P < 0.005). (C) Luciferase reporter assay for the reporter containing the PGK promoter (PGKp) and enhancer candidate region with the expression of AP-1, YAP1, and ZEB1. Differences in reporter activity were tested using ANOVA and Tukey’s post hoc test. (P values: Control: 0.998, Enhancer candidate site: 1.6 × 105) (N = 5 biological replicates each, ***P < 0.005). (D) Luciferase reporter assay for a reporter containing the PGK promoter (PGKp) and an enhancer candidate region with ZEB1 knockdown. Differences in reporter activity were tested using ANOVA and Tukey’s post hoc test. (P values: Empty: 0.849, Enhancer candidate site: 0.0052) (N = 5 biological replicates, **P < 0.01). (E) Distribution plot of ZEB1 and ZCCHC24 mRNA expression from TCGA-BRCA database. Relevance was calculated using the FPKM of each gene as the correlation coefficient. (F) Schematic representation of the model. ZEB1 transcriptionally upregulates ZCCHC24, while ZCCHC24 regulates the expression of target genes, including ZEB1, by directly binding to cis-elements in target mRNAs. (G) Immunofluorescence analysis of TNBC pathological samples (patients #2–#5) for ZEB1 and ZCCHC24 expression. White and yellow arrows show cells co-expressing ZEB1 and ZCCHC24. For the cells marked with a yellow arrow, the images captured from a single cell are shown in the upper-right corner of the figure. Data information: Data are presented as mean ± SD (BD). (G) Scale bar: 10 µm (overview) and 3 µm (captured single cell). Source data are available online for this figure.
Figure 5
Figure 5. ZCCHC24 maintains the mesenchymal-like population and contributes to tumor formation.
(A) Schema of the experiments. PDX transfected with ZCCHC24 siRNA were subcutaneously transplanted, and the number of tumors formed was counted. The resulting tumors were subjected to single-cell RNA sequencing. (B) Comparison of tumor formation ability in vivo for patient-derived xenografts (Patient #1) knocked down with siRNA against ZCCHC24 or the negative control. The cells were transplanted into 7-week-old female NOG mice. Tumor formation ability was tested using the likelihood ratio test of the single-hit model, as shown on the ELDA software website (https://bioinf.wehi.edu.au/software/elda/). (P value = 1.20 × 10−6). (C) Dimensional reduction plot for scRNA-seq of transplanted PDX knocked down with siRNA against ZCCHC24 or negative control. (D) Dot plots of representative genes for scRNA-seq of transplanted PDX. (E) Feature plots of scRNA-seq on PDX for genes characterizing mesenchymal-like populations (ZCCHC24, ZEB1, NRP1, CD24). (F) Violin plots of ZCCHC24 and its downstream genes (ZEB1, NRP1, and ADAMTS1) for the mesenchymal-like population of scRNA-seq transplanted PDX cells (number of cells in the cluster; siNC: 2007, si-ZCCHC24:664). Source data are available online for this figure.
Figure 6
Figure 6. Combining ZCCHC24 siRNA with a BET inhibitor overcomes chemoresistance.
(A) In vivo treatment with siRNAs against ZCCHC24 and JQ1. MDAMB231 or PDX (patient #1) knocked down with siRNA for ZCCHC24 or negative control (NC) were transplanted into mice. Mice were intraperitoneally injected with 15 mg/kg/day JQ1 three times per week, and tumor sizes were measured. Differences in tumor size were evaluated using Dunnett’s test (DMSO with siNC as the control). (P values: MDAMB231: DMSO with siZCCHC24_1: 0.000189, JQ1 with siNC: 0.0039, JQ1 with siZCCHC24_1: 6.65 × 10−5, PDX (Patient #1): DMSO with siZCCHC24_1: 7.69 × 10−4, JQ1 with siNC: 3.07 × 10−3, JQ1 with siZCCHC24_1: 4.98 × 10−9) (MDAMB231: N = 12 for DMSO treated samples and N = 9 for JQ1 treated samples, PDX: N = 9 for DMSO treated samples and N = 12 for JQ1 treated samples, ***P < 0.005). (B) Schematic representation of the concept. Positive feedback between the transcription factor ZEB1 and RNA-binding protein ZCCHC24 maintains cancer stemness in TNBC and leads to tumor survival. Data information: Data are presented as mean ± SE (A). Source data are available online for this figure.
Figure EV1
Figure EV1. Quantitative PCR for MDAMB231 overexpressing ZCCHC24 and FACS / Western blotting analysis for MDAMB231 or PDX knocked down with siRNA for ZCCHC24.
(A) qPCR analysis of MDAMB231 cells overexpressing ZCCHC24 or GFP as controls. Changes in expression were assessed using unpaired t tests. (P values: NOTCH2: 9.7 × 10⁻⁴, ZEB1: 0.0023, CDH11: 6.68 × 10⁻⁵, JAG1: 9.0 × 10⁻⁴) (***P < 0.005, N = 3 biological replicates each). (B) FACS analysis (CD44 and NRP1) of TNBC cell lines (MDAMB231 and HCC38) or PDX (Patient #1) knocked down with siRNA for ZCCHC24. (C) Western blotting analysis for MDAMB231 knocked down with siRNA for ZCCHC24. (D) Gene ontology analysis of common differentially expressed genes in the RNA-Seq analysis and destabilized genes in the BRIC-Seq analysis. The specificity of the gene ontology was tested using DAVID software (https://david.ncifcrf.gov/tools.jsp), following the manufacturer’s protocol. Data information: Data are presented as mean ± SD (A).
Figure EV2
Figure EV2. ZCCHC24 binds to mRNA of genes important for tumor progression and breast cancer stemness.
RIP-qPCR analysis of ZCCHC24. Differences in enrichment were tested using analysis of variance, followed by Tukey’s post hoc test. (P values: ACTB FLAG: 1.0, ZEB1 FLAG: 1.25 × 10⁻¹², NOTCH2 FLAG: 1.11 × 10⁻⁷) (N = 3 biological replicates each, ***P < 0.005, n.d.: not detected, ns: not significant). Data information: Data are presented as mean ± SD.
Figure EV3
Figure EV3. ZEB1, JUN, and YAP transcriptionally regulate ZCCHC24.
(A) qPCR analysis of MDAMB231 overexpressing ZEB1. Changes in gene expression were analyzed using an unpaired t test. (P value: ZEB1: 0.022, ZCCHC24: 0.014) (N = 3 biological replicates each, *P < 0.05). (B) Western blot analysis of MDAMB231 and PDX (Patient #1) cells knocked down with siRNA for ZEB1 or the negative control (NC). (C) Chromatin immunoprecipitation (ChIP) analysis of MDAMB231 knocked down with siRNA against ZEB1 or negative control (NC). Differences in enrichment were tested using analysis of variance, followed by Tukey’s post hoc test. (P values: Enhancer candidate site: 0.014, GAPDH promoter: 1.0) (N = 3 biological replicates each, *P < 0.05). Data information: Data are presented as mean ± SD (A, C).
Figure EV4
Figure EV4. ZCCHC24 knockdown downregulates tumor formation in vitro and in vivo.
(A) Sphere-formation assay of MDAMB231 cells knocked down with ZCCHC24 siRNA. Differences in the number of spheres formed were tested using unpaired t tests. (P value = 0.040) (N = 3 biological replicates each; *P < 0.05). (B) In vitro extremely limited dilution assay (ELDA) of MDAMB231 knocked down with siRNA for ZCCHC24. Tumor formation ability was tested using the likelihood ratio test of the single-hit model, as shown on the ELDA software website (https://bioinf.wehi.edu.au/software/elda/) by the manufacturer. (P value = 0.00493). (C) In vitro extremely limited dilution assay (ELDA) of HCC38 knocked down with siRNA for ZCCHC24. Tumor formation ability was tested using the likelihood ratio test of the single-hit model, as shown on the ELDA software website by the manufacturer. (P value = 0.0228). (D) In vitro extremely limited dilution assay (ELDA) of PDX (patient #1) knocked down with siRNA for ZCCHC24. Tumor formation ability was tested using the likelihood ratio test of the single-hit model, as shown on the ELDA software website by the manufacturer. (P value = 0.045). (E) Comparison of tumor formation ability in vivo of MDAMB231 knocked down with siRNA for ZCCHC24 or negative control. The cells were transplanted into seven-week-old female nude mice. Tumor formation ability was tested using the likelihood ratio test of the single-hit model, as shown on the manufacturer’s ELDA software website (P value: 1.37 × 10⁻⁴). Data information: Data are presented as mean ± SD (A). (A) Scale bar 50 µm.
Figure EV5
Figure EV5. ZCCHC24 expression and clinical prognosis in clinical trials and combined use of a chemotherapy drug and siRNA against ZCCHC24.
(A) Clinical prognosis (pathologic complete response (pCR) and residual disease (RD)) and RNA expression of ZCCHC24 in clinical trials (Hatzis et al, ; Loibl et al, 2018) with neoadjuvant chemotherapy. (B) qPCR analyses of ZCCHC24 for MDAMB231 or PDX (Patient #1) with the addition of 0.1% DMSO or 1 µM doxorubicin. Changes in expression were assessed using unpaired t tests. (P values: MDAMB231:0.0027, PDX (Patient #1): 0.037) (N = 3 biological replicates each, *P < 0.05, ***P < 0.005). (C) Cell viability assay of MDAMB231 with siRNA transfection and treated with 0.1% DMSO or 500 nM doxorubicin. Differences in cell viability were tested using Dunnett’s test (DMSO with siNC as the control). (P values: DMSO with siZCCHC24_1: P < 2.22 × 10⁻¹⁶, DMSO with siZCCHC24_2: P < 2.22 × 10⁻¹⁶, doxorubicin with siNC: P < 2.22 × 10⁻¹⁶, doxorubicin with siZCCHC24_1: P < 2.22 × 10⁻¹⁶, doxorubicin with siZCCHC24_2: P < 2.22 × 10⁻¹⁶) (N = 4 biological replicates each, ***P < 0.005). (D) Cell viability assay for PDX (Patient #1) with siRNA transfection and addition of 0.1% DMSO or 1 µM doxorubicin. Differences in cell viability were tested using Dunnett’s test. (DMSO with siNC was used as a control). (P values: DMSO with siZCCHC24_1: 0.145, DMSO with siZCCHC24_2: 5.61 × 10−5, doxorubicin with siNC: 9.77 × 10⁻⁷, doxorubicin with siZCCHC24_1: 5.43 × 10⁻¹², doxorubicin with siZCCHC24_2: 1.67 × 10⁻¹⁴) (N = 8, biological replicates each, ***P < 0.005). (E) qPCR analyses of ZCCHC24 for MDAMB231 or PDX (Patient #1) with the addition of 0.1% DMSO or 1 µM JQ1. Changes in expression were assessed using unpaired t tests. (P alues: MDAMB231: 1.1 × 10⁻⁴, PDX (Patient #1): 9.9 × 10⁻⁴) (N = 3 biological replicates each, ***P < 0.005). Data information: Data are presented as mean ± SD (BE).

References

    1. Al-Hajj M, Wicha MS, Benito-Hernandez A, Morrison SJ, Clarke MF (2003) Prospective identification of tumorigenic breast cancer cells. Proc Natl Acad Sci USA 100:3983–3988 - PMC - PubMed
    1. Azios NG, Krishnamoorthy L, Harris M, Cubano LA, Cammer M, Dharmawardhane SF (2007) Estrogen and resveratrol regulate Rac and Cdc42 signaling to the actin cytoskeleton of metastatic breast cancer cells. Neoplasia 9:147–158 - PMC - PubMed
    1. Barker N, Ridgway RA, van Es JH, van de Wetering M, Begthel H, van den Born M, Danenberg E, Clarke AR, Sansom OJ, Clevers H (2009) Crypt stem cells as the cells-of-origin of intestinal cancer. Nature 457:608–611 - PubMed
    1. Batlle E, Clevers H (2017) Cancer stem cells revisited. Nat Med 23:1124–1134 - PubMed
    1. Beesley J, Sivakumaran H, Moradi Marjaneh M, Lima LG, Hillman KM, Kaufmann S, Tuano N, Hussein N, Ham S, Mukhopadhyay P et al (2020) Chromatin interactome mapping at 139 independent breast cancer risk signals. Genome Biol 21:8 - PMC - PubMed

MeSH terms

LinkOut - more resources