. 2024 Oct;6(10):1897-1912.
doi: 10.1038/s42255-024-01140-6. Epub 2024 Oct 17.

Genetic architecture of oral glucose-stimulated insulin release provides biological insights into type 2 diabetes aetiology

Affiliations

Genetic architecture of oral glucose-stimulated insulin release provides biological insights into type 2 diabetes aetiology

A L Madsen et al. Nat Metab. 2024 Oct.

Abstract

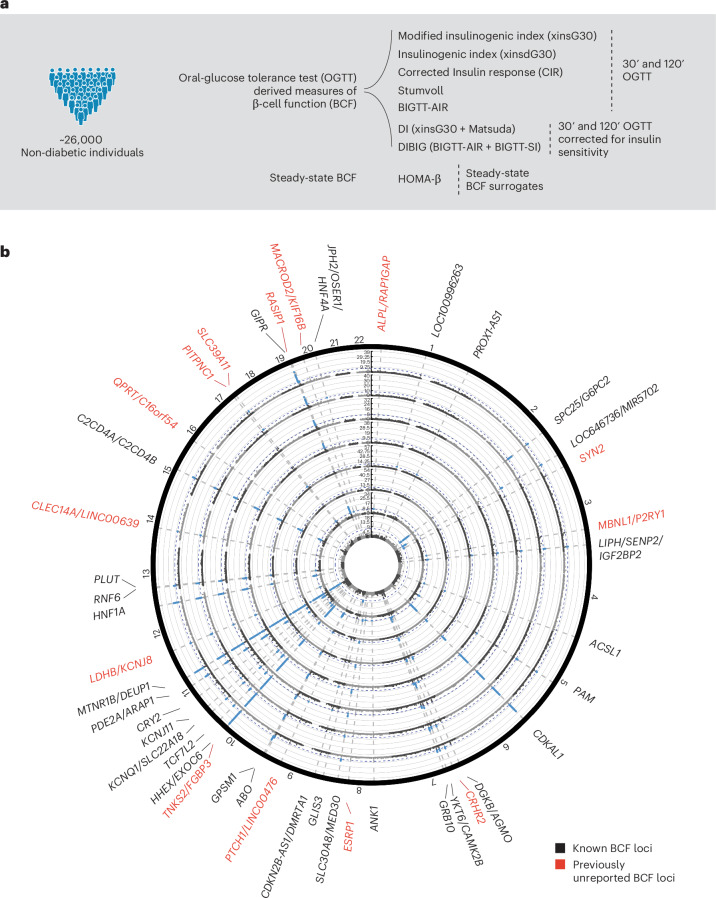
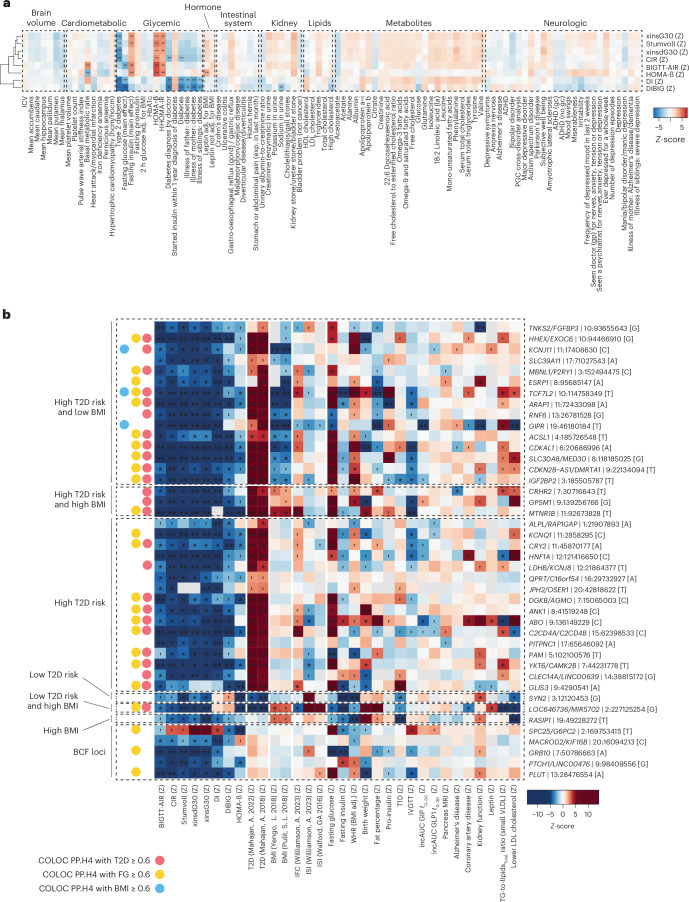
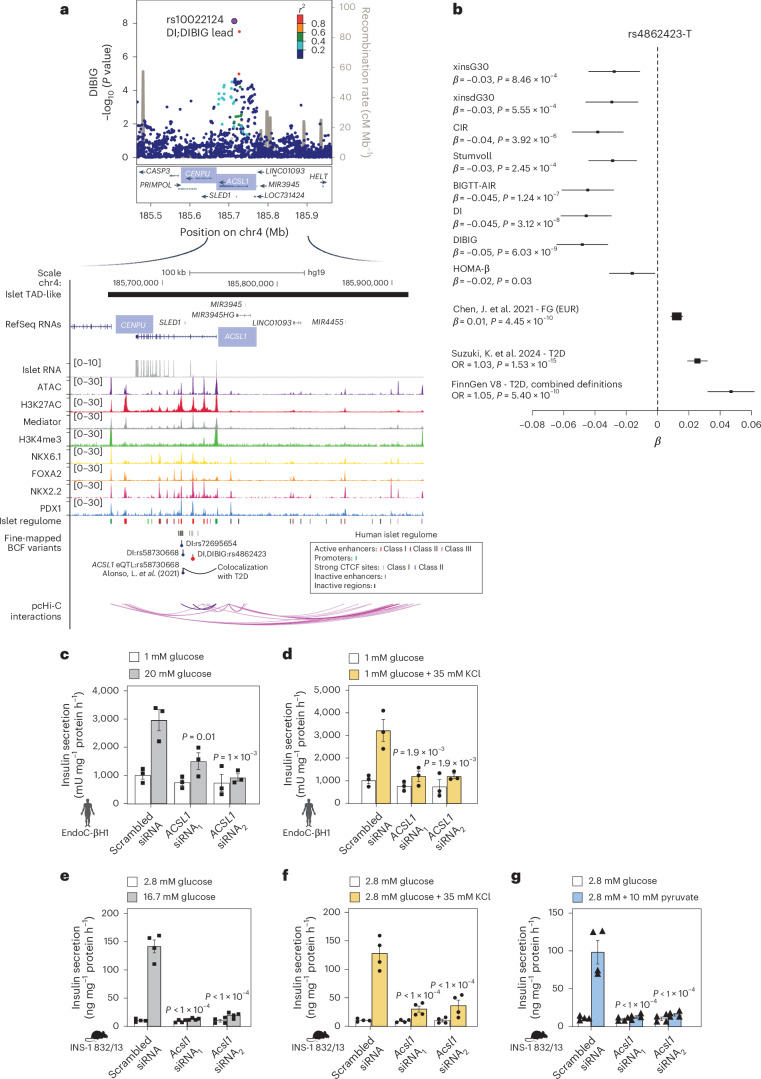
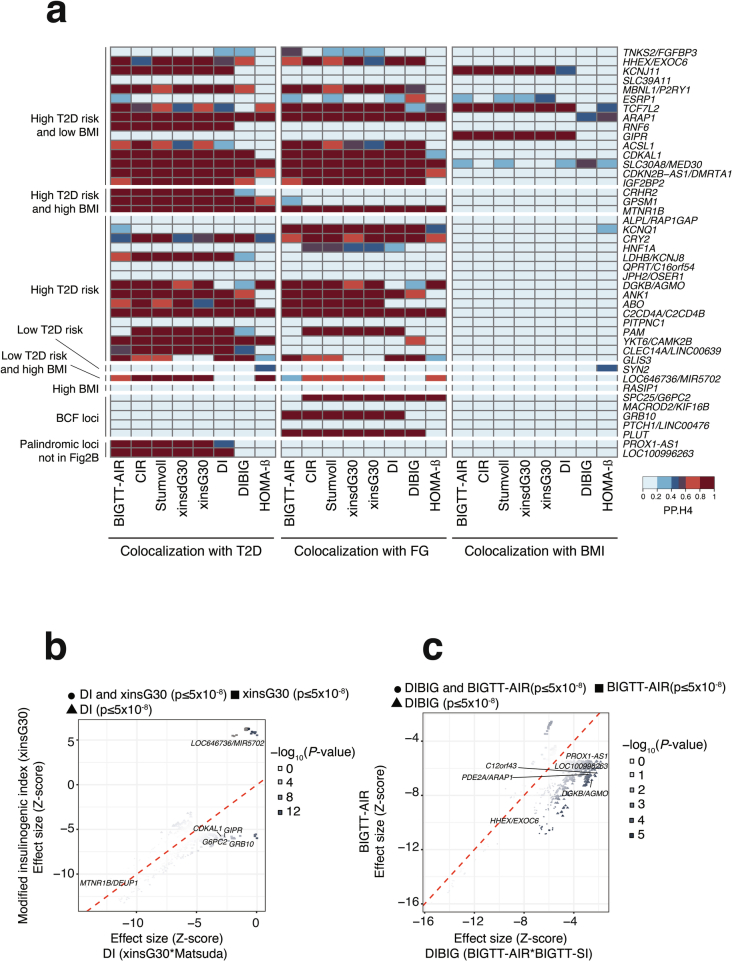
The genetics of β-cell function (BCF) offer valuable insights into the aetiology of type 2 diabetes (T2D)1,2. Previous studies have expanded the catalogue of BCF genetic associations through candidate gene studies3-7, large-scale genome-wide association studies (GWAS) of fasting BCF8,9 or functional islet studies on T2D risk variants10-14. Nonetheless, GWAS focused on BCF traits derived from oral glucose tolerance test (OGTT) data have been limited in sample size15,16 and have often overlooked the potential for related traits to capture distinct genetic features of insulin-producing β-cells17,18. We reasoned that investigating the genetic basis of multiple BCF estimates could provide a broader understanding of β-cell physiology. Here, we aggregate GWAS data of eight OGTT-based BCF traits from ~26,000 individuals of European descent, identifying 55 independent genetic associations at 44 loci. By examining the effects of BCF genetic signals on related phenotypes, we uncover diverse disease mechanisms whereby genetic regulation of BCF may influence T2D risk. Integrating BCF-GWAS data with pancreatic islet transcriptomic and epigenomic datasets reveals 92 candidate effector genes. Gene silencing in β-cell models highlights ACSL1 and FAM46C as key regulators of insulin secretion. Overall, our findings yield insights into the biology of insulin release and the molecular processes linking BCF to T2D risk, shedding light on the heterogeneity of T2D pathophysiology.


Conflict of interest statement

G.A. became a full-time employee of Novo Nordisk Ltd. and N.G. became a full-time employee at Novo Nordisk A/S while this manuscript was being drafted. The remaining authors declare no competing interests.

Figures

Fig. 1
Fig. 1. GWAS discovery for eight BCF traits identifies 55 significant associations.
a, Overview of the signal discovery strategy. We mapped genetic effects on BCF indices using oral glucose-stimulated and steady-state fasting measurements from ~26,000 non-diabetic individuals. In-house BCF groupings are highlighted on the right. b. Multi-trait Manhattan plot of single-variant genome-wide association meta-analyses for eight BCF estimates. From inner to outer tracks: HOMA-β, DI, DIBIG, BIGTT-AIR, CIR, Stumvoll, xinsdG30 and xinsG30. Genome-wide significant variants (P ≤ 5 × 10−8) are coloured in dark blue and previously unreported loci are in red. Loci meeting Bonferroni-correction thresholds are detailed in Supplementary Table 3. Y axis, association P-values on the –log10 scale; x axis, genomic position in hg19.
Fig. 2
Fig. 2. Impact of BCF loci on other complex traits.
a, Heatmap of genetic correlations (Z-score) between each BCF trait and other complex traits, as calculated by LDSC regression implemented in LDHub. Asterisks indicate significant correlations after Bonferroni multiple-test correction (P ≤ 0.05 / (8 BCF traits × 9 complex trait categories)). Rows are grouped using hierarchical clustering with Euclidean distance. b, Effect sizes (Z-scores) for multiple pancreatic islet-relevant traits among 42 BCF loci. Loci are named as follows: gene | chromosome:position [effect allele]. WHR, waist-to-hip ratio; IFC, insulin fold change; ISI, Stumvoll insulin sensitivity; T1D, type 1 diabetes; IVGTT, intravenous glucose tolerance test; MRI, magnetic resonance imaging; Kidney function, estimated glomerular filtration rate based on serum creatinine; TG, triglycerides. Variant effect sizes were aligned to a negative BIGTT-AIR effect. The sentinel variant at each locus corresponds to the lead variant or a proxy (LD r2 > 0.7), excluding non-palindromic alleles and with available data among all BCF, BMI and T2D traits. **Genome-wide significant (P ≤ 5 × 108), *Bonferroni-corrected P-value (P ≤ 0.05 / 42 variants), | Nominal significance (P ≤ 0.05). Red, yellow and blue dots on the left indicate moderate evidence of colocalization at a given BCF locus between at least one BCF trait and T2D, fasting glucose or BMI, respectively. Source data
Fig. 3
Fig. 3. Role of human islet gene expression and alternative splicing regulation into BCF and identity.
a, Heatmap of heritability (h2) enrichments for BCF and other complex traits and diseases, calculated using S-LDSC, across cis-regulatory transcriptional annotations from multiple tissues and cell types. Self rep.: self-reported. b,c, Heatmap showing the association of BCF genetic signals with cell-type-specific expression in relevant cells from Tabula Muris (b) and pancreatic islet cells from human donors (c). Z-scores displayed on the heatmap were calculated using CELLECT-LDSC. **Bonferroni-corrected P ≤ 0.05 / (8 BCF traits × 7 complex trait categories) in b and P ≤ 0.05 / (8 BCF traits × 14 pancreatic cell types) in c. *Nominal significance. Rows are grouped by hierarchical clustering with Euclidean distance in ac. d, Scheme illustrating the prioritization of effector transcripts for BCF traits based on epigenomic annotations and enhancer-gene assignments in human pancreatic islets, and effects on human islet gene expression and alternative splicing through TWAS and colocalization approaches (adapted from a previous publication). e, Enrichments of BCF candidate target genes within transcription factor (TF) co-expression networks from ARCHS4, calculated using enrichR. Barplot representation shows enrichR combined scores, with bars coloured according to the Benjamini–Hochberg-adjusted P value. *Significant enrichments at a false discovery rate of 5%. f, Illustrative examples of candidate BCF protein-coding genes contributing to the enrichment of annotations that are central for islet function and identity, and diabetes, as calculated using enrichR. The number of BCF genes contributing to each functional annotation is indicated in brackets. Adjusted P values using the Benjamini–Hochberg method are provided. Source data
Fig. 4
Fig. 4. Transcriptional regulation of ACSL1 influences BCF, glucose metabolism and diabetes.
a, Regional signal plot at the ACSL1 locus, showing P values on a −log10 scale (y axis) in hg19 locations (x axis) from DIBIG single-variant GWAS meta-analyses. Variants are coloured by their LD correlation (r2) with the lead variant (rs10022124). Below, epigenomic datasets are shown, including ATAC-seq and ChIP-seq data in human pancreatic islets. Enhancer-gene assignments from pcHi-C data are represented as pink arcs; those inferred using pcHi-C data are in purple. Fine-mapped DI and DIBIG signals located in islet active enhancers connected to ACSL1 and CENPU, or identified as T2D-colocalizing islet ACSL1 eQTLs, are highlighted. b, Forest plot of the strongest functionally prioritized signal at the ACSL1 locus (rs4862423, DIBIG). For each of the BCF traits, glycaemic levels and T2D risk, the square represents the β estimate with 95% CI error bars. The square size reflects precision. The effect allele and variant RSID are provided at the top. Summary statistics data were generated in this study or obtained from previous publications, and FinnGen (release v.8). OR, odds ratio. c,d, Insulin secretion in human EndoC-β H1 cells following ACSL1 siRNA silencing in response to high glucose (c) and KCl stimuli (d). eg, Insulin secretion in INS-1 832/13 cells upon Acsl1 gene silencing in response to high glucose (e), KCl (f) and pyruvate (g). Bar plots show the means of three (in c and d) and four (in eg) independent replicates; error bars, s.e.m. Statistical significance was assessed using one-way ANOVA followed by Tukey’s post hoc test of each condition against the negative control group (scrambled siRNA). Source data
Extended Data Fig. 1
Extended Data Fig. 1. Genome-wide association meta-analyses for eight β-cell function (BCF) estimates.
Manhattan plots (a) and q-q plots (b) using summary statistics of eight single-variant BCF GWAS meta-analyses in up to 26,000 individuals. (a) For each variant tested, association P-values on -log10 scale (y-axis) are plotted against their genomic locations in hg19 (x-axis). The black horizontal line denotes genome-wide significance, P-value ≤ 5x10⁻⁸. (b) Observed -log10 (P-values) are compared against expected -log10 (P-values) according to a uniform distribution. Significant loci after Bonferroni multiple-test correction can be found in Supplementary Table 3.
Extended Data Fig. 2
Extended Data Fig. 2. Genetic and phenotypic sharing of β-cell function (BCF) traits.
(a) Genetic (top left) and phenotypic correlations (bottom right) between eight BCF estimates. Phenotypic correlations were calculated using Pearson correlation, and genetic correlations using LDSC. *Significant correlations after Bonferroni multiple test correction, P-value ≤ 0.05 / (8 estimates * 2 correlations tests). (b) Hierarchical clustering using Euclidean distance of genetic and phenotypic correlations among the eight BCF estimates. Colouring highlights each identified subgroup. (c) Venn diagram of shared loci between three subgroups of BCF estimates. Loci are named by the nearest gene. Colour indicates BCF sub-grouping from panel (b), (i) Disposition indexes: DI and DIBIG, (ii) 30’ and 120’ OGTT measurements: BIGTT-AIR, CIR, Stumvoll, xinsdG30, and xinsG30, (iii) fasting values: HOMA-β. (d) Venn diagram of BCF-GWAS loci. Each independent BCF lead association is named according to the nearest gene.
Extended Data Fig. 3
Extended Data Fig. 3. BMI influence on β-cell function (BCF) loci.
BMI influence on BCF-loci for (a) xinsG30, (b) xinsdG30, (c) CIR, (d) Stumvoll, (e) DI, and (f) HOMA-β. Each panel includes Miami plots showing -log10 association P-values with and without BMI-adjustment on the y-axis. Chromosome and genome locations in hg19 are provided on the x-axis. Variants that reached genome-wide significance (P-value ≤ 5x10⁻⁸) (indicated by orange dots) were tested for heterogeneity (two-sided P-values) of the effect sizes (right panel). Significant heterogeneous variants are coloured red. The right panel compares effect sizes (Z-scores) without and with BMI-adjustment (x and y-axis, respectively). The -log10 P-values from the heterogeneity test are used as the colouring scheme, with significant heterogeneous loci labelled by the nearest gene. The significance threshold was Bonferroni-adjusted for the number of independent loci (P-value < 0.05 / 55).
Extended Data Fig. 4
Extended Data Fig. 4. Pleiotropic genetic effects between β-cell function (BCF) loci and other relevant traits and diseases.
(a) Heatmap representations show colocalization posterior probabilities from COLOC between each BCF trait and T2D, FG and BMI for 44 BCF loci. Heatmap colours indicate the strength of a shared causal variant hypothesis H4 between each combination of traits being examined. Grouping of BCF loci on the left follows Fig. 2b. (b-c) Insulin sensitivity effects on BCF were assessed by testing (two-sided P-values) for heterogeneity in effect sizes (as Z-scores) among genome-wide significant variants between (b) DI (x-axis) and xinsG30 (y-axis), and (c) DIBIG (x-axis) and BIGTT-AIR (y-axis). The colour legend indicates the -log10 (P-value) of the heterogeneity test estimate. Significant heterogeneous loci are labelled by the nearest gene. The significance threshold was adjusted by the number of independent loci using Bonferroni correction (P-value < 0.05 / 55). Source data
Extended Data Fig. 5
Extended Data Fig. 5. Epigenomic datasets and chromatin interaction maps in human pancreatic islets connect non-coding β-cell function (BCF) genetic associations with (a) SSTR1 and (b) SSTR2 genes.
Regional signal plots show P-values calculated from single-variant BCF GWAS meta-analyses on a -log10 scale (y-axis) across the hg19 genome build (x-axis). Variants are coloured according to their LD correlation (r2) with the lead association. Epigenomic datasets in human pancreatic islets, including chromatin accessibility, histone modifications and TF binding profiles, are shown along with enhancer-gene assignments from pcHi-C. Fine-mapped enhancer variants connected to each molecular effector gene are highlighted with circles coloured according to their LD (r2) with the lead association in the locuszoom plot.
Extended Data Fig. 6
Extended Data Fig. 6. eTWAS associations between β-cell function (BCF) indices and UBE2E2 and ITFG3 islet gene expression.
Forest plots of the lead eTWAS associations for UBE2E2 (a) and ITFG3 (f). For each of the eight BCF traits and T2D, the square represents the β-estimate, and the error bars indicate the 95% confidence intervals. Square size is based on precision, and the effect allele and variant rsid are provided at the top. Summary statistics data were generated here or obtained from Mahajan, A. et al.. Regional signal plots depict single-variant BCF GWAS meta-analyses P-values (-log10 scale, y-axis) and hg19 locations (x-axis) at the (b) UBE2E2 and (e) ITFG3 loci. LocusCompare scatter plots compare P-values from single-variant BCF GWAS meta-analyses and (c) UBE2E2 and (g) ITFG3 pancreatic islet eQTLs on the -log10 scale, respectively. The eTWAS P-value and the colocalization posterior probability (CPP) are provided at the top. Variants in regional signal plots and LocusCompare plots are coloured based on their LD correlation (r2) with the lead eTWAS association. Boxplots in panels (d) and (h) represent COMBAT normalized islet gene expression for each genotype of the lead eTWAS association for UBE2E2 and ITFG3, respectively. The data are derived from 399 human islet samples. Boxplots show first (lower) quartile, median, and third (upper) quartile, and whiskers indicate 1.5 x interquartile range. Chromatin state profiles in panel (e) highlight the enhancer harbouring the ITFG3-eTWAS rs56038902 signal, which is proximal to the ITFG3 promoter. Source data
Extended Data Fig. 7
Extended Data Fig. 7. sTWAS associations between β-cell function (BCF) traits and islet mRNA splicing of G6PC2 and GRB10 genes.
Forest plots of the lead sTWAS associations at G6PC2 (a) and GRB10 (e). For each of the eight BCF traits and glycaemic traits, the square shows the β-estimate, and the error bars indicate the 95% confidence intervals. Summary statistics data were generated in this study or obtained from large-scale transancestral meta-analyses (European-based estimates from Chen, J. et al.). Square sizes are based on precision. LocusCompare scatter plots compare the -log10 P-values for sQTLs of (b-c) G6PC2 and (g) GRB10 from Atla, A. et al., on the y-axis, with the -log10 P-values from BCF single-variant GWAS meta-analyses, on the x-axis. Variants are coloured based on the LD correlation (r2) with the lead sTWAS association. The sTWAS P-value and the colocalization posterior probability (CPP) are provided at the top. In panels (d) and (h), boxplots show normalized, batch-corrected junction PSI values stratified by the genotype of the lead sTWAS association. The data are derived from 399 human islet samples. Boxplots show the first (lower) quartile, median, and third (upper) quartile, with whiskers extending to 1.5 times the interquartile range. IGV was used for the visualization of splice junctions depicted at the top of the boxplots, with arrow indicating the splice junction selected from sTWAS analysis. Regional signal plot at panel (f) shows single-variant BCF-GWAS meta-analyses P-values (-log10 scale, y-axis) and hg19 locations (x-axis) for the GRB10 locus. Source data
Extended Data Fig. 8
Extended Data Fig. 8. Human pancreatic islet cell type-specific gene expression of selected β-cell function (BCF) candidate genes.
(a) The heatmap displays raw count matrices for selected genes from human pancreatic cells, as reported by Baron, M. et al., measured by single-cell RNA-seq. The data underwent log1p normalization with a scale factor of 10000 and were averaged across each available cell type. Source data
Extended Data Fig. 9
Extended Data Fig. 9. Examining the effects of ACSL1 and CENPU downregulation on insulin release.
(a) ACSL1 mRNA expression levels assessed by qPCR after 72h transfection with scramble (control) and ACSL1 siRNA1-2 in human EndoC-βH1 cells. (b) Acsl1 mRNA expression levels after 72h transfection with scramble (control) and Acsl1 siRNA1-2 in INS-1 832/13 rat insulinoma cells, measured by qPCR. (c) Measurement of insulin content relative to total protein level in INS-1 832/13 cells. (d) Insulin secretion levels normalized by total insulin content in response to high glucose (16.7 mM) in INS-1 832/13 cells. (e) Cenpu mRNA expression levels assessed by qPCR after 72h transfection with scramble (control) and Cenpu siRNA1 in INS-1 832/13 cells. (f) Insulin secretion levels in response to high glucose (16.7 mM) concentration in INS-1 832/13 cells. (g) Measurement of total insulin content in INS-1 832/13 cells. (h) Insulin secretion normalization for total insulin content in response to high glucose (16.7 mM) concentration. Bar plots in panels (a-h) depict mean +/- SE from three (a) and four (b-h) independent replicates. Two-sided Student’s t-test was used for panels (c,e,g). One-way analysis of variance (ANOVA) followed by Tukey post-hoc test was used for panels (a,b,d,f,h). Panels (i) and (j) show morphology changes in INS-1 832/13 cells after transfection with scramble and Cenpu siRNA1, respectively. Images from a basic optical microscope, where scale bars are not available. Source data
Extended Data Fig. 10
Extended Data Fig. 10. β-cell function (BCF) associations influence FAM46C pancreatic islet gene expression and T2D related traits.
(a) ATAC-seq and ChIP-seq data for histone modifications and islet-specific transcription factors are presented. An enhancer-gene assignment, inferred from pcHi-C data (coloured in purple), connects the islet enhancer containing rs1975283 to the FAM46C promoter. The rs1975283 variant, fine-mapped by BIGTT-AIR GWAS data and identified as a FAM46C islet eQTL, leads the eTWAS association between FAM46C islet expression and multiple BCF traits. (b) Forest plot of the lead rs1975283FAM46C eTWAS association. For each of the eight BCF traits, as well as glycaemic levels and T2D risk, the square represents the β-estimate, and the error bars indicate the 95% confidence intervals. Summary statistics data were generated in this study or obtained from Chen, J. et al. (European-based estimates) and Mahajan, A. et al.. Square sizes are based on precision. (c) LocusCompare scatter plot compares FAM46C islet eQTL (x-axis) and single-variant BIGTT-AIR GWAS meta-analyses (y-axis) P-values on the -log10 scale. The eTWAS P-value and the colocalization posterior probability (CPP) are provided at the top. Variants are coloured based on their LD correlation with the lead eTWAS association (rs1975283). (d) Boxplot of COMBAT normalized expression values for the FAM46C gene stratified by the genotype of the lead rs1975283 eTWAS association. The data are derived from 399 human islet samples. Boxplots show first (lower) quartile, median, and third (upper) quartile, and whiskers indicate 1.5 x interquartile range. (e) FAM46C gene expression in human EndoC-βH1 cells assessed by qPCR 72h after transfection with scramble (control) and FAM46C siRNA1-2. (f-g) Insulin secretion levels in response to (f) high glucose (16.7 mM) and (g) KCl in EndoC-βH1 cells. (h) Fam46c gene expression in rat INS-1 832/13 cells assessed by qPCR 72h after transfection with scramble (control) and Fam46c siRNA1-2. (i-k) Insulin secretion in response to (i) high glucose, (j) KCl, and (k) pyruvate in INS-1 832/13 cells. (l-n) Insulin secretion levels, normalized to total insulin content in response to (l) high glucose, (m) KCl, and (n) pyruvate in INS-1 832/13 cells. Bar plots in panels (e-n) represent mean +/- SE. Panels (e-g) include data from three independent replicates, while panels (h-n) include data from four independent replicates for Fam46c siRNA1, and three replicates for Fam46c siRNA2. One-way analysis of variance (ANOVA) followed by Tukey’s post-hoc test was used for statistical analysis in all panels (e-n). Source data

References

    1. Defronzo, R. A. From the triumvirate to the ominous octet: a new paradigm for the treatment of type 2 diabetes mellitis. Diabetes58, 773–795 (2009). - PMC - PubMed
    1. Bonnefond, A. & Froguel, P. Rare and common genetic events in type 2 diabetes: What should biologists know? Cell Metab.21, 357–368 (2015). - PubMed
    1. Rose, C. S. et al. A −30G>A polymorphism of the β-cell-specific glucokinase promoter associates with hyperglycemia in the general population of whites. Diabetes54, 3026–3031 (2005). - PubMed
    1. Ingelsson, E. et al. Detailed physiologic characterization reveals diverse mechanisms for novel genetic loci regulating glucose and insulin metabolism in humans. Diabetes59, 1266–1275 (2010). - PMC - PubMed
    1. Grarup, N. et al. Studies of association of variants near the HHEX, CDKN2A/B, and IGF2BP2 genes with type 2 diabetes and impaired insulin release in 10,705 Danish subjects. Diabetes56, 3105–3111 (2007). - PubMed

MeSH terms