. 2024 Oct 17;15(1):8959.
doi: 10.1038/s41467-024-52863-9.

MINCLE and TLR9 agonists synergize to induce Th1/Th17 vaccine memory and mucosal recall in mice and non-human primates

Affiliations

MINCLE and TLR9 agonists synergize to induce Th1/Th17 vaccine memory and mucosal recall in mice and non-human primates

Joshua S Woodworth et al. Nat Commun. .

Abstract

Development of new vaccines tailored for difficult-to-target diseases is hampered by a lack of diverse adjuvants for human use, and none of the currently available adjuvants induce Th17 cells. Here, we develop a liposomal adjuvant, CAF®10b, that incorporates Mincle and Toll-like receptor 9 agonists. In parallel mouse and non-human primate studies comparing to CAF® adjuvants already in clinical trials, we report species-specific effects of adjuvant composition on the quality and magnitude of the responses. When combined with antigen, CAF®10b induces Th1 and Th17 responses and protection against a pulmonary infection with Mycobacterium tuberculosis in mice. In non-human primates, CAF®10b induces higher Th1 responses and robust Th17 responses detectable after six months, and systemic and pulmonary Th1 and Th17 recall responses, in a sterile model of local recall. Overall, CAF®10b drives robust memory antibody, Th1 and Th17 vaccine-responses via a non-mucosal immunization route across both rodent and primate species.


Conflict of interest statement

JSW, GKP, DC and RM are co-inventors of a patent covering the use of CAF®10b and derivatives. All rights have been assigned to Statens Serum Institut (SSI). DC was employed by SSI during the time of the study, but is now employed by Croda Pharma that, among others, develops and produces immunostimulators, adjuvants and delivery systems for vaccines. The remaining authors declare no competing interests.

Figures

Fig. 1
Fig. 1. TLR9 agonists increase CAF®-mediated Th1/Th17 responses in mice.
A CB6F1 mice immunized 2x SC with H56 protein antigen adsorbed to DDA/MMG liposomes alone (Ø) or combined with various TLR agonists (TLR4, monophosphoryl lipid; TLR7, 3M-052; TLR9, CpG1826) in independent experiments and assessed after 2 weeks by antigen stimulation of splenocytes for IFNγ and IL-17 A secretion by ELISA. Bars, mean ± SD fold change compared to DDA/MMG alone (Ø). Symbols, individual mice, n = 5/grp (Exp1) n = 67grp (Exp2). B HEK-BlueTM reporter cells expressing human TLR9 (left) or murine TLR9 (right) were stimulated in vitro with decreasing concentrations (100, 10, 1 µg/ml) of CpG2006 (grey bars) or CpG1826 (black bars) for 17 hrs and supernatants assayed for SEAP activity by HEK-Blue detection QUANTI-Blue™ (shown as OD655). The experiment was performed twice. C Splenocytes from CB6F1 mice immunized 2x SC with H56 protein combined with 10 µg CpG2006 alone or DDA/MMG liposomes ± 10 µg CpG2006 assessed 2 weeks after immunization for IFNγ and IL-17A secretion by ELISA. Bars, mean ± SD; symbols, individual mice n = 10/grp and n = 2 naïve, ANOVA with Tukey’s posttest adjusted for multiple comparisons, p values < 0.1 shown D CB6F1 mice immunized 2x SC with DDA/MMG liposomes combined with various amounts of CpG2006 (left) or CpG1826 (right) adsorbed with H56 protein antigen, and two weeks later, PBMCs stimulated ex vivo with protein antigen to assess secreted IFNγ (blue) and IL-17A (red) by ELISA. Symbols indicate mean ± SD, n = 8/grp and n = 2 naïve, ANOVA with Dunnett’s posttest adjusted for multiple comparisons, p values < 0.1 shown. E The depicted CAF®10b adjuvant was assessed for zeta potential (ZP) (left), particle size (top right) and polydispersity index (bottom right) over 25 days. Source data are provided as a Source Data file.
Fig. 2
Fig. 2. CAF® induction of Th1 and Th17 responses in mice.
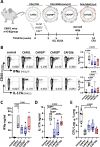
A CB6F1 mice were immunized with the H107 antigen adsorbed to different CAF® adjuvants as depicted. B–D Splenocytes taken 2 weeks after the last immunization of control (n = 4) and H107/CAF®-immunized mice (n = 6/group) were stimulated ex vivo with H107. B Analysis of CD4 T cells following ICS assay from each vaccine group showing representative dot plots (left) where the number shown depicts % cytokine positive CD4 T cells (singlets→ live → lymphocytes → CD3+ →CD8-, CD4 + ) and bar plots (right). C, D ELISAs for IFNγ C and IL-17A D secretion from H107-stimulated splenocytes. E Bacterial load in the lungs of control and H107/CAF®-immunized mice (n = 8/group) 4 weeks after aerosol Mtb infection. B–E Symbols display individual mice; Bars represent median, IQR, min. and max values. P values, one-way ANOVA with Tukey’s posttest. Source data are provided as a Source Data file.
Fig. 3
Fig. 3. CAF® adjuvant comparison in Non-Human Primates.
Cynomolgus macaques were immunized with the H107 antigen adsorbed to different CAF® adjuvants as depicted. Animals were monitored for baseline, initial, and memory immune responses in the blood (serum, PBMC). In the antigen recall phase, animals were administered non-adjuvanted H107 protein antigen into the lung and skin and the systemic (serum, PBMC) and local (skin, BAL) recall responses assessed.
Fig. 4
Fig. 4. IgG and IgA responses are influenced by vaccine composition.
H107-specific IgG AC and IgA (DF) antibody levels in the serum measured by ELISA before and after H107/CAF® immunization of non-human primates, n = 5/group. A, D Immunizations are indicated by dotted lines. Symbols represent median ±IQR of arbitrary units. B, E Peak responses at week 6. C,F Responses integrated over the 30-week time course calculated as area under the curve (AUC) after baseline subtraction are depicted. B,C,E,F Bars represent median ± IQR, min. and max. Symbols, individual animals. P values, one-way ANOVA with Dunnett’s post-hoc test adjusted for multiple comparisons of log-transformed data. Source data are provided as a Source Data file.
Fig. 5
Fig. 5. CAF® adjuvant induction of Th1 and Th17 responses and whole blood signatures differ in NHP.
A, B PBMCs from immunized Non-human primates assessed by ELISpot before and after immunizations. PBMCs were stimulated ex vivo with an overlapping H107 peptide pool for (A) IFNγ or (B) H107-protein for IL-17A production. Symbols and lines indicate individual animals (left panels), n = 5/group. Memory responses at 30 weeks post first immunization corrected for pre-immunization baseline SFC and plotted for each H107/CAF® immunized group (A, B right panels). Bars represent median ± IQR, min. and max. Symbols, individual animals, n = 5/group. P values shown from two-sided Mann-Whitney U tests. Kruskal-Wallis test (A) p = 0.038 (B) p = 0.1253. C, D Whole genome expression of immunized NHP assessed via mRNA sequencing of blood samples taken at baseline and one day after each immunization. C Principle components analysis (PCA) comparing overall gene expression of baseline (black), H107:CAF10b (red), and H107:CAF®09hi (blue) after the first (Imm.1, left) or second (Imm.2, right) immunization. symbols, individual NHP; circles, 95% confidence intervals. D Gene Set Enrichment Analyses (GSEA) of selected pathways. Normalized enrichment score (NES) calculated based on differential expression between imm.1 and baseline for individual animals normalized to mitigate differences of the gene set size; Kolmogorov–Smirnov-like two-tailed test with p-values adjusted by Benjamini–Hochberg method. E THP1-DualTM cells stimulated overnight with serial 2-fold dilutions of CAF® liposome formulations, from 25 µg to 3.125 µg/mL DDA, were assessed for induction of IRF-driven secreted luciferase. Bars, fold increase versus untreated cells, mean ± SD of triplicates, representative data from two similar experiments. Source data are provided as a Source Data file.
Fig. 6
Fig. 6. In vivo antigen delivery to vaccinated animals and transient local responses.
Six months after the final immunization, non-human primates were given an in vivo antigen recall in the skin and lungs with H107, or a control protein, as shown in A. B PET-CT scans of H107/CAF®10b-immunized (n = 5) and randomly selected Control (n = 3) animals depicting local lung inflammatory responses 3 days after H107 antigen recall, as standardized uptake value (SUV) > 1.6. C The SUV maximum fold change relative to pre-recall (day 0) for the antigen-receiving lung lobes at 3 and 7 days after antigen recall for all the NHPs assessed by PET-CT. Source data are provided as a Source Data file.
Fig. 7
Fig. 7. In vivo antigen delivery recalls local and systemic memory responses.
Six months after the final immunization, non-human primates were given an in vivo antigen recall in the skin and lungs with H107, or a control protein, as shown in (Fig. 6). A Serum H107-specific IgG (left) and IgA (right) antibody levels as measured by ELISA before (pre) and post in vivo antigen recall of H107/CAF®-immunized Non-human primates. Symbols represent mean ± SD of arbitrary units, n = 5/grp. B, C PBMCs from control and H107/CAF®-immunized NHPs (n = 5/grp) were assessed by ELISpot assay pre- and post in vivo antigen recall. PBMCs were stimulated ex vivo for H107-specific (B) IFNγ and (C) IL-17A production as in Fig. 5. D The percentage of CD4 T cells isolated from skin biopsies collected from control antigen (Ctrl Ag) and H107 protein ID injection sites that express IFNγ, TNF, IL-2, IL-17, and/or IL-13 after ex vivo stimulation with H107 protein, as assessed by intracellular cytokine staining (ICS), n = 5/grp. E Sample contour plots of ICS analysis of CD4 T cells isolated from the BAL of a representative H107/CAF®10b-immunized animal 8 days after in vivo antigen (left), and the resultant summary data of the total % H107-specific cytokine-expressing BAL CD4 T cells. Bars represent median ± IQR, min. and max. Symbols, individual animals, n = 5/grp, n = 4 CAF®09lo. P values, two-sided Mann-Whitney U tests. Kruskal-Wallis test p = 0.0097. F The percentage of cytokine-producing CD4 T cells from PBMC samples collected pre- and post-in vivo antigen recall assessed IFNγ, TNF, IL-2, IL-17, and/or IL-13 after ex vivo stimulation with H107 protein. BD, F Symbols and lines, individual animals n = 5/grp. P values within groups from two-sided paired T test. G Principle component analysis (PCA) of H107-specific CD4 T cells from BAL (red) and PBMC (blue) for IL-17 and combinatorial IFNγ/TNF/IL-2 expression. PC1 and PC2 loading axes shown. Symbol, individual H107/CAF®-immunized animals, n = 5/grp. Source data are provided as a Source Data file.

References

    1. Pulendran, B., S Arunachalam, P. & O’Hagan, D. T. Emerging concepts in the science of vaccine adjuvants. Nat. Rev. Drug Discov.20, 454–475 (2021). - PMC - PubMed
    1. Sarkar, I., Garg, R. & van Drunen Littel-van den Hurk, S. Selection of adjuvants for vaccines targeting specific pathogens. Expert Rev. Vaccines18, 505–521 (2019). - PMC - PubMed
    1. Rodo, M. J. et al. A comparison of antigen-specific T cell responses induced by six novel tuberculosis vaccine candidates. PLoS Pathog.15, e1007643 (2019). - PMC - PubMed
    1. Wilk, M. M. et al. Lung CD4 Tissue-Resident Memory T Cells Mediate Adaptive Immunity Induced by Previous Infection of Mice with Bordetella pertussis. J. Immunol.199, 233–243 (2017). - PubMed
    1. Dijkman, K. et al. Prevention of tuberculosis infection and disease by local BCG in repeatedly exposed rhesus macaques. Nat. Med25, 255–262 (2019). - PubMed

Publication types

MeSH terms

Associated data