. 2024 Oct 18;15(1):8990.
doi: 10.1038/s41467-024-53148-x.

Multimodal gradients of basal forebrain connectivity across the neocortex

Affiliations

Multimodal gradients of basal forebrain connectivity across the neocortex

Sudesna Chakraborty et al. Nat Commun. .

Abstract

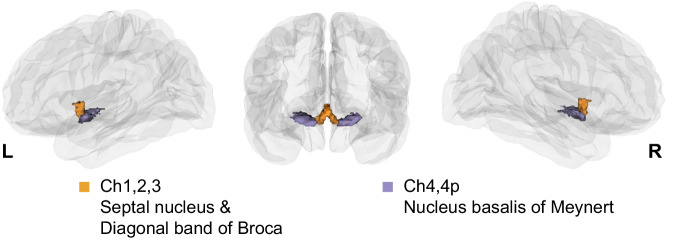
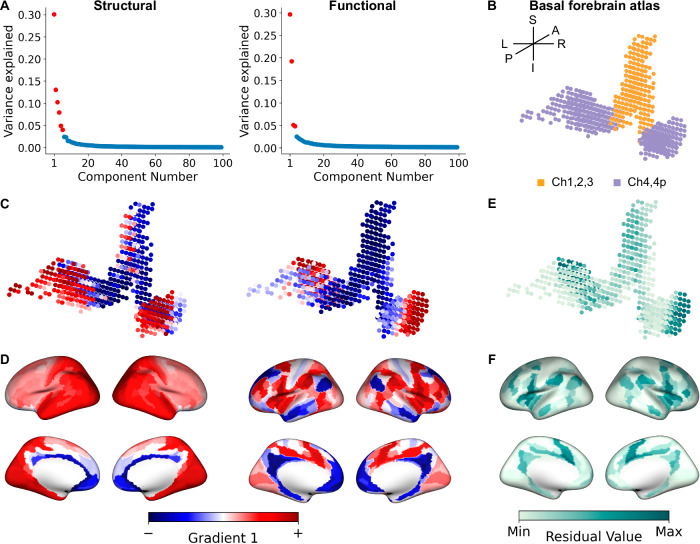
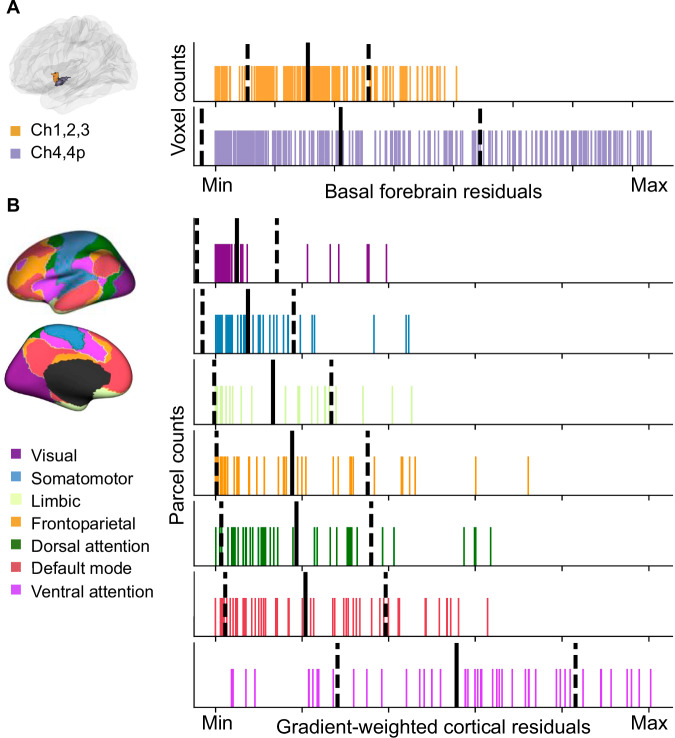
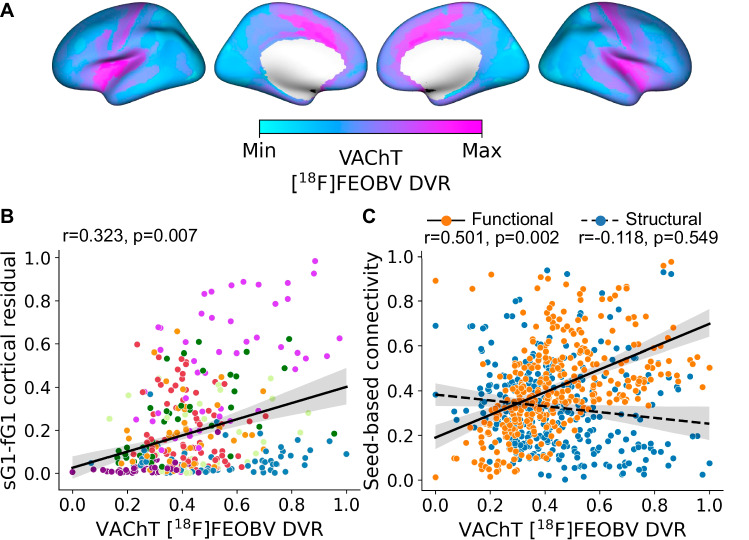
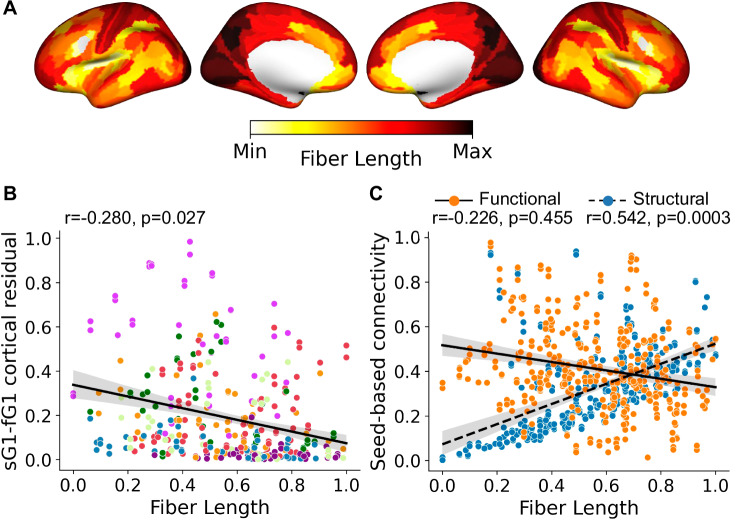
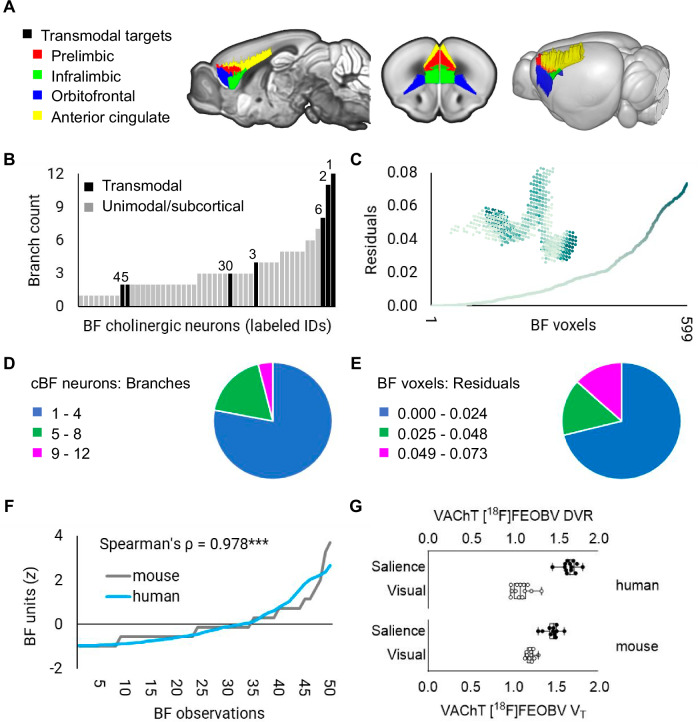
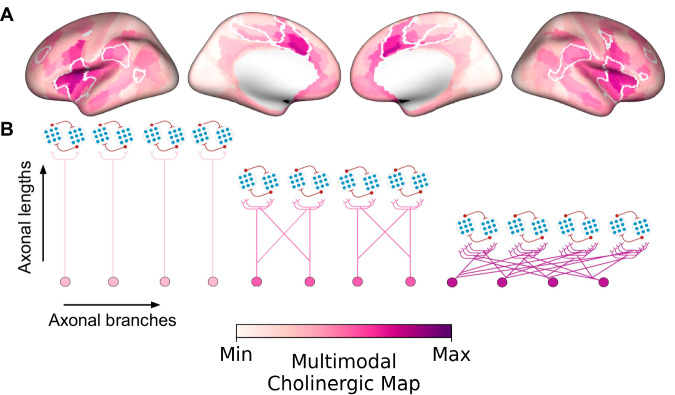
Cortical cholinergic projections originate from subregions of the basal forebrain (BF). To examine its organization in humans, we computed multimodal gradients of BF connectivity by combining 7 T diffusion and resting state functional MRI. Moving from anteromedial to posterolateral BF, we observe reduced tethering between structural and functional connectivity gradients, with the lowest tethering in the nucleus basalis of Meynert. In the neocortex, this gradient is expressed by progressively reduced tethering from unimodal sensory to transmodal cortex, with the lowest tethering in the midcingulo-insular network, and is also spatially correlated with the molecular concentration of VAChT, measured by [18F]fluoroethoxy-benzovesamicol (FEOBV) PET. In mice, viral tracing of BF cholinergic projections and [18F]FEOBV PET confirm a gradient of axonal arborization. Altogether, our findings reveal that BF cholinergic neurons vary in their branch complexity, with certain subpopulations exhibiting greater modularity and others greater diffusivity in the functional integration with their cortical targets.


Conflict of interest statement

The authors declare no competing interests.

Figures

Fig. 1
Fig. 1. A 3D view of histologically defined basal forebrain (BF) subdivisions defined by Zaborsky et al. projected on a glass brain.
The anteromedial nuclei are displayed in yellow, and the posterolateral nuclei in purple.
Fig. 2
Fig. 2. Basal forebrain (BF) gradients of structural and functional connectivity.
A Scree plots showing the variance explained by each gradient of structural (left) and functional connectivity (right). Gradients falling above the knee-point are denoted as red. Source data are provided as a Source Data file (see Data Availability). B The BF atlas projected into 599 voxels color-coded according to a priori histologically defined anteromedial or posterolateral nuclei. C The first principal gradient of the BF based on structural (sG1; left) and functional (fG1; right) connectivity both revealed an anteromedial to posterolateral axis. The lower bound of gradient values is represented by blue (−), while the upper bound is represented by red (+). D Gradient-weighted cortical maps corresponding to sG1 (left) and fG1 (right). E Residual values encoding tethering between structural and functional connectivity at each BF voxel. Darker green values indicate lower tethering (higher values, max squared residual value = 7.32 × 102), while lighter green indicates higher tethering (lower values, min squared residual value = 5.16 × 10−7) between structural and functional connectivity. F Gradient-weighted cortical maps corresponding to structure-function tethering. Darker green values indicate lower tethering (higher values, max squared residual value = 1.004 × 10−3), while lighter green indicates higher tethering (lower values, min squared residual value = 2.36 × 10−11) between structural and functional connectivity.
Fig. 3
Fig. 3. Distributions of basal forebrain (BF) and cortical residuals.
A Rug plots showing the distribution of residuals within the a priori histologically defined anteromedial (Ch1,2,3) and posterolateral (Ch4,4p) BF nuclei. The solid black line indicates the mean, and the dashed lines indicate +/− one standard deviation. The minimum and maximum values correspond to the same scale as in Fig. 2E, with the minimum indicating lower squared residual values (higher tethering) and the maximum indicating higher squared residual values (lower tethering). B Rug plots showing the distribution of residuals within each of the 7 intrinsic resting-state networks identified by Yeo et al.. The color-coding for different networks is based on the original parcellation. The solid black line indicates the mean, and the dashed lines indicate +/− one standard deviation. The minimum and maximum values correspond to the same scale as in Fig. 2F. Source data are provided as a Source Data file.
Fig. 4
Fig. 4. Multimodal gradients of basal forebrain (BF) connectivity in relation to in vivo molecular imaging of VAChT with [18F]FEOBV PET.
A Average VAChT concentrations for 13 cognitively normal younger adults reveal the density of presynaptic cholinergic terminals across the cortical surface. The values of each cortical parcel were rescaled between 0 (Min, light blue) and 1(Max, pink), Max indicating a higher concentration of cholinergic nerve terminals. B The spatial relationship of cortical VAChT concentrations (panel A) with the cortical map encoding BF structure-function tethering (Fig. 2F). Each point in the scatter plot represents cortical parcels based on HCP-MMP 1.0 parcellation color-coded according to the Yeo networks (Fig. 3B). Spin tests, as implemented in the neuromaps toolbox, were used to calculate Pearson’s correlation and p-value based on n = 10k permutations. The solid line is the regression line. The shaded area represents the size of the 95% confidence interval for the regression estimate. The confidence interval is estimated using a non-parametric bootstrap procedure. C The spatial relationship of cortical VAChT concentrations (panel A) with seed-based connectivity for the BF structural (blue) and functional (orange) datasets. Spin tests, as implemented in the neuromaps toolbox, were used to calculate Pearson’s correlation and p-value based on n = 10k permutation. The solid line is the regression line. The shaded area represents the size of the 95% confidence interval for the regression estimate. The confidence interval is estimated using a non-parametric bootstrap procedure. Source data are provided as a Source Data file.
Fig. 5
Fig. 5. Multimodal gradients of basal forebrain (BF) connectivity in relation to diffusion tractography estimates of white matter fiber lengths.
A Average white matter fiber lengths for 173 cognitively normal younger adults reveal cortical areas receiving the longest BF projections located in the primary visual and somatomotor cortices. The values of each cortical parcel were rescaled between 0 (Min, yellow) and 1(Max, dark red), Max indicating the longest white matter fibers from the BF. B The spatial relationship of BF white matter fiber lengths (panel A) with the cortical map encoding BF structure-function tethering (Fig. 2F). Each point in the scatter plot represents cortical parcels based on HCP-MMP 1.0 parcellation color-coded according to the Yeo networks (Fig. 3B). Spin tests, as implemented in the neuromaps toolbox, were used to calculate Pearson’s correlation and p-value based on n = 10k permutations. The solid line is the regression line. The shaded area represents the size of the 95% confidence interval for the regression estimate. The confidence interval is estimated using a non-parametric bootstrap procedure. C The spatial relationship of BF white matter fiber lengths (panel A) with seed-based connectivity for the BF structural (blue) and functional (orange) datasets. Spin tests, as implemented in the neuromaps toolbox, were used to calculate Pearson’s correlation and p-value based on n = 10k permutations. The solid line is the regression line. The shaded area represents the size of the 95% confidence interval for the regression estimate. The confidence interval is estimated using a non-parametric bootstrap procedure. Source data are provided as a Source Data file.
Fig. 6
Fig. 6. Cortical wiring costs and geodesic distances for basal forebrain (BF) projections.
A Streamline count representing the number of BF streamlines reaching each of the HCP-MMP cortical parcels. The values of each cortical parcel were rescaled between 0 (Min) and 1(Max), Max indicating the highest streamline counts. B Wiring costs represent the BF white matter streamline counts for each cortical parcel weighted by their average fiber lengths, (Fig. 5A). The values of each cortical parcel were rescaled between 0 (Min) and 1(Max). Wiring costs are highest (Max) in primary visual and somatomotor cortices. C Geodesic distances from the BF to each parcel on the cortical surface. The values were rescaled between 0 (Min) and 1(Max), with Max encoding the longest geodesic distance from BF.
Fig. 7
Fig. 7. A cortical gradient of basal forebrain (BF) arborization in mouse and human.
A In a whole brain atlas of mouse BF cholinergic neurons2 (n = 50), 7/50 labeled neurons targeted transmodal (iso)cortical areas, color-coded on sagittal, coronal, and 3D renders of the Allen Mouse Brain Atlas. B The number of distinct brain-wide targets for each of the 50 BF cholinergic neurons (branch counts) were ranked low to high. Black bars denote neurons targeting transmodal areas (panel A), and numerical label IDs correspond to individual neurons in Supplemental Fig. 7 of Li et al.. C The residual values encoding BF structure-function tethering in humans across 599 voxels of the BF region-of-interest (inset) were ranked low to high. D and E For mouse and human, distributions of cholinergic basal forebrain (cBF) neuronal branching and BF voxel residuals were split into tertiles to examine the concentrations of values (higher versus lower) relative to the total number of observations. F The rank-ordered residuals across 599 BF voxels (downsampled to 50, blue) are superimposed over the branch counts of 50 mouse neurons (light gray) shown in panel (B). G Box-and-whiskers plots with individual values superimposed from in vivo [18F]FEOBV PET data for ventral attention and visual networks (human, n = 13) and salience network regions (panel A) and a visual cortical control ROI (mice, n = 11). Box hinges mark the 25th and 75th percentiles, whiskers extend to minimum and maximum values, and the middle line indicates the median. Source data are provided as a Source Data file. *** = p < 0.001.
Fig. 8
Fig. 8. Multimodal map of the human basal forebrain (BF) cholinergic innervation.
A A cortical surface emphasizing the arborization gradient of BF cholinergic neurons was constructed by summing the intensity normalized maps encoding (1) BF structure-function tethering, (2) cortical VAChT concentration, and (3) fiber lengths of BF white matter projections. The tethering and fiber length maps were sign flipped such that maximum values on the scale reflect higher VAChT, lower tethering, and shorter fiber lengths. The highest convergence of these three features selectively colocalizes midcingulo-insular hubs of the ventral attention network (white boundaries derived from Yeo et al.). B Depending on the subregional point of origin within the BF (anteromedial or posterolateral) and cortical target, BF cholinergic neurons may exhibit either a modular (more neurons, fewer branches) or diffuse (fewer neurons, more branches) profile of arborization.

Update of

References

    1. Mesulam, M. M., Mufson, E. J., Levey, A. I. & Wainer, B. H. Cholinergic innervation of cortex by the basal forebrain: cytochemistry and cortical connections of the septal area, diagonal band nuclei, nucleus basalis (substantia innominata), and hypothalamus in the rhesus monkey. J. Comp. Neurol.214, 170–197 (1983). - PubMed
    1. Li, A. et al. Generation of a whole-brain atlas for the cholinergic system and mesoscopic projectome analysis of basal forebrain cholinergic neurons. Proc. Natl. Acad. Sci. USA115, 415–420 (2017). - PMC - PubMed
    1. Do, J. P. et al. Cell type-specific long-range connections of basal forebrain circuit. Elife5, e13214 (2016). - PMC - PubMed
    1. Wu, H., Williams, J. & Nathans, J. Complete morphologies of basal forebrain cholinergic neurons in the mouse. Elife3, e02444 (2014). - PMC - PubMed
    1. Muñoz, W. & Rudy, B. Spatiotemporal specificity in cholinergic control of neocortical function. Curr. Opin. Neurobiol.26, 149–160 (2014). - PMC - PubMed

Publication types

LinkOut - more resources