. 2024 Oct 17;7(1):1341.
doi: 10.1038/s42003-024-07034-3.

Identification of tauopathy-associated lipid signatures in Alzheimer's disease mouse brain using label-free chemical imaging

Affiliations

Identification of tauopathy-associated lipid signatures in Alzheimer's disease mouse brain using label-free chemical imaging

Hao Meng et al. Commun Biol. .

Abstract

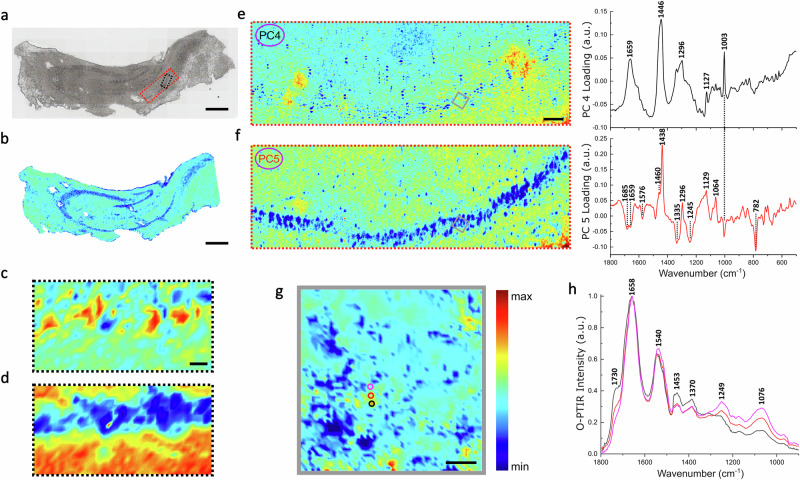
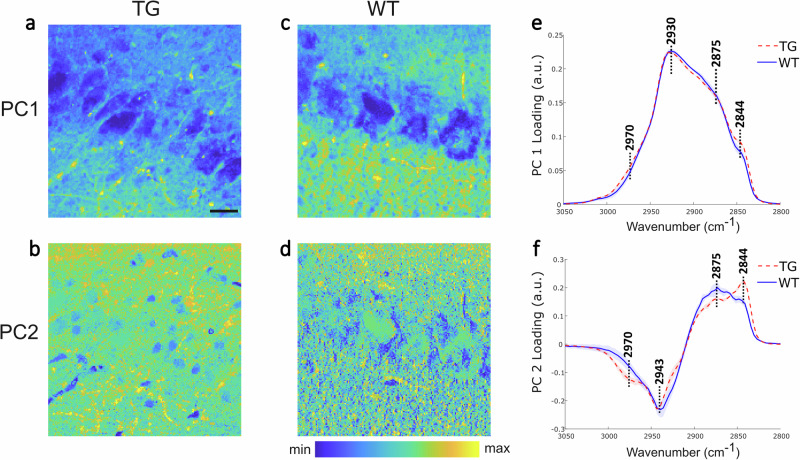
There is cumulative evidence that lipid metabolism plays a key role in the pathogenesis of various neurodegenerative disorders including Alzheimer's disease (AD). Visualising lipid content in a non-destructive label-free manner can aid in elucidating the AD phenotypes towards a better understanding of the disease. In this study, we combined multiple optical molecular-specific methods, Fourier transform infrared (FTIR) spectroscopic imaging, synchrotron radiation-infrared (SR-IR) microscopy, Raman and stimulated Raman scattering (SRS) microscopy, and optical-photothermal infrared (O-PTIR) microscopy with multivariate data analysis, to investigate the biochemistry of brain hippocampus in situ using a mouse model of tauopathy (rTg4510). We observed a significant difference in the morphology and lipid content between transgenic (TG) and wild type (WT) samples. Immunohistochemical staining revealed some degree of microglia co-localisation with elevated lipids in the brain. These results provide new evidence of tauopathy-related dysfunction in a preclinical study at a subcellular level.


Conflict of interest statement

The authors declare no competing interests.

Figures

Fig. 1
Fig. 1. Experimental workflow.
Visual illustration of our approach where a suite of micro-spectroscopic methods was applied following the order of increasing spatial resolution and decreasing field of view, from whole tissue to subcellular imaging. The brain hippocampus from TG and WT mice was sectioned and mounted on calcium fluoride slides, before being analysed by FTIR imaging, SR-IR, Raman and O-PTIR microscopy (top panel). Hydrated tissue sections were imaged using SRS microscopy followed by immunohistochemical staining and fluorescence imaging for validation (bottom panel).
Fig. 2
Fig. 2. Multimodal imaging of an ex vivo TG mouse hippocampal section conducted using FTIR spectroscopic imaging, SR-IR, Raman, and O-PTIR microscopy.
a White light image of the hippocampal section. The red and black dashed boxes indicate areas where hyperspectral Raman and SR-IR maps were obtained, respectively. Scale bar: 500 µm. b Micro-FTIR spectroscopic image based on the integrated absorbance of the lipid ester band (1761–1720 cm−1). The blue arc denotes the pyramidal layer. Scale bar: 500 µm. c, d SR-IR maps based on the integrated absorbance of the Amide I (1716–1600 cm−1) and lipid ester band (1761–1720 cm−1). Scale bar: 20 µm. e, f Raman score maps (left panel) and loading plots (right panel) of principal components PC4 and PC5. PC4 loadings mainly contain signatures of proteins: 1659 (Amide I), 1446 cm−1 (CH2 bending), 1296 cm−1 (CH2 deformation), 1127 cm−1 (CN stretching), and 1003 cm−1 (CC symmetric stretching), whilst PC5 presents lipid signals at 1438 cm−1 and 1296 cm−1 (CH2 deformation), 1129 cm−1 and 1064 cm−1 (CC skeletal stretching) as well as negative peaks associated with proteins and DNA: 1659 cm−1 (Amide I), 1245 cm−1 (Amide III) and 782 cm−1 (ring breathing of DNA). The PC5 score map directly reveals the lipid distribution in the tissue, which highlights the location of pyramidal neurons as lacking lipid content. The grey box in the score maps indicates an area measured with O-PTIR microscopy. Scale bar: 50 µm. g O-PTIR image based on the 1730 cm−1-to-1658 cm−1 intensity ratio, with locations of representative spectra indicated by circles. The colour bar indicates a gradient from low (blue) to high (red) intensity for all false-colour images. Scale bar: 10 µm. h Representative O-PTIR spectra, max-min normalised, from selected locations in g.
Fig. 3
Fig. 3. Characterization of TG and WT mouse hippocampal sections with SRS imaging.
ad SRS images of TG (top panel) and WT (bottom panel) pyramidal neurons and surrounding tissue acquired at 2844 cm−1 (CH2 symmetric stretching) and 2930 cm−1 (CH3 symmetric stretching). e, f Merged images at the two wavenumbers above for TG and WT samples with arrows indicating the nucleus (green), lipid droplet (magenta) and lipid-rich filament (cyan). Scale bar: 20 µm.
Fig. 4
Fig. 4. Results of SOM-PCA applied to SRS hyperspectral maps of TG and WT mouse hippocampal sections.
ad SOM-PCA score maps of PC1 and PC2 of an ROI in TG and WT samples. Scale bar: 20 µm; colour coding: blue (low) to yellow (high). e, f PC1 and PC2 loading plots (line) with standard deviation (shaded area) for the TG (red dashed) and WT (blue solid) samples. PC1 denotes the average spectrum of the tissue area, whilst PC2 represents the regions with high lipid-to-protein ratio. The peaks are at 2844 cm−1 (CH2 symmetric stretching), 2875 cm−1 (CH2 asymmetric stretching), 2943 cm−1 (CH3 symmetric stretching), and 2970 cm−1 (CH3 asymmetric stretching of cholesterol ester).
Fig. 5
Fig. 5. Results of common k-means cluster analysis of SRS hyperspectral maps of TG and WT mouse hippocampal sections across an individual ROI (132.6 × 132.6 µm2, 512 × 512 pixels).
a, c Merged images of TG and WT mouse hippocampus at 2844 cm−1 and 2930 cm−1. b, d Images derived from common k-means cluster analysis with four clusters. e Cluster centroid spectra. Main peaks are: 2844 cm−1 (CH2 symmetric stretching), 2875 cm−1 (CH2 asymmetric stretching) and 2930 cm−1 (CH3 symmetric stretching). f Bar plot showing the fraction of each cluster from three data sets of TG (red) and WT (blue) samples, including thirty ROIs in total. *P < 0.1, **P < 0.01. Scale bar: 20 µm (black).
Fig. 6
Fig. 6. Images derived from correlative immunofluorescence and SRS microscopy on TG tissue sections co-stained with DAPI (nuclei; blue) and either GFAP (astrocytes; green) or Iba-1 (microglia; magenta).
a, b Immunofluorescence images show the distribution of neurons (DAPI), astrocytes (GFAP) and microglia (Iba-1). Red boxes denote areas for comparison between the two techniques. c, d Spatial segmentation obtained from k-means cluster analysis with 5 clusters. e, f Close-up view of the fluorescence (left), k-means cluster analysis (middle) and overlay images (right). The partial correspondence between staining and clusters may be due to limitations in the staining protocol (i.e. without Triton X-100). Scale bars: 20 µm.

Similar articles

Cited by

References

    1. World Health Organization, https://www.who.int/news-room/fact-sheets/detail/dementia (2023).
    1. Daroff, R. B. & Aminoff, M. J. Encyclopedia of The Neurological Sciences (Academic press, 2014).
    1. Rudge, J. D. A. A New Hypothesis for Alzheimer’s Disease: The Lipid Invasion Model. J. Alzheimers. Dis. Rep.6, 129–161 (2022). - PMC - PubMed
    1. Marschallinger, J. et al. Lipid-droplet-accumulating microglia represent a dysfunctional and proinflammatory state in the aging brain. Nat. Neurosci.23, 194–208 (2020). - PMC - PubMed
    1. Shimabukuro, M. K. et al. Lipid-laden cells differentially distributed in the aging brain are functionally active and correspond to distinct phenotypes. Sci. Rep.6, 23795 (2016). - PMC - PubMed