

Local inconsistency detection using the Kullback-Leibler divergence measure
- PMID: 39420381
- PMCID: PMC11487772
- DOI: 10.1186/s13643-024-02680-4
Local inconsistency detection using the Kullback-Leibler divergence measure
Abstract
Background: The standard approach to local inconsistency assessment typically relies on testing the conflict between the direct and indirect evidence in selected treatment comparisons. However, statistical tests for inconsistency have low power and are subject to misinterpreting a p-value above the significance threshold as evidence of consistency.
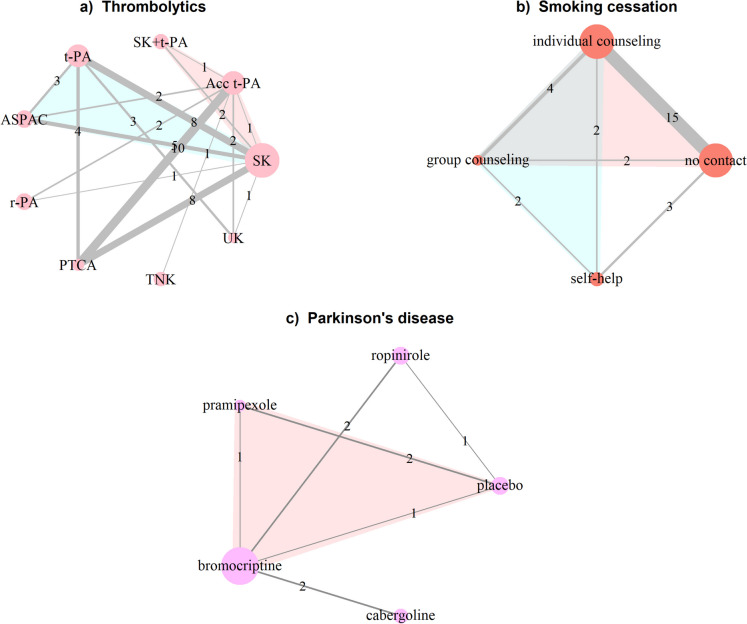
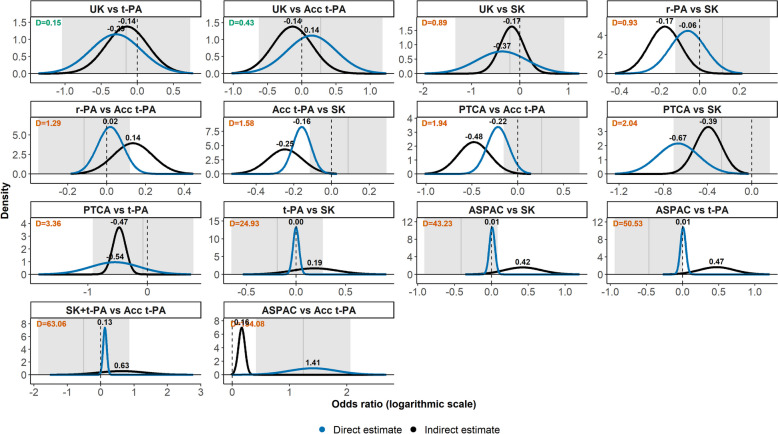
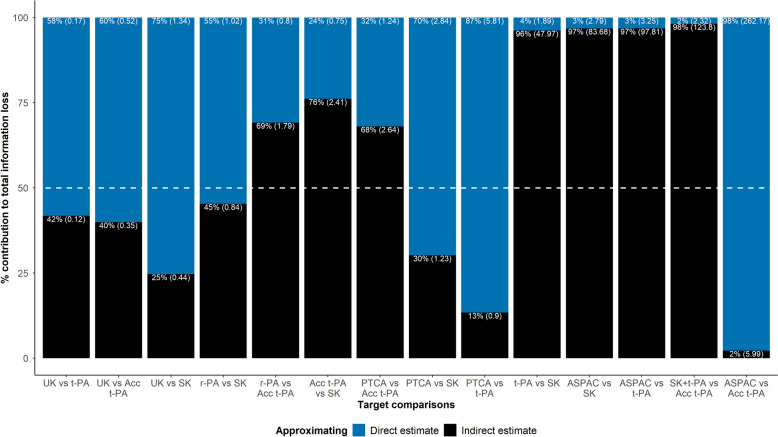
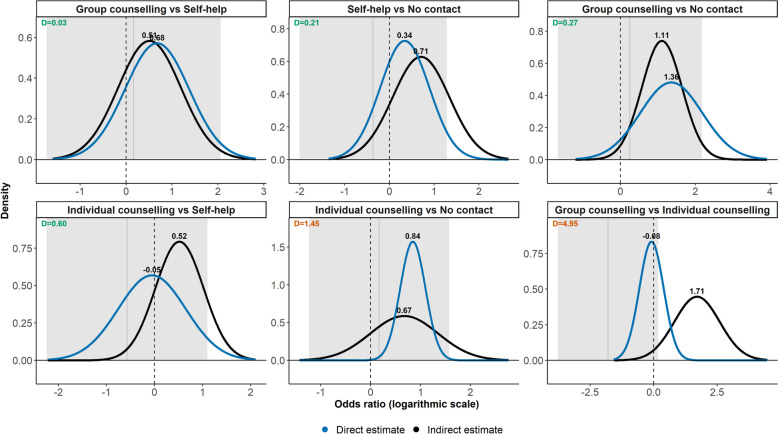
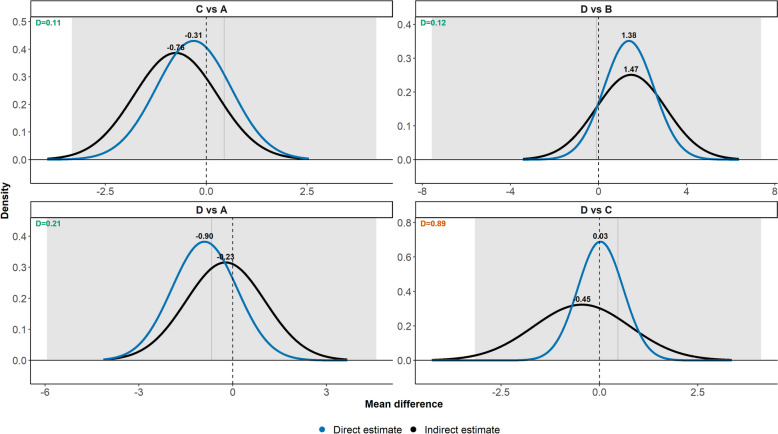
Methods: We propose a simple framework to interpret local inconsistency based on the average Kullback-Leibler divergence (KLD) from approximating the direct with the corresponding indirect estimate and vice versa. Our framework uses directly the mean and standard error (or posterior mean and standard deviation) of the direct and indirect estimates obtained from a local inconsistency method to calculate the average KLD measure for selected comparisons. The average KLD values are compared with a semi-objective threshold to judge the inconsistency as acceptably low or material. We exemplify our novel interpretation approach using three networks with multiple treatments and multi-arm studies.
Results: Almost all selected comparisons in the networks were not associated with statistically significant inconsistency at a significance level of 5%. The proposed interpretation framework indicated 14%, 66%, and 75% of the selected comparisons with an acceptably low inconsistency in the corresponding networks. Overall, information loss was more notable when approximating the posterior density of the indirect estimates with that of the direct estimates, attributed to indirect estimates being more imprecise.
Conclusions: Using the concept of information loss between two distributions alongside a semi-objectively defined threshold helped distinguish target comparisons with acceptably low inconsistency from those with material inconsistency when statistical tests for inconsistency were inconclusive.
Keywords: Consistency; Information loss; Kullback–Leibler divergence; Network meta-analysis.
© 2024. The Author(s).
Conflict of interest statement
The author declares no competing interests.
Figures

Similar articles
-
Evaluation of inconsistency in networks of interventions.Int J Epidemiol. 2013 Feb;42(1):332-45. doi: 10.1093/ije/dys222. Int J Epidemiol. 2013. PMID: 23508418 Free PMC article.
-
Inconsistency between direct and indirect comparisons of competing interventions: meta-epidemiological study.BMJ. 2011 Aug 16;343:d4909. doi: 10.1136/bmj.d4909. BMJ. 2011. PMID: 21846695 Free PMC article.
-
A Generic Formula and Some Special Cases for the Kullback-Leibler Divergence between Central Multivariate Cauchy Distributions.Entropy (Basel). 2022 Jun 17;24(6):838. doi: 10.3390/e24060838. Entropy (Basel). 2022. PMID: 35741558 Free PMC article.
-
Overall similarity and consistency assessment scores are not sufficiently accurate for predicting discrepancy between direct and indirect comparison estimates.J Clin Epidemiol. 2013 Feb;66(2):184-91. doi: 10.1016/j.jclinepi.2012.06.022. Epub 2012 Nov 24. J Clin Epidemiol. 2013. PMID: 23186991 Free PMC article. Review.
-
NICE DSU Technical Support Document 4: Inconsistency in Networks of Evidence Based on Randomised Controlled Trials [Internet].London: National Institute for Health and Care Excellence (NICE); 2014 Apr. London: National Institute for Health and Care Excellence (NICE); 2014 Apr. PMID: 27466656 Free Books & Documents. Review.
Cited by
-
Construction and Enhancement of a Rural Road Instance Segmentation Dataset Based on an Improved StyleGAN2-ADA.Sensors (Basel). 2025 Apr 15;25(8):2477. doi: 10.3390/s25082477. Sensors (Basel). 2025. PMID: 40285169 Free PMC article.
-
Comparison of intravascular imaging, physiological assessment and angiography for coronary revascularization in acute coronary syndrome: a systematic review and network meta-analysis.Front Cardiovasc Med. 2025 Jul 21;12:1604050. doi: 10.3389/fcvm.2025.1604050. eCollection 2025. Front Cardiovasc Med. 2025. PMID: 40761230 Free PMC article.
References
-
- Ades AE, Welton NJ, Dias S, Phillippo DM, Caldwell DM. Twenty years of network meta-analysis: continuing controversies and recent developments. Res Synth Methods. 2024. 10.1002/jrsm.1700. - PubMed
-
- Jansen JP, Fleurence R, Devine B, Itzler R, Barrett A, Hawkins N, et al. Interpreting indirect treatment comparisons and network meta-analysis for health-care decision making: report of the ISPOR Task Force on Indirect Treatment Comparisons Good Research Practices: part 1. Value Health. 2011;14(4):417–28. - PubMed
MeSH terms
Grants and funding
LinkOut - more resources
Full Text Sources
