. 2024 Nov 5;96(44):17496-17505.
doi: 10.1021/acs.analchem.4c02016. Epub 2024 Oct 17.

DNA Origami Incorporated into Solid-State Nanopores Enables Enhanced Sensitivity for Precise Analysis of Protein Translocations

Affiliations

DNA Origami Incorporated into Solid-State Nanopores Enables Enhanced Sensitivity for Precise Analysis of Protein Translocations

Kamruzzaman Joty et al. Anal Chem. .

Abstract

The rapidly advancing field of nanotechnology is driving the development of precise sensing methods at the nanoscale, with solid-state nanopores emerging as promising tools for biomolecular sensing. This study investigates the increased sensitivity of solid-state nanopores achieved by integrating DNA origami structures, leading to the improved analysis of protein translocations. Using holo human serum transferrin (holo-hSTf) as a model protein, we compared hybrid nanopores incorporating DNA origami with open solid-state nanopores. Results show a significant enhancement in holo-hSTf detection sensitivity with DNA origami integration, suggesting a unique role of DNA interactions beyond confinement. This approach holds potential for ultrasensitive protein detection in biosensing applications, offering advancements in biomedical research and diagnostic tool development for diseases with low-abundance protein biomarkers. Further exploration of origami designs and nanopore configurations promises even greater sensitivity and versatility in the detection of a wider range of proteins, paving the way for advanced biosensing technologies.


Figures

Figure 1.
Figure 1.
Experimental setup and representative current traces for the octahedron DNA origami trapped hybrid nanopore, facilitating protein translocations of holo-hSTf. (a) Schematic of origami trapping (first three panels) and holo-hSTf translocation through origami trapped hybrid solid-state nanopore (last panel). A typical open pore current trace (red) before the origami is loaded on the cis side usually gets trapped in the pore with two steps under an applied potential. The short drop in current (light blue) indicates the origami trapped in the nanopore, which, after a few seconds, leads to deeper and longer blockades (dark blue), suggesting stabilization within seconds, allowing it to stably remain in the pore until the electrophoretic force is removed. To study origami–protein interactions, holo-hSTf was added to the trans side of the flow cell under continuous applied potential and an origami being already trapped; a typical current trace of holo-hSTf passing through the hybrid nanopore (teal). A constant transmembrane potential of +200 mV was applied throughout the experiments for all data collection. All of the data were collected with a 10 kHz low pass Bessel filter with a sampling frequency of 250 kHz. (b) Measurement of open pore conductance in the nanopore with 0.5 M (red) and 1 M LiCl (green), where Go represents the conductance of open nanopore and Gh represents the conductance of hybrid nanopore. Conductance after a single origami is trapped in 0.5 M LiCl (dark blue) and 1 M LiCl (orange) is only recorded at positive voltage bias, as they exit at opposite bias. (c) A typical platonic octahedron wire-frame DNA origami structure. (d) TEM image of DNA origami octahedra.
Figure 2.
Figure 2.
Quantitative analysis of DNA origami and holo-hSTf interactions. (a) Current blockades distribution of holo-hSTf protein through an open pore (red) and through a hybrid nanopore (dark blue). (b) Dwell time distribution of holo-hSTf protein in an open pore and through a trapped origami. (c) Event area analysis revealing distinct characteristics in hybrid nanopore. In all the figures (a–c), solid line represents the fitted curve of the histogram. (d) Correlation analysis: scatter plot depicting relative current blockade vs dwell time of translocation holo-hSTf (number of events > 3163) in an open pore (red circle) and hybrid pore (blue diamond). All the data were taken by adding 100 pM DNA origami to the cis side and 5 nM holo-hSTf to the trans side in symmetric electrolyte of 0.5 M LiCl, 10 mM tris, pH ~ 8.0, using ~25 nm SSN.
Figure 3.
Figure 3.
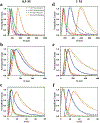
Comparative analysis of holo-hSTf translocations through open and hybrid nanopores in 0.5 and 1 M LiCl and KCl electrolytes of pH ~ 8. In the left column, a–c) are the distributions obtained from the data taken using 0.5 M LiCl (number of events > 3163) and KCl (number of events > 1405) electrolytes. In the right column, (d–f) are the distributions obtained from the data taken using 1 M LiCl (number of events > 2203) and KCl (number of events > 1923) electrolytes. (a) and (d) represent the current blockade distribution of translocating holo-hSTf through open and hybrid nanopore, (b) and (e) represent their dwell time distributions, and (c) and (f) are the distributions of the event area. All the data are taken using LiCl through open nanopore are represented in red, while translocations through hybrid nanopores are depicted in blue. Likewise, translocations in KCl through open SSN are represented in green, and through hybrid nanopores in orange. Dashed lines indicate the histogram obtained from the raw data of holo-hSTf translocations, while solid lines with respective colors represents the fitted curves.
Figure 4.
Figure 4.
Statistical analysis of translocation parameters in LiCl and KCl solutions (0.5 and 1 M). (a–c) Comparative means analysis extracted from fitted curves: (a) mean current drop analysis, (b) mean dwell time analysis, and (c) mean event area analysis. (d) Illustration of the capture rate of the holo-hSTf with respect to salt concentration in both LiCl and KCl through open nanopore and hybrid nanopore. (e) and (f) show the mean current blockade and dwell time, respectively, versus pore diameter in 0.5 M LiCl and 0.5 M KCl. In all plots, translocations in LiCl through SSNs are represented in red, while translocations through hybrid nanopores are depicted in dark blue. Translocations in KCl through open nanopores are represented in green and through hybrid nanopores in orange. This comprehensive analysis provides insight into the statistical significance of translocation parameters, enhancing our understanding of the influence of the salt concentration on solid-state nanopore dynamics. Error bars represent the inter-nanopore variability observed from multiple experiments using different nanopores under the same conditions.
Figure 5.
Figure 5.
Comparative analysis of holo-hSTf translocations through open and hybrid nanopores having the same conductance. (a) Current blockades distribution of holo-hSTf protein in an open pore (red) and through a trapped origami (dark blue). (b) Dwell time distribution of holo-hSTf protein in an open pore and through a hybrid nanopore. (c) Event area analysis revealing distinct characteristics in hybrid nanopores. In all the panels (a–c), solid lines represent the fitted curve of the histogram. (d) Correlation analysis: scatter plot depicting relative current blockade vs dwell time of translocation holo-hSTf in an open pore (red circle) and origami trapped (blue diamond) pore. The data set that represents the origami trap was collected after a ~25 nm pore was fabricated and then trapping an origami onto the pore, resulting conductance is equivalent to a ~23 nm open nanopore. Although the open pore and hybrid pore both have similar conductance, the hybrid pore has shown enhanced sensitivity.

Similar articles

Cited by

References

    1. Chen Z; Wang C; Hao L; Gao R; Li F; Liu S Biosens. Bioelectron 2019, 128, 104–112. - PubMed
    1. Meunier-Prest R; Bouyon A; Rampazzi E; Raveau S; Andreoletti P; Cherkaoui-Malki M Biosens. Bioelectron 2010, 25 (12), 2598–2602. - PubMed
    1. Diculescu VC; Chiorcea-Paquim A-M; Oliveira-Brett AM TrAC, Trends Anal. Chem 2016, 79, 23–36.
    1. Song S; Wang L; Li J; Fan C; Zhao J TrAC, Trends Anal. Chem 2008, 27 (2), 108–117.
    1. Vierstra J; Stamatoyannopoulos JA Nat. Methods 2016, 13 (3), 213–221. - PubMed

Publication types

LinkOut - more resources