Review
. 2024 Oct 14:12:e18153.
doi: 10.7717/peerj.18153. eCollection 2024.

Wind energy and insects: reviewing the state of knowledge and identifying potential interactions

Affiliations
Review

Wind energy and insects: reviewing the state of knowledge and identifying potential interactions

Michelle Weschler et al. PeerJ. .

Abstract

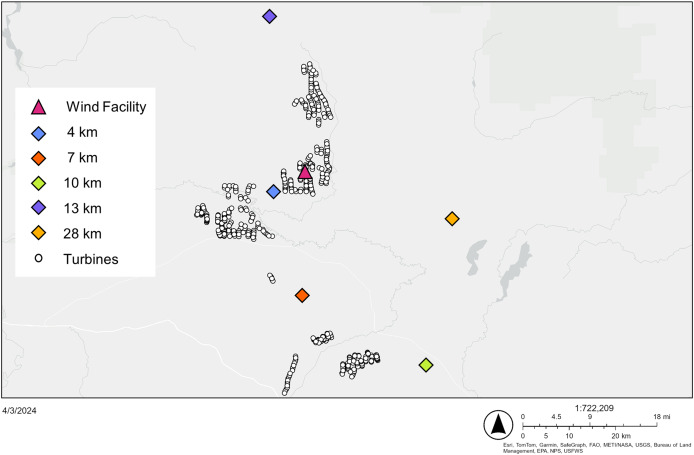
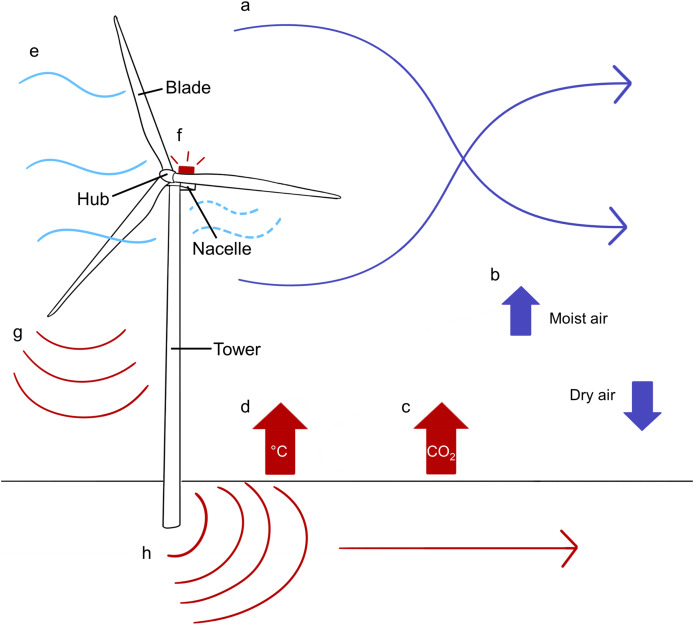
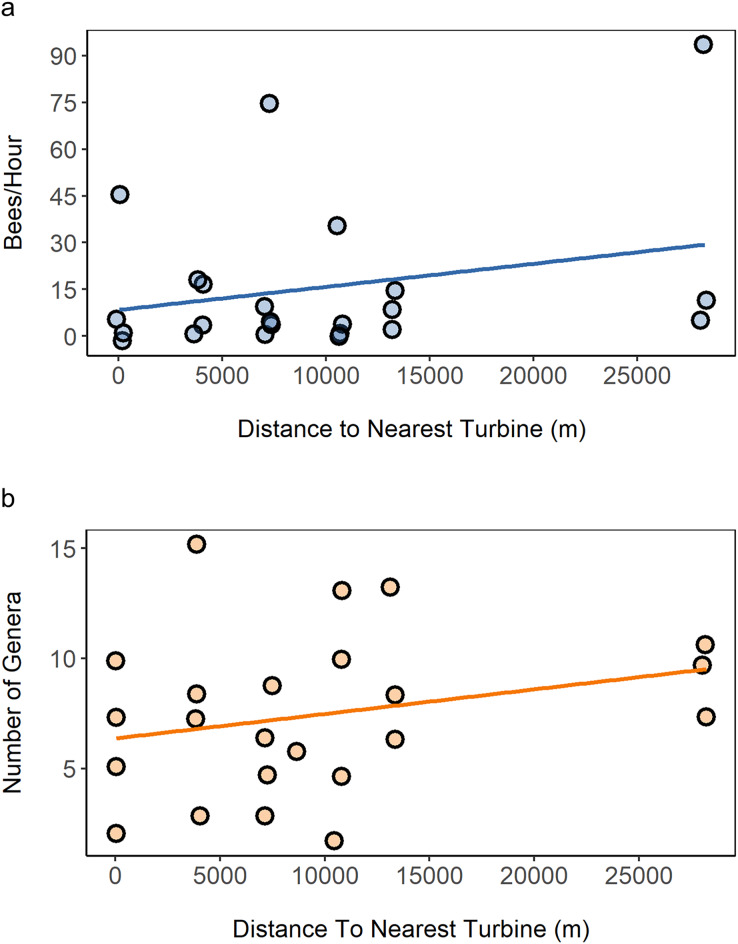
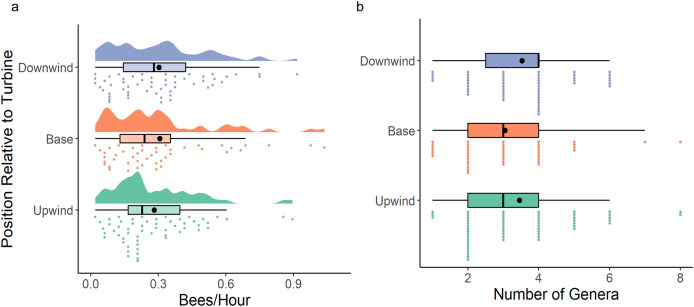
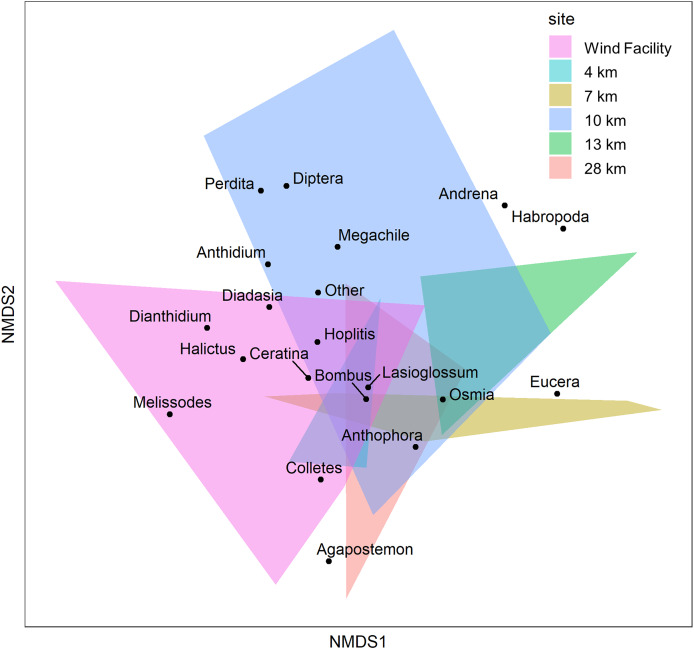
In 2023 the wind industry hit a milestone of one terawatt of installed capacity globally. That amount is expected to double within the next decade as billions of dollars are invested in new wind projects annually. Wildlife mortality is a primary concern regarding the proliferation of wind power, and many studies have investigated bird and bat interactions. Little is known about the interactions between wind turbines and insects, despite these animals composing far more biomass than vertebrates. Turbine placement, coloration, shape, heat output, and lighting may attract insects to turbines. Insects attract insectivorous animals, which may be killed by the turbines. Compiling current knowledge about these interactions and identifying gaps in knowledge is critical as wind power grows rapidly. We reviewed the state of the literature investigating insects and wind energy facilities, and evaluated hypotheses regarding insect attraction to turbines. We found evidence of insect attraction due to turbine location, paint color, shape, and temperature output. We provide empirical data on insect abundance and richness near turbines and introduce a risk assessment tool for comparing wind development with suitable climate for insects of concern. This understudied topic merits further investigation as insects decline globally. Compiling information will provide a resource for mitigation and management strategies, and will inform conservation agencies on what insects may be most vulnerable to the expansion of wind technologies.

Keywords: Energy production; Insect behavior; Insect physiology; Invertebrates; Mitigation; Renewable energy; Wildlife effects.


Conflict of interest statement

The authors declare that they have no competing interests.

Figures

Figure 1
Figure 1. 2022 sampling sites in relation to wind turbine locations.
Location of six sampling sites in southeastern Wyoming, U.S., where insects were collected via vane trap and active netting for our case study in 2022. Distances in the legend indicate how far each site was from the closest operating turbine. Turbine location data provided by the US Wind Turbine Database. See Dataset S2. Basemap accessed on 4/3/2024. Basemap source: Esri. Data for basemap provided by: Esri, TomTom, Garmin, SafeGraph, FAO, METI/NASA, USGS, Bureau of Land Management, EPA, NPS and USFWS.
Figure 2
Figure 2. Ways turbines influence the abiotic environment of the habitat they are sited in.
The main components of a horizontal axis wind turbine (HAWT). Turbines can influence the abiotic environment via (a) vertical mixing of air layers and increased turbulence, (b) changes in humidity, (c) increased carbon dioxide respiration, (d) warming of near-surface air temperatures at night, (e) reduction in wind speed at hub height, (f) light pollution from obstruction lighting, (g) production of audible noise, and (h) production of infrasound. Graphics credit: Michelle Weschler via Sketchbook.
Figure 3
Figure 3. The presence of insect orders found in aerial insect surveys taken at different heights in the atmosphere.
Patterns and colors represent different aerial surveys. The area of each bubble is relative to the proportion of each order found in the survey. The black turbine represents the average total height for turbines in the United States in 2022 (164 m) The grey turbine represents the maximum total height of turbines under construction in the United States as of 2022 (225 m). The red dashed line represents the average insect flight boundary level (10 m). Survey data from Chapman et al. (2004), de Jong et al. (2021), Freeman (1945), and Hardy & Milne (1938). All invertebrate silhouettes were sourced from https://www.phylopic.org and have been dedicated to the public domain. The wind turbine icon was provided by Microsoft.
Figure 4
Figure 4. Distance to turbines did not influence measures of insect populations.
(A) Catch rate of bees at different distances to the nearest turbine where each point represents the sum of catch rates for traps placed at the same site on the same day (three to six traps). (B) Number of bee genera caught at different distances to turbines where each point represents the sum of genera caught in traps placed at the same site on the same date (three to six traps). All data comes from the 2022 case study. See Dataset S2.
Figure 5
Figure 5. Results for catch rate and generic richness locally around turbines at ground level.
(A) The catch rate of bees within the wind energy facility did not differ significantly based on differing placement of traps (upwind, downwind, or adjacent to the base of the turbine tower). (B) The number of genera caught did not differ significantly bases on differing placement of traps; however traps adjacent to the base of the tower tended to catch a slightly lower number of genera. The black dots indicate mean values. These results combine data collected from the case study and Dority (2019). Upwind and downwind traps were 30–110 m away from turbines in Dority (2019), and 50–100 m away in our case study. Traps at the base were <5 m away for both studies. See Dataset S2.
Figure 6
Figure 6. NMDS showing insect assemblages collected at six field sites.
Sites are organized in the legend by their distance to turbines, with the wind energy site being the closest and the reference site being the farthest away (~28 km). The 10 km site and wind energy site show the most difference among other sites, however all sites show some overlap with others, showing general similarity. The axes are arbitrary, the differences between species and sites can be interpreted from distance between points and polygons. See Dataset S2.
Figure 7
Figure 7. Method of capture influenced catch rate in combined study data.
Insect catch rate per trap for active netting, and vane traps and pan traps set out at different (A) temperatures and (B) wind speeds in three studies in southeast Wyoming, U.S. from 2016, 2017, and 2022. Each point represents a different trap or session of netting. Includes data from case study, Dority (2019) and Crawford et al. (2023a). See Dataset S2.
Figure 8
Figure 8. Ommatidia make up the compound eye of an insect.
The structure of an (A) individual ommatidia in the compound eye, (B) a close-up image of the compound eye of a bee, and (C) many ommatidia fitting together to make up part of a compound eye. Photo credit: Michelle Weschler. Graphics credit: Michelle Weschler via Sketchbook.
Figure 9
Figure 9. Potential negative influences of anthropogenic noise on insect behavior and physiology.
Figure 10
Figure 10. The overlap of potential wind development with suitable climate for the Regal Fritillary butterfly.
Overlaps between Regal Fritillary climate and wind development are shown in purple for the (A) open access scenario, (B) reference scenario and (C) limited access scenario while areas of no overlap are shown in green. The darkest shades represent the most suitable climate. Histograms show the amount of land in units of 1,000 km2 that has the potential for wind energy development in the (D) open access scenario, (E) reference scenario and (F) limited access scenario in purple. Green represents area that is not at risk to be developed within each scenario. See linked online supplemental dataset. Map shapefile source: U.S. Census Bureau.
Figure 11
Figure 11. The overlap of potential wind development with suitable climate for the Dakota Skipper butterfly.
Overlaps between Dakota Skipper climate and wind development are shown in purple for the (A) open access scenario, (B) reference scenario and (C) limited access scenario while areas of no overlap are shown in green. The darkest shades represent the most suitable climate. Histograms show the amount of land in units of 1,000 km2 that has the potential for wind energy development in the (D) open access scenario, (E) reference scenario and (F) limited access scenario in purple. Green represents area that is not at risk to be developed within each scenario. See linked online supplemental dataset. Map shapefile source: U.S. Census Bureau.
Figure 12
Figure 12. Turbines may cause understudied trophic cascades.
(A) Top-down and (B) bottom-up trophic cascades influenced by wind turbine presence and operation showing both direct (solid line) and indirect (dashed line) effects. Negative influences are shown in red; positive interactions are shown in blue. Graphic credit: Michelle Weschler via Sketchbook.

References

    1. Acharya RS, Burke JM, Leslie T, Loftin K, Joshi NK. Wild bees respond differently to sampling traps with vanes of different colors and light reflectivity in a livestock pasture ecosystem. Scientific Reports. 2022;12(1):9783. doi: 10.1038/s41598-022-10286-w. - DOI - PMC - PubMed
    1. Acharya RS, Leslie T, Fitting E, Burke J, Loftin K, Joshi NK. Color of pan trap influences sampling of bees in livestock pasture ecosystem. Biology. 2021;10(5):445. doi: 10.3390/biology10050445. - DOI - PMC - PubMed
    1. Adkins KA, Sescu A. Wind farms and humidity. Energies. 2022;15(7):2603. doi: 10.3390/en15072603. - DOI
    1. Agnew RCN, Smith VJ, Fowkes RC. Wind turbines cause chronic stress in badgers (Meles meles) in Great Britain. Journal of Wildlife Diseases. 2016;52(3):459–467. doi: 10.7589/2015-09-231. - DOI - PubMed
    1. Allison TD, Diffendorfer JE, Baerwald EF, Beston JA, Drake D, Hale AM, Hein CD, Huso MM, Loss SR, Lovich JE. Impacts to wildlife of wind energy siting and operation in the United States. Issues in Ecology. 2019;21:2–18.