. 2024 Sep 5;15(10):5706-5722.
doi: 10.1364/BOE.537828. eCollection 2024 Oct 1.

Ex vivo optical coherence tomography combined with near infrared targeted fluorescence: towards in-vivo esophageal cancer detection

Affiliations

Ex vivo optical coherence tomography combined with near infrared targeted fluorescence: towards in-vivo esophageal cancer detection

Margherita Vaselli et al. Biomed Opt Express. .

Abstract

Early detection of (pre)malignant esophageal lesions is critical to improve esophageal cancer morbidity and mortality rates. In patients with advanced esophageal adenocarcinoma (EAC) who undergo neoadjuvant chemoradiation therapy, the efficacy of therapy could be optimized and unnecessary surgery prevented by the reliable assessment of residual tumors after therapy. Optical coherence tomography (OCT) provides structural images at a (sub)-cellular level and has the potential to visualize morphological changes in tissue. However, OCT lacks molecular imaging contrast, a feature that enables the study of biological processes at a cellular level and can enhance esophageal cancer diagnostic accuracy. We combined OCT with near-infrared fluorescence molecular imaging using fluorescently labelled antibodies (immuno-OCT). The main goal of this proof of principle study is to investigate the feasibility of immuno-OCT for esophageal cancer imaging. We aim to assess whether the sensitivity of our immuno-OCT device is sufficient to detect the tracer uptake using an imaging dose (∼100 times smaller than a dose with therapeutic effects) of a targeted fluorescent agent. The feasibility of immuno-OCT was demonstrated ex-vivo on dysplastic lesions resected from Barrett's patients and on esophageal specimens resected from patients with advanced EAC, who were respectively topically and intravenously administrated with the tracer bevacizumab-800CW. The detection sensitivity of our system (0.3 nM) is sufficient to detect increased tracer uptake with micrometer resolution using an imaging dose of labelled antibodies. Moreover, the absence of layered structures that are typical of normal esophageal tissue observed in OCT images of dysplastic/malignant esophageal lesions may further aid their detection. Based on our preliminary results, immuno-OCT could improve the detection of dysplastic esophageal lesions.


Conflict of interest statement

JFdB has IP licensed to Terumo, Heidelberg Engineering and ASML and receives royalties through his employer. The other authors declare that they have no conflict of interest.

Figures

Fig. 1.
Fig. 1.
Schematic overview of study design for EMR/ESD specimens. After excision, the resected specimen is pinned to a silicon base, directly sprayed with the tracer and incubated for 5 minutes. After rinsing the specimen with water, fluorescence imaging is performed using the Pearl Trilogy and Immuno-OCT device. After histopathological processing, the 10 µm coupes are imaged with the Odyssey CLx device.
Fig. 2.
Fig. 2.
Schematic overview of study design for EAC specimen. Two areas (healthy and tumor area) are selected in the fresh surgical specimen and fluorescence imaging is performed with the SurgVision Explorer and the Immuno-OCT system. Bread loaf slicing and FFPE slicing is performed, and the 10 µm coupes cut from the FFPE blocks are imaged with the Odyssey CLx device.
Fig. 3.
Fig. 3.
Images of an ESD specimen resected from patient 1, containing superficial EAC tissue and non-dysplastic BE tissue. a) White light image of the specimen providing the ground truth validation regarding the lesion site. b) NIRF en-face image of the specimen acquired with the Pearl Trilogy system c) NIRF en-face image of the specimen acquired with our immuno-OCT system. The image is a collage of 22 adjacent scans. d) OCT cross-section corresponding to the location marked by the white line in Fig. 3(c). The cross-section shows that healthy esophageal tissue (on the left) and EAC (on the right) have different structural properties. The characteristic esophageal layers (Epithelium = Ep., Lamina propria = LP, Muscularis Mucosae = MM and Submucosa = SM) which are preserved in the healthy tissue, are missing in the EAC. e) AC cross-section corresponding to the same cross-section of Fig. 3(d). The co-registered 1D NIRF information, is shown in Fig. 3(d-e) as the white band with green peaks whose height is proportional to the intensity of the fluorescence signal. The latter shows a high fluorescence peak corresponding to the EAC margins. f) HE-stained slide corresponding to the cross-section in Fig. 3(d-e). Characteristic layers of the esophagus are visible (Ep., LP, MM, SM) on the left, and the EAC is observable on the right.
Fig. 4.
Fig. 4.
Images of an EMR specimen resected from patient 2, containing superficial EAC tissue and non-dysplastic BE tissue. a) White light image of the specimen providing the ground truth validation regarding the lesion site. b) NIRF en-face image of the specimen acquired with the Pearl Trilogy camera c) NIRF en-face image of the specimen acquired with our immuno-OCT device. The image is a collage of four adjacent scans. d) AC cross-section corresponding to the location marked by the white line in Fig. 4(c). The AC image shows that the scattering properties of the healthy tissue (on the left side of the scan) and those of the tumor (on the right side) are markedly different. In the healthy area of the scan, the layered structure of the EMR specimen and the typical mucosa of the gastric fundus are recognizable. Towards the central part, the specimen presents reactive changes and a gland surrounded by a thin epithelial layer is distinguishable. The right portion of the specimen, characterized by the presence of EAC, shows a loss of the layered structure typical for the esophageal wall. The co-registered 1D NIRF information is shown as the white band with green peaks whose height is proportional to the intensity of the fluorescence signal. e) HE-slide corresponding to the AC cross-section in Fig. 4(d). f) NIRF en-face image acquired with Odyssey camera of the 10 µm slide cut from the same FFPE block of the HE-slide of Fig. 4(f). The left part of the HE coupe is missing since it was damaged during one of the histological preparation steps. It can be noted that the highly fluorescent areas in this image correspond (taking into account tissue shrinking of the HE coupe) to the same axial location where the fluorescence peaks are observed in Fig. 4(d), as pointed out by the dotted line running from Fig. 4(d-f).
Fig. 5.
Fig. 5.
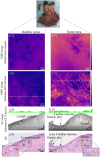
Results of the measurements performed on an EAC specimen resected from patient 3. Images from a healthy area on the esophageal lumen and tumor area in proximity of the gastroesophageal junction of the specimen are shown in Fig. 5(a) and 5(b) respectively. a.1) Wide-field NIRF image acquired with SurgVision Explorer camera of a 1 × 1 cm healthy area of the resected specimen. a.2) same area scanned with our Immuno-OCT system. a.3) AC cross-section corresponding to the location identified by the white line in Fig. 5(a).2. The AC-cross section shows the presence of a few lymph vessels. 1- dimensional NIRF information is displayed by the green lines in the upper part of the image. The length of each green bar is proportional to the NIRF intensity. a.4) HE histology corresponding to the AC cross-section in Fig. 5 b.1) Wide-field NIRF image acquired with SurgVision Explorer camera of a 1 × 1 cm tumor area of the resected specimen. b.2) The same area scanned with our NIRF scanner, shows high tracer uptake in the columnar epithelium of the stomach. b.3) AC cross-section corresponding to the location identified by the white line in Fig. 1(b).2. The irregular surface typical of the cardiac mucosa and the presence of gastric pits (low scattering areas within the cardiac mucosa) are visible on the left side of the cross-section. The right side of the cross-section shows the presence of a tumorous area in which no presence of characteristic structure is observed. 1- dimensional NIRF information is displayed by the green lines in the upper part of the image. The length of each green bar is proportional to the NIRF intensity. The one-dimensional NIRF data displayed along the scanning axis indicates high fluorescence signal corresponding to the axial location of the tumor. b.4) HE histology corresponding to the AC cross-section in Fig. 1(b).3. Histopathological examination of the HE histology confirmed the presence of tumor cells (indicated by the red arrows).
Fig. 6.
Fig. 6.
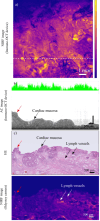
Results of the measurements performed on an inflamed area in proximity of the gastroesophageal junction of the EAC specimen resected from patient 3. a) NIRF en-face image of the lumen of the resected specimen acquired with our immuno-OCT system b) AC cross-section corresponding to the location marked by the white line in Fig. 6(a). Several lymph vessels are identifiable thanks to their lower scattering properties compared to the surrounding tissue, and cardiac type mucosa is distinguishable by its irregular surface. The co-registered 1D NIRF band shows the presence of fluorescence peaks indicating high levels of tracer uptake throughout the tissue. c) Histology slide corresponding to the AC cross-section in Fig. 6(b). Histological features visualized in the AC cross-sectional image of Fig. 6(b) are observed. The elevated number of lymph vessels and the amount of mucus suggests that the tissue is extremely reactive and inflamed. d) NIRF en-face image acquired with the Odyssey camera of the 10 µm slice cut from the same FFPE block from which the HE slide of Fig. 6(c) was cut. This enables visualization of the tracer distribution within the tissue and shows the presence of high fluorescence in correspondence with inflamed tissue, which presence is confirmed by the high amount of lymph vessels.

References

    1. Wei W., Rosenkrans Z. T., Liu J., et al. , “ImmunoPET: Concept, Design, and Applications,” Chem. Rev. 120(8), 3787–3851 (2020).10.1021/acs.chemrev.9b00738 - DOI - PMC - PubMed
    1. Kiyotani K., Toyoshima Y., Nakamura Y., et al. , “Personalized immunotherapy in cancer precision medicine,” Cancer Biol. Med. 18, 1 (2021).10.20892/j.issn.2095-3941.2021.0032 - DOI - PMC - PubMed
    1. Kircher M. F., Hricak H., Larson S. M., et al. , “Molecular imaging for personalized cancer care,” Mol Oncol 6(2), 182–195 (2012).10.1016/j.molonc.2012.02.005 - DOI - PMC - PubMed
    1. Debie P., Hernot S., “Emerging Fluorescent Molecular Tracers to Guide Intra-Operative Surgical Decision-Making,” Front. Pharmacol. 10, 510 (2019).10.3389/fphar.2019.00510 - DOI - PMC - PubMed
    1. Koller M., Qiu Si-Qi, Linssen M. D., et al. , “Implementation and benchmarking of a novel analytical framework to clinically evaluate tumor-specific fluorescent tracers,” Nat. Commun. 9(1), 3739 (2018).10.1038/s41467-018-05727-y - DOI - PMC - PubMed

LinkOut - more resources