

doi: 10.1364/BOE.537602.
eCollection 2024 Oct 1.
Stimulated Brillouin scattering flow cytometry
Affiliations
- PMID: 39421786
- PMCID: PMC11482170
- DOI: 10.1364/BOE.537602
Item in Clipboard
Stimulated Brillouin scattering flow cytometry
Biomed Opt Express.
.
Abstract
We present the use of stimulated Brillouin scattering spectroscopy to achieve rapid measurements of cell biomechanics in a flow cytometer setup. Specifically, our stimulated Brillouin scattering flow cytometry can acquire at a rate of 200 Hz, with a spectral acquisition time of 5 ms, which marks a 10x improvement compared to previous demonstrations of spontaneous Brillouin scattering flow cytometry. We experimentally validate our stimulated Brillouin scattering flow cytometer by measuring cell populations of normal breast epithelial cells and metastatic breast epithelial cancer cells.
© 2024 Optica Publishing Group.
Conflict of interest statement
None.
Figures
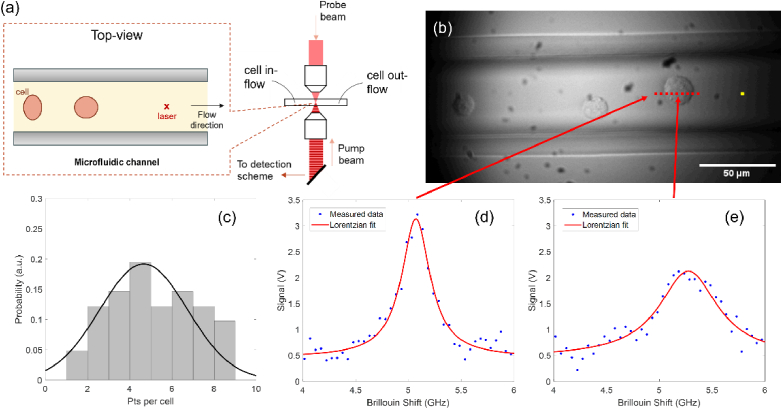
(a) Simplified schematic of the experimental setup used in this work. The inset sketch shows a magnified top-view of the microfluidic channel. (b) Widefield image of cells flowing through the microfluidic channel. Yellow dot represents the laser interaction region with red dots representing example sampling points. (c) Distribution of the number of sampled points per cell over a typical experiment. Experimentally attained Brillouin spectra of (d) medium and (e) the cell at experimental conditions.
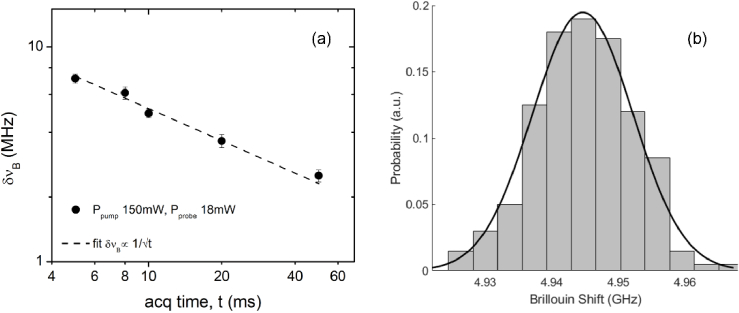
Experimental data of water to demonstrate system performance. (a) Shift precision (
) for 100 spectra of water in the 50μm × 50μm straight microfluidic channel with typical measurement conditions while varying acquisition time. Pump and probe average powers were held constant at 150 mW and 18 mW respectively. Dashed line represents linear fit of the data. Error bars are the standard deviation over the 100 acquisitions. (b) Distribution of the 100 Brillouin shifts fit with a Gaussian.
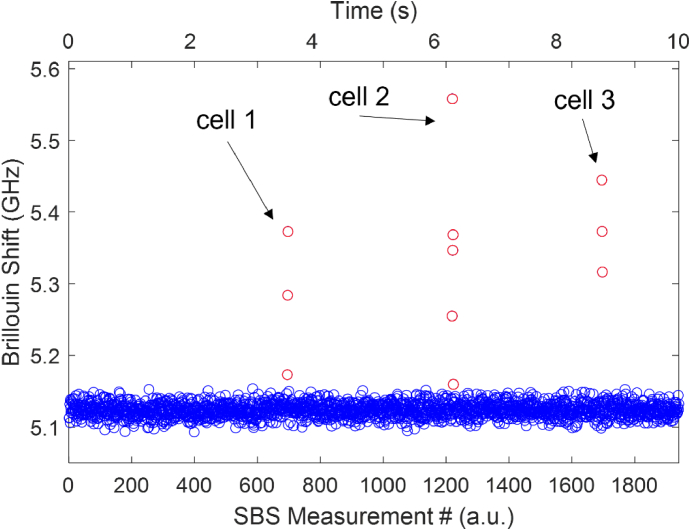
Demonstration of individual measurement segment. Segment of continuously acquired Brillouin shift data as 3 cells flow across the Brillouin interaction region. Total time of measurement segment is ∼10s. Circles represent individual 5 ms spectral measurements where blue circles are measurements of medium and red circles are measurements of the cells. Arrows indicate different cells.
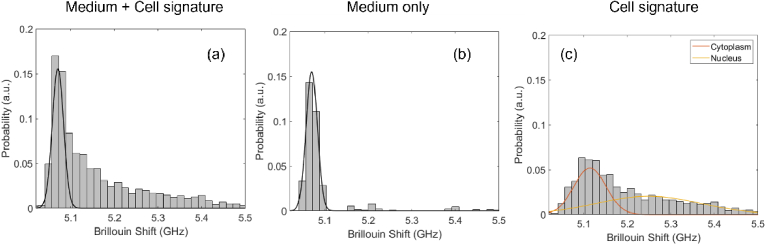
Histograms represent flow experiment data post-processing. (a) Experimental data with Brillouin shift signatures from both the medium and the cells. (b) Experimental data of Brillouin shift of only the medium. Black line represents Gaussian fit to be subtracted from overall measurement. (c) Extracted cell signature with medium removed. Orange and yellow lines are each Gaussian fits of the cytoplasm and nucleus respectively.
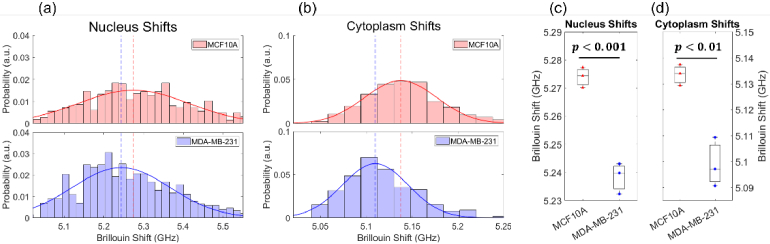
Brillouin cell signature results. Representative experiments of MCF10A (top, 280 cells) and MDA-MB-231 (bottom, 311 cells) separated into (a) nucleus signatures and (b) cytoplasm signatures. The red lines depict the Gaussian fits of the MCF10A distributions, and the blue lines show the Gaussian fits of the MDA-MB-231 distributions. The dashed lines in each plot show the central peak location of each fit. (c) and (d) show the Brillouin shift population central peak location for the nucleus and cytoplasm respectively. Three separate experiment runs for both cell lines were conducted. Statistical significance between the two cell lines was analyzed using a two-sample t-test.
References
Associated data
Grants and funding
LinkOut - more resources
Full Text Sources