. 2025 Mar;21(10):e2406094.
doi: 10.1002/smll.202406094. Epub 2024 Oct 18.

Harnessing Lactobacillus reuteri-Derived Extracellular Vesicles for Multifaceted Cancer Treatment

Affiliations

Harnessing Lactobacillus reuteri-Derived Extracellular Vesicles for Multifaceted Cancer Treatment

Soyeon Yi et al. Small. 2025 Mar.

Abstract

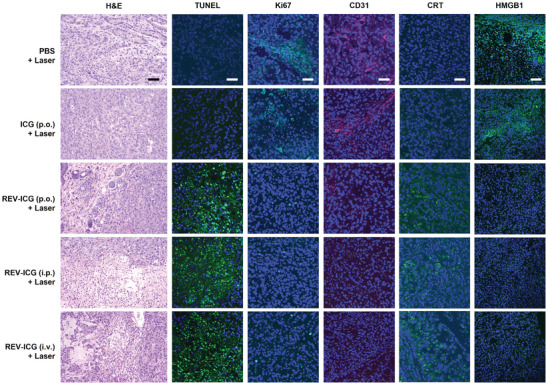
Extracellular vesicles (EVs) have emerged as valuable biological materials for treating intractable diseases. Extensive studies are conducted on EVs derived from various cellular sources. In this study, EVs derived from Lactobacillus reuteri (L. reuteri), a probiotic, exhibit remarkable cancer therapeutic efficacy when administered orally is reported. These L. reuteri-derived EVs (REVs) demonstrate stability in the gastrointestinal tract and exert significant anti-tumor effects. Using A549 cells and murine models, we confirmed that REVs mediate their therapeutic effects by modulating apoptotic signaling pathways. Furthermore, the combination of REV with drugs enhances tumor ablation and induces immunogenic cell death. In a mouse model, oral administration of REVs encapsulating indocyanine green followed by photothermal therapy led to complete tumor elimination within 32 days. REVs represent a promising biological therapeutic platform for cancer treatment, either independently or in combination with other therapies, depending on the treatment objectives.

Keywords: drug delivery platforms; extracellular vesicles; oral administration; photothermal therapy; probiotics.


Conflict of interest statement

The authors declare no conflict of interest.

Figures

Figure 1
Figure 1
Preparation and Characterization of REVs. a) Schematic illustration depicting the isolation and purification process of REVs. b) Transmission electron microscopy (TEM) image displaying the morphology of REVs, with a scale bar representing 100 nm. c) Graph showing the size distribution of REVs, with an inset box detailing the average diameter, polydispersity index, and surface charge. d) Stability assessment of REVs across different pH values. Data are presented as mean ± standard deviation (n = 3).
Figure 2
Figure 2
In Vitro Cytotoxicity of REVs. a) Visualization of cellular uptake of REVs, confirming internalization. b) Dose‐dependent cytotoxicity of REVs showing significant cell death. Data are presented as mean ± standard deviation (n = 5) and statistical significance is assessed using one‐way ANOVA with a post hoc Tukey's HSD test (***p < 0.001). c) Flow cytometry analysis illustrating increased apoptosis induced by REVs. Data are presented as mean ± standard deviation (= 5) and statistical significance (***< 0.001). d) Analysis of cell cycle arrest effects of REVs, indicating phase‐specific impacts. Data are presented as mean ± standard deviation (n = 5). e) Western blot analysis depicting the activation of apoptosis‐related proteins by REVs in A549 cells. f) Invasion assay demonstrating the inhibitory effect of REVs on cancer cell invasiveness. Data are presented as mean ± standard deviation (= 5) and statistical significance (*p < 0.05 and ***p < 0.001). g) Transwell migration assay highlighting reduced cell migration due to REV treatment. Data are presented as mean ± standard deviation (= 5) and statistical significance (**p < 0.01 and ***p < 0.001). h) Wound closure assay showing decreased migration rates in REV‐treated cells. Data are presented as mean ± standard deviation (= 5) and statistical significance (**p < 0.01 and ***p < 0.001).
Figure 3
Figure 3
In Vivo Antitumor Activity of REVs. a) Timeline of the experimental treatment protocol with REVs. b) Tumor growth curves illustrating the effect of REVs on tumor progression in mice, with each point representing the average tumor volume over time. Data are presented as mean ± standard deviation (n = 5) and statistical significance is assessed using Student's t‐test (***< 0.001). c) Weights of tumors excised from mice on day 32, showing the efficacy of REVs in tumor reduction. Data are presented as mean ± standard deviation (n = 5) and statistical significance (***p < 0.001). d) Body weight of mice during the treatment period. Data are presented as mean ± standard deviation (n = 5) and statistical significance is assessed using Student's t‐test (***p < 0.001). e) Mice survival over 90 d. Data are presented as mean ± standard deviation (n = 5) and statistical significance is assessed using the log‐rank (Mantel‐Cox) test (*< 0.05). f) Histological analysis of tumors treated with REVs, harvested on day 32 and stained with H&E and TUNEL for apoptosis, and Ki67 and CD31 for cell proliferation and angiogenesis. Scale bars represent 200 µm for H&E and 50 µm for fluorescence images.
Figure 4
Figure 4
Preparation and Characterization of REV‐ICG. a) Schematic illustration showing the preparation process of REV‐ICG. b) Graph showing the size distribution of REV‐ICG, with an inset box detailing the average diameter, polydispersity index, and surface charge. c) TEM image displaying the morphology of REV‐ICG, with a scale bar representing 100 nm. d) UV–Vis absorbance spectra comparing REV‐ICG, free ICG, and REV. The inset shows REV‐ICG dispersed in PBS. e) Temperature change profiles under a NIR laser irradiation (1 W cm 2) over 10 min. Data are presented as mean ± standard deviation (n = 3). f) Temperature changes of REV‐ICG, free ICG, and REV during three cycles of laser on/off (1 W cm 2), with red arrows indicating laser on and black arrows indicating laser off.
Figure 5
Figure 5
Enhanced Cytotoxicity of REV‐ICG. a) Cytotoxicity of ICG and REV‐ICG (20 µg mL−1) before and after NIR laser irradiation (1 W cm 2) for 5 min. Data are presented as mean ± standard deviation (n = 5) and statistical significance is assessed using one‐way ANOVA with a post hoc Tukey's HSD test (***p < 0.001). b) Live and dead cell staining results of ICG and REV‐ICG (20 µg mL−1) treatment before and after NIR laser irradiation (1 W cm 2) for 5 min. Scale bars represent 100 µm. c) Detection of reactive oxygen species (ROS) generation in treated cells, illustrating increased ROS production under an NIR irradiation. d) Analysis of cellular apoptosis via Annexin V‐FITC and PI staining, illustrating increased apoptotic activity following REV‐ICG treatment and NIR exposure.
Figure 6
Figure 6
Tumor Targeting and Photothermal Activities of REV‐ICG. a) In vivo fluorescence imaging showing the distribution of free ICG and REV‐ICG (equivalent to 5 mg kg−1) in mice after p.o., i.p., and i.v. administrations. b) Ex vivo biodistribution of free ICG and REV‐ICG in harvested tissues 1 day post‐administration, illustrating enhanced targeting by REV‐ICG. c) Plasma concentration‐time curves and pharmacokinetic parameters following p.o., i.p., and i.v. Administrations of REV‐ICG. Data are presented as mean ± standard deviation (= 5). d) Thermal images of A549‐bearing mice during NIR laser irradiation (1 W cm 2), demonstrating the photothermal response. e) Temperature change profiles of tumors over 5 min under a NIR irradiation. Data are presented as mean ± standard deviation (n = 5) and statistical significance (***p < 0.001).
Figure 7
Figure 7
Anti‐Tumor Activity of REV‐ICG Combined with PTT. a) Timelines of experimental treatment and NIR irradiation (1 W cm 2, 5 min). b) Tumor growth curves of mice from different treatment routes, highlighting the therapeutic efficacy of REV‐ICG. Data are presented as mean ± standard deviation (n = 5) and statistical significance is assessed using one‐way ANOVA with a post hoc Tukey's HSD test (***p < 0.001). c) Photographs of tumors dissected from mice on day 32, with the red crossed box indicating an invisible tumor. d) Weights of tumors excised from mice on day 32, showing a significant reduction in tumor mass. Data are presented as mean ± standard deviation (n = 5) and statistical significance (***< 0.001). e) Body weight of mice during the treatment period. Data are presented as mean ± standard deviation (n = 5) and statistical significance (***p < 0.001). f) Mice survival over 90 d. Data are presented as mean ± standard deviation (n = 5) and statistical significance is assessed using the log‐rank (Mantel‐Cox) test (*< 0.05).
Figure 8
Figure 8
Histological Evaluation of Tumors Treated with REV‐ICG and PTT. Tumors were harvested on day 32 and subjected to various stains to assess cellular and structural changes. H&E staining was used for general tissue architecture, while TUNEL, Ki67, CD31, CRT, and HMGB1 staining were employed to evaluate apoptosis, proliferation, angiogenesis, and immunogenic cell death, respectively. Scale bars represent 200 µm for H&E and 50 µm for fluorescence images.
Figure 9
Figure 9
Biocompatibility of REV‐ICG. Tumors and major organs (liver, heart, lung, spleen, and kidney) stained with H&E. Scale bars represent 200 µm.

References

    1. Zheng D., Ruan H., Chen W., Zhang Y., Cui W., Chen H., Shen H., Bioact. Mater. 2023, 25, 500. - PMC - PubMed
    1. a) Kolonics F., Szeifert V., Timar C. I., Ligeti E., Lorincz A. M., Cells 2020, 9; - PMC - PubMed
    2. b) Hallal S., Tuzesi A., Grau G. E., Buckland M. E., Alexander K. L., J. Extracell. Vesicles 2022, 11, e12260; - PMC - PubMed
    3. c) Ghadami S., Dellinger K., Front. Mol. Biosci. 2023, 10, 1198044. - PMC - PubMed
    1. a) Zaborowski M. P., Balaj L., Breakefield X. O., Lai C. P., Bioscience 2015, 65, 783; - PMC - PubMed
    2. b) Gurung S., Perocheau D., Touramanidou L., Baruteau J., Cell Commun. Signal 2021, 19, 47; - PMC - PubMed
    3. c) Hao Y., Song H., Zhou Z., Chen X., Li H., Zhang Y., Wang J., Ren X., Wang X., J. Control Rel. 2021, 340, 136; - PubMed
    4. d) Chen C., Zheng H., Luo Y., Kong Y., An M., Li Y., He W., Gao B., Zhao Y., Huang H., Huang J., Lin T., J. Clin. Invest. 2021, 131. - PMC - PubMed
    1. a) Buzas E. I., Nat. Rev. Immunol. 2023, 23, 236; - PMC - PubMed
    2. b) Zhi Z., Sun Q., Tang W., Front. Mol. Biosci. 2022, 9, 1036746. - PMC - PubMed
    1. a) Jong A. Y., Wu C. H., Li J., Sun J., Fabbri M., Wayne A. S., Seeger R. C., J. Extracell Vesicles 2017, 6, 1294368; - PMC - PubMed
    2. b) Zhu L., Gangadaran P., Kalimuthu S., Oh J. M., Baek S. H., Jeong S. Y., Lee S. W., Lee J., Ahn B. C., Artif. Cells Nanomed. Biotechnol. 2018, 46, 166; - PubMed
    3. c) Di Pace A. L., Tumino N., Besi F., Alicata C., Conti L. A., Munari E., Maggi E., Vacca P., Moretta L., Cancers 2020, 12; - PMC - PubMed
    4. d) Choi J. W., Lim S., Kang J. H., Hwang S. H., Hwang K. C., Kim S. W., Lee S., Molecules 2020, 25; - PMC - PubMed
    5. e) Zhu L., Kalimuthu S., Gangadaran P., Oh J. M., Lee H. W., Baek S. H., Jeong S. Y., Lee S. W., Lee J., Ahn B. C., Theranostics 2017, 7, 2732. - PMC - PubMed

Publication types

LinkOut - more resources