. 2024 Oct 15;45(15):e70043.
doi: 10.1002/hbm.70043.

Evaluating Models of the Ageing BOLD Response

Collaborators, Affiliations

Evaluating Models of the Ageing BOLD Response

R N Henson et al. Hum Brain Mapp. .

Abstract

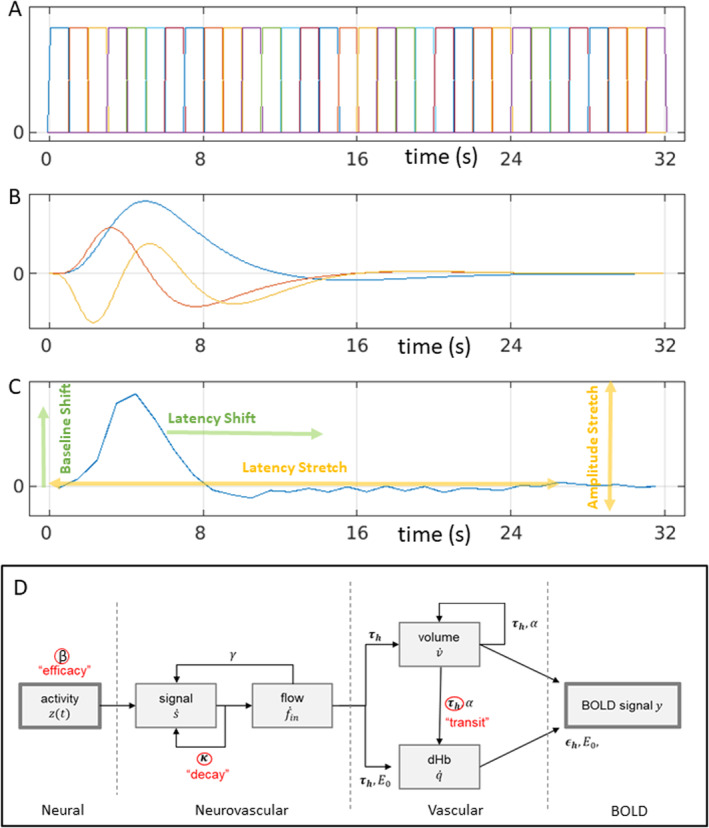
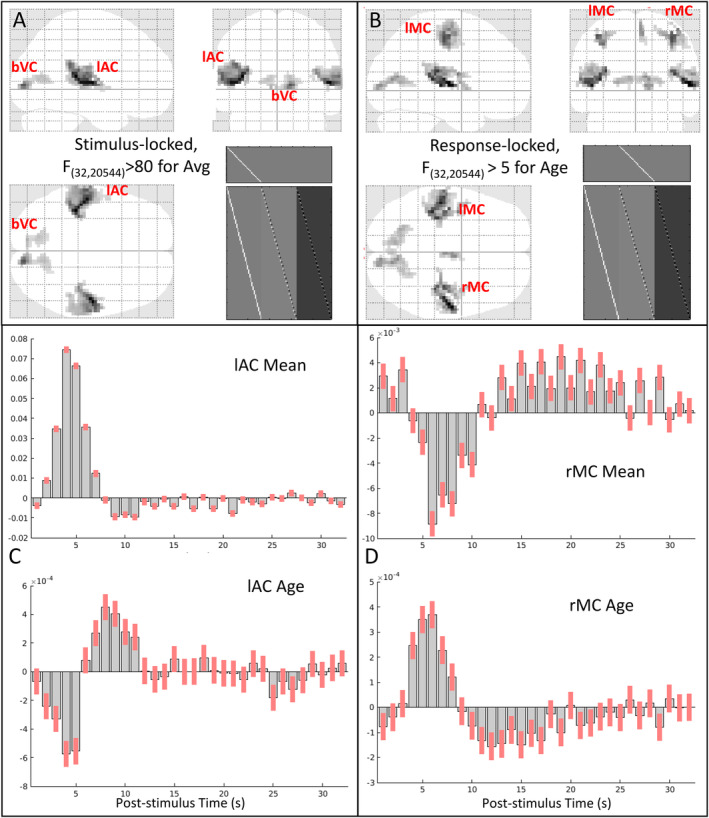
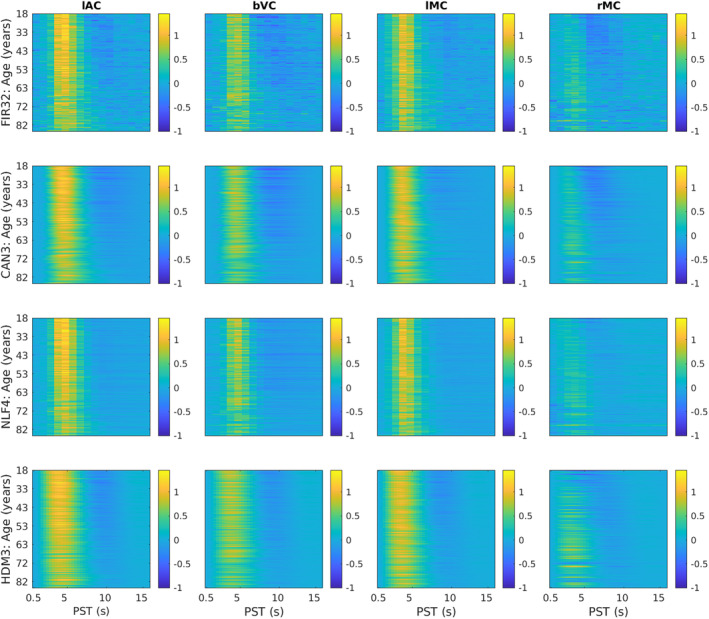
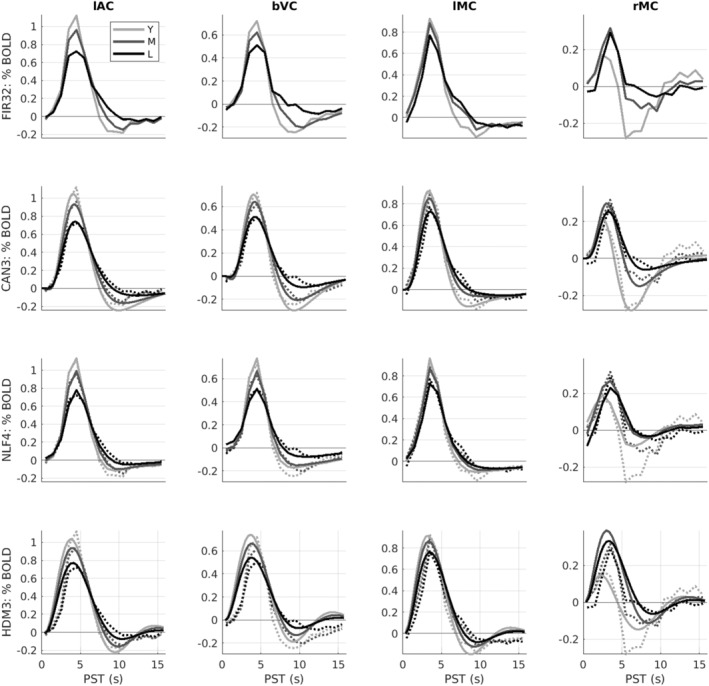
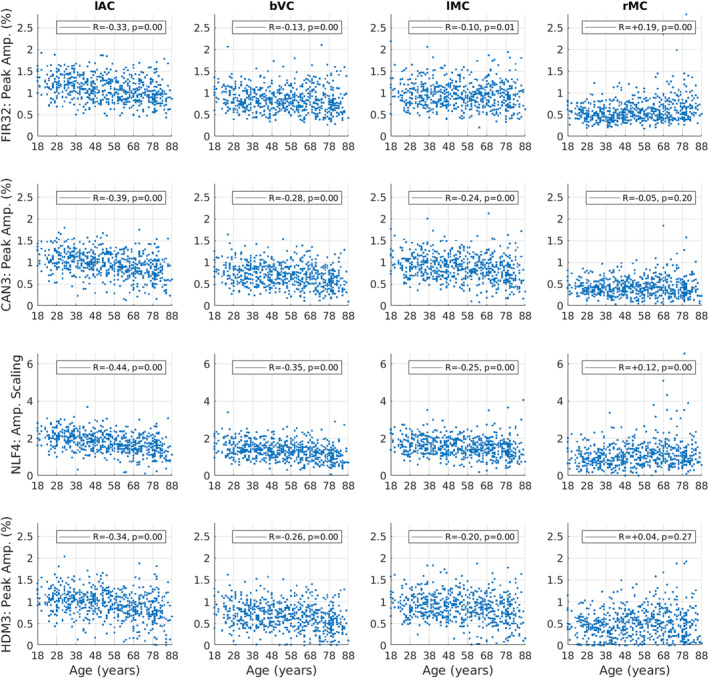
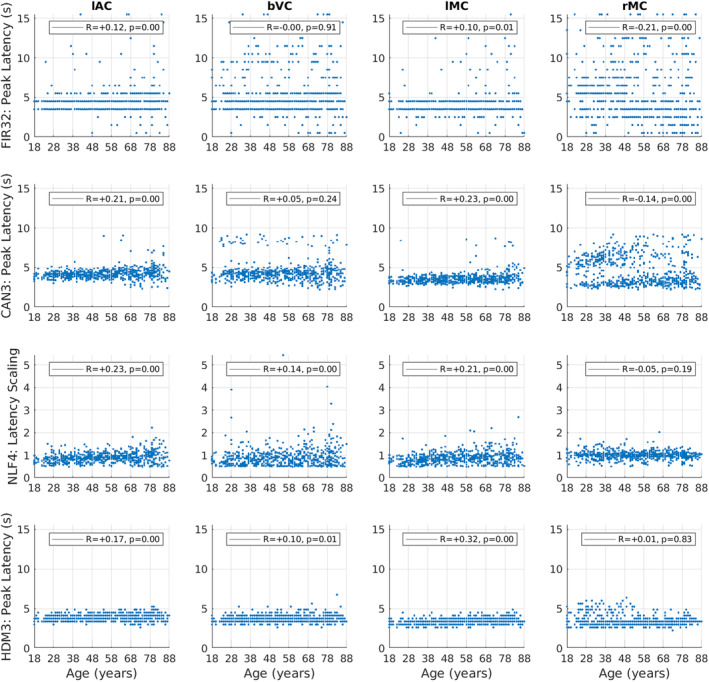
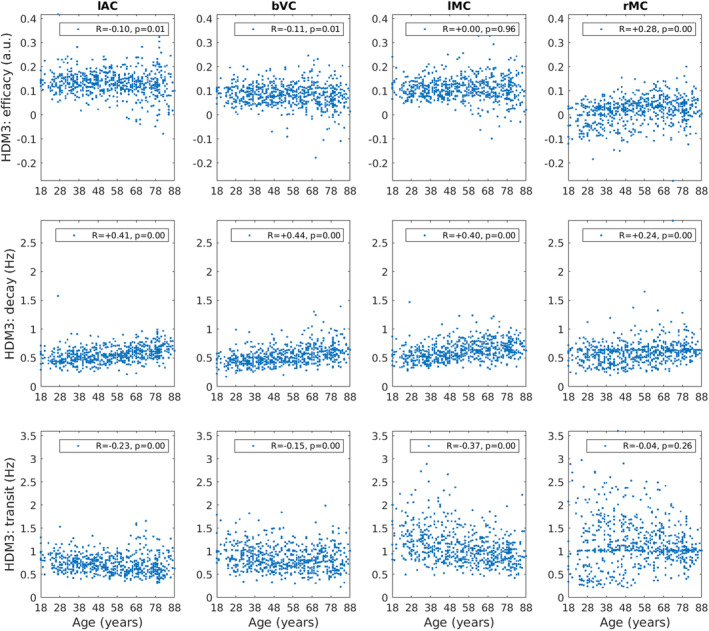
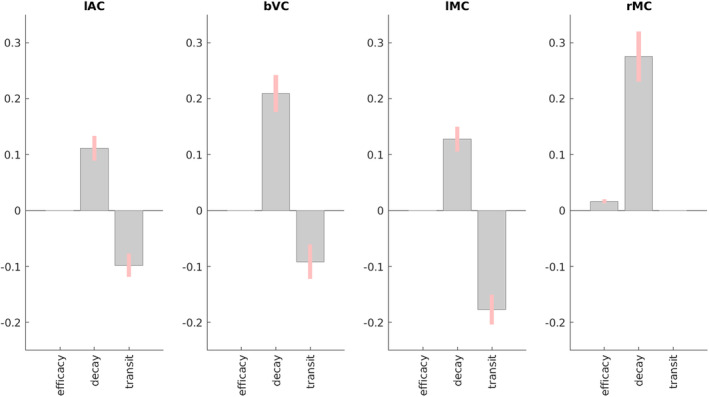
Neural activity cannot be directly observed using fMRI; rather it must be inferred from the hemodynamic responses that neural activity causes. Solving this inverse problem is made possible through the use of forward models, which generate predicted hemodynamic responses given hypothesised underlying neural activity. Commonly-used hemodynamic models were developed to explain data from healthy young participants; however, studies of ageing and dementia are increasingly shifting the focus toward elderly populations. We evaluated the validity of a range of hemodynamic models across the healthy adult lifespan: from basis sets for the linear convolution models commonly used to analyse fMRI studies, to more advanced models including nonlinear fitting of a parameterised hemodynamic response function (HRF) and nonlinear fitting of a biophysical generative model (hemodynamic modelling, HDM). Using an exceptionally large sample of participants, and a sensorimotor task optimized for detecting the shape of the BOLD response to brief stimulation, we first characterised the effects of age on descriptive features of the response (e.g., peak amplitude and latency). We then compared these to features from more complex nonlinear models, fit to four regions of interest engaged by the task, namely left auditory cortex, bilateral visual cortex, left (contralateral) motor cortex and right (ipsilateral) motor cortex. Finally, we validated the extent to which parameter estimates from these models have predictive validity, in terms of how well they predict age in cross-validated multiple regression. We conclude that age-related differences in the BOLD response can be captured effectively by models with three free parameters. Furthermore, we show that biophysical models like the HDM have predictive validity comparable to more common models, while additionally providing insights into underlying mechanisms, which go beyond descriptive features like peak amplitude or latency, and include estimation of nonlinear effects. Here, the HDM revealed that most of the effects of age on the BOLD response could be explained by an increased rate of vasoactive signal decay and decreased transit rate of blood, rather than changes in neural activity per se. However, in the absence of other types of neural/hemodynamic data, unique interpretation of HDM parameters is difficult from fMRI data alone, and some brain regions in some tasks (e.g., ipsilateral motor cortex) can show responses that are more difficult to capture using current models.


Conflict of interest statement

The authors declare no conflicts of interest.

Figures

FIGURE 1
FIGURE 1
HRF models: (A) linear Finite Impulse Response basis set with 32 × 1 s bins (FIR32); (B) an “informed” linear basis set with a canonical HRF (blue), its temporal derivative (red) and dispersion derivative (yellow) (Can3); (C) nonlinear fitting of average empirical HRF for a given ROI (here lAC) using amplitude and latency offsets and scalings (NLF4); (D) nonlinear hemodynamic modelling using differential equations with three free parameters (in red) (HDM3).
FIGURE 2
FIGURE 2
Panels A and B show maximal intensity projections (MIPs) of statistical parametric maps (SPMs) of F‐contrast for (A) the mean effect across participants, locked to audio‐visual stimulation (thresholded for 50 contiguous voxels with F > 80), and (B) the (linear) effect of age, locked to the right finger press (thresholded for 50 contiguous voxels with F > 5). The clusters corresponding to the four functional ROIs analysed below (lAC, bVC, lMC and rMC) are labelled on the sagittal, coronal and transverse sections, along with the F‐contrast and the design matrix (bottom right). Panels C and D show the mean of each FIR parameter, that is, fMRI signal change (arbitrary units) relative to inter‐stimulus interval (upper plot) and effect of age on each parameter, that is, when in time the fMRI signal increases or decreases with age (lower plot) for the peak voxel from the (C) lAC ROI [− 39 – 33 + 12] and (D) rMC ROI [+ 36 – 21 + 51]. Note that the scale of the y‐axis is in arbitrary units and differs across plots; for % signal change, see Figure 4. Red bars show 90% confidence interval.
FIGURE 3
FIGURE 3
HRFs shown as heatmaps for each ROI (columns) and model (rows). The y‐axis represents each participant, sorted by age, while the x‐axis represents post‐stimulus time (PST), truncated at 16 s for easier visualisation. The fits were smoothed across participants with a 5‐participant running average. lAC = left auditory cortex, bVC = bilateral visual cortex, lMC = left (contralateral) motor cortex, rMC = right (ipsilateral) motor cortex. The lAC and bVC data are from the stimulus‐locked model; lMC and rMC are from the response‐locked model—all chosen from FIR analysis to show strong effects of age (see Figure 2).
FIGURE 4
FIGURE 4
Average HRFs within age tertiles (18–44, 44–66, and 66–88 years) for each ROI (columns) and model (rows). Y = young; M = mid‐life; L = late‐life. The dotted lines in rows 2–4 are the (replotted) FIR estimates (i.e., same as top row) for reference. Note y‐axis scale different across ROIs but matched across models. See Figure 3 legend for more details.
FIGURE 5
FIGURE 5
Amplitude estimates for each ROI (columns) and model (rows), plotted for each participant as a function of age. Amplitude is defined as the maximum absolute value of the fit within the first 16 s, except for the NLF4 model, where the amplitude scaling parameter is plotted instead (since it is designed to capture amplitude without defining a peak). The R and p‐value for Spearman rank correlations with age are shown in legend. See Figure 3 legend for more details.
FIGURE 6
FIGURE 6
Latency estimates for each ROI (columns) and model (rows), plotted for each participant as a function of age. Latency is determined by the time of the maximum absolute value of the fit (peak) within the first 16 s, except for the NLF4 model, where the absolute value of the latency scaling parameter is plotted instead (since it is designed to capture latency without defining a peak). See Figure 5 legend for more details.
FIGURE 7
FIGURE 7
HDM3 parameters (rows) for each ROI (column) plotted for each participant as a function of age. The R and p‐value for Spearman rank correlations with age are shown. Parameter estimates for decay and transit rates are after transforming the posterior expected values from their log‐values back into original units of Hz (see Supporting Information).
FIGURE 8
FIGURE 8
Results of PEB BMR on HDM parameters for each ROI for the linear effect of age across participants. Grey bars show posterior expectation with 90% credible interval in pink; missing bars are parameters that BMR has removed as unnecessary (in terms of maximising evidence for PEB model). For decay and transit parameters, units are log deviations.
FIGURE 9
FIGURE 9
Results of cross‐validated prediction of age for each model, using all parameters across all ROIs. Top panel shows the Pearson correlation between actual and predicted age. Bottom panel shows boxplots of absolute error, where each grey line corresponds to one participant. An asterisk means that a two‐tailed sign‐test revealed significantly different error than from the FIR32 model. The average across ROIs of the median error was 9.98 years (FIR32), 9.20 years (Can3), 11.90 years (NLF4) and 10.33 years (HDM3), respectively.

References

    1. Abdelkarim, D. , Zhao Y., Turner M. P., Sivakolundu D. K., Lu H., and Rypma B.. 2019. “A Neural‐Vascular Complex of Age‐Related Changes in the Human Brain: Anatomy, Physiology, and Implications for Neurocognitive Aging.” Neuroscience and Biobehavioral Reviews 107, no. December 2018: 927–944. 10.1016/j.neubiorev.2019.09.005. - DOI - PubMed
    1. Aizenstein, H. J. , Clark K. A., Butters M. A., et al. 2004. “The BOLD Hemodynamic Response in Healthy Aging.” Journal of Cognitive Neuroscience 16, no. 5: 786–793. 10.1162/089892904970681. - DOI - PubMed
    1. Birn, R. M. , Saad Z. S., and Bandettini P. A.. 2001. “Spatial Heterogeneity of the Nonlinear Dynamics in the FMRI BOLD Response.” NeuroImage 14, no. 4: 817–826. 10.1006/nimg.2001.0873. - DOI - PubMed
    1. Buračas, G. T. , and Boynton G. M.. 2002. “Efficient Design of Event‐Related fMRI Experiments Using m‐Sequences.” NeuroImage 16, no. 3 I: 801–813. 10.1006/nimg.2002.1116. - DOI - PubMed
    1. Buxton, R. B. , Wong E. C., and Frank L. R.. 1998. “Dynamics of Blood Flow and Oxygenation Changes During Brain Activation: The Balloon Model.” Magnetic Resonance in Medicine 39, no. 6: 855–864. 10.1002/mrm.1910390602. - DOI - PubMed