. 2024 Oct 18:13:RP96459.
doi: 10.7554/eLife.96459.

Transcriptomic profiling of Schlemm's canal cells reveals a lymphatic-biased identity and three major cell states

Affiliations

Transcriptomic profiling of Schlemm's canal cells reveals a lymphatic-biased identity and three major cell states

Revathi Balasubramanian et al. Elife. .

Abstract

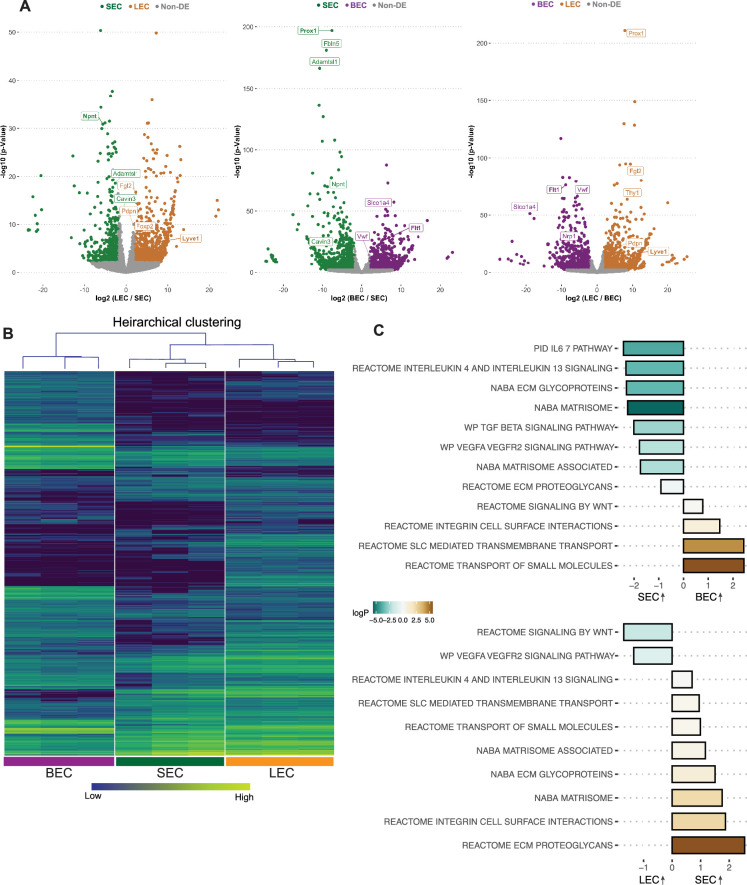
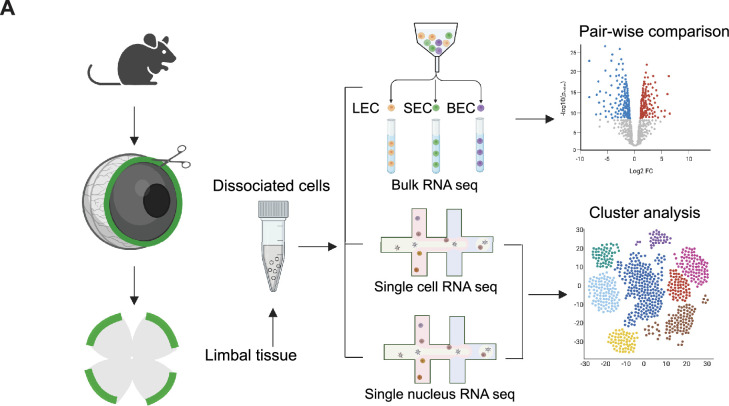
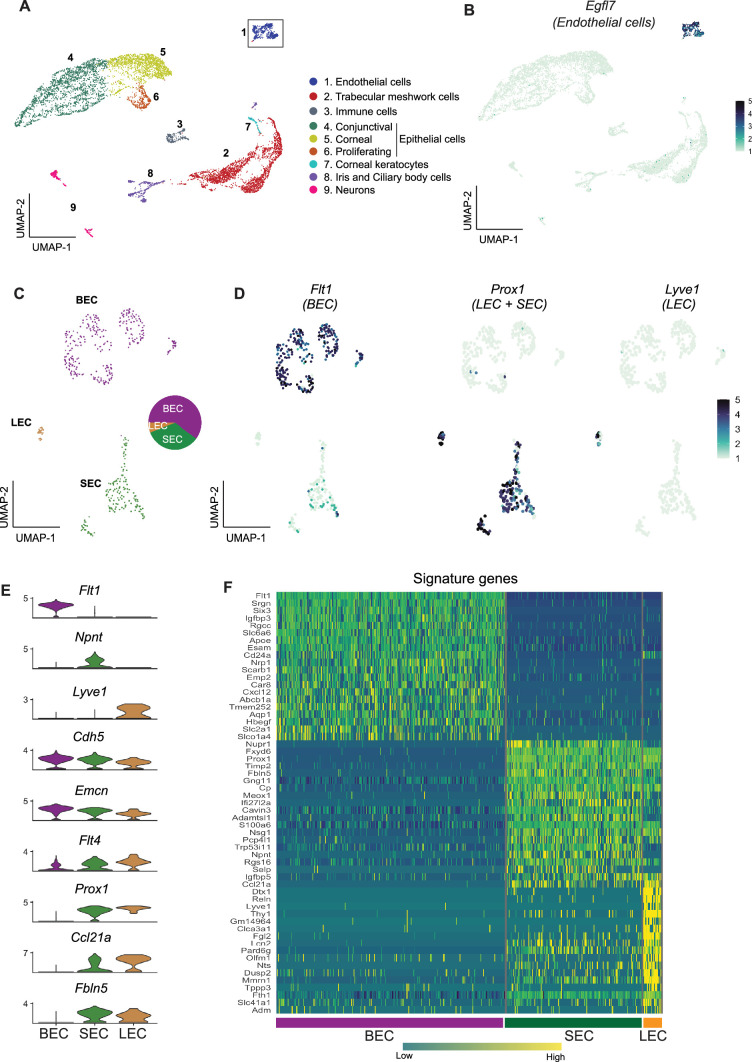
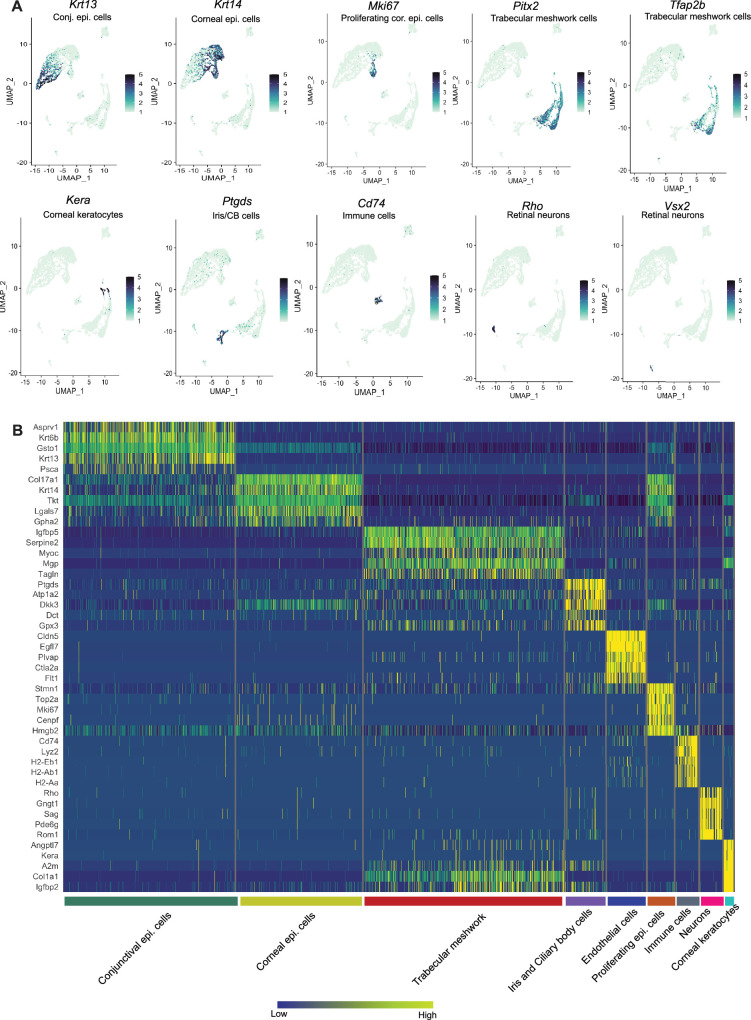
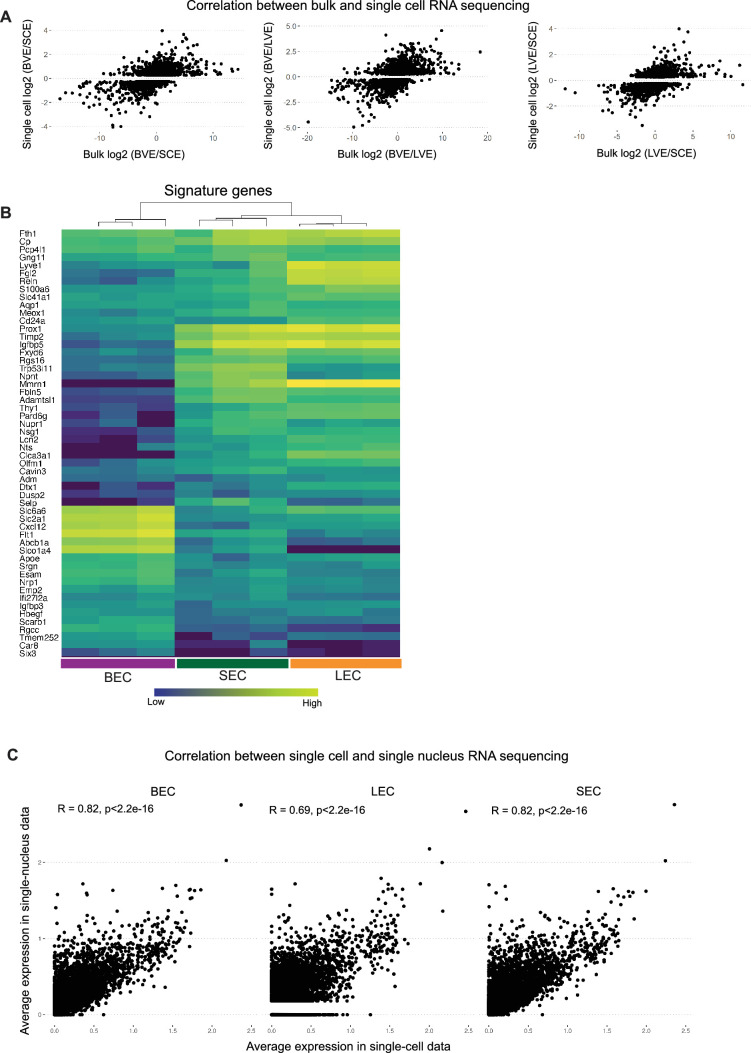
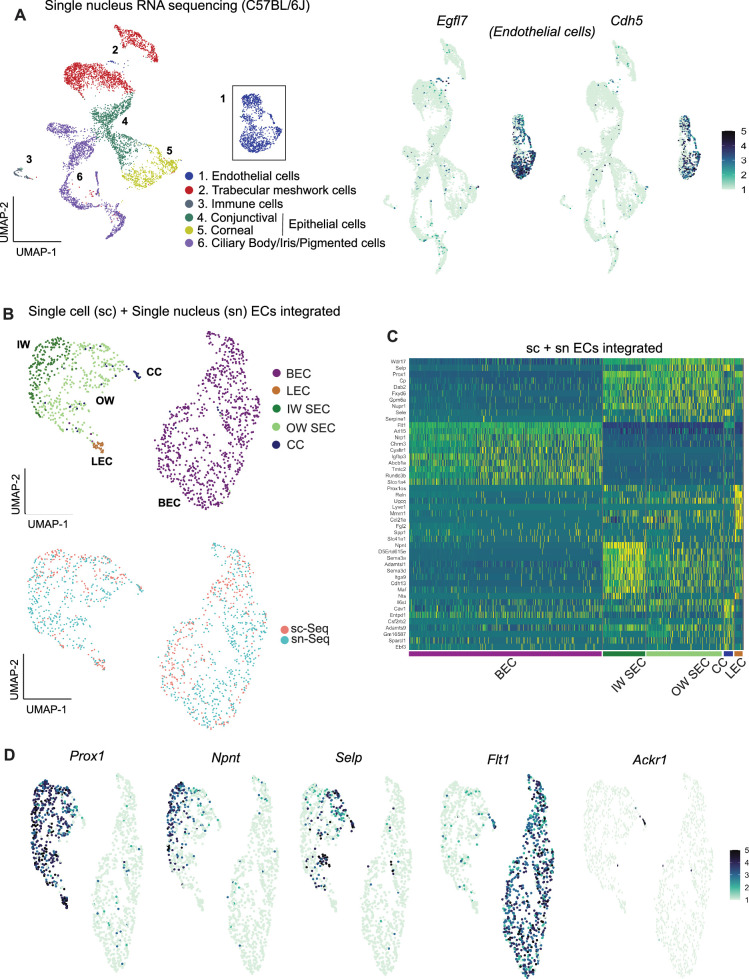
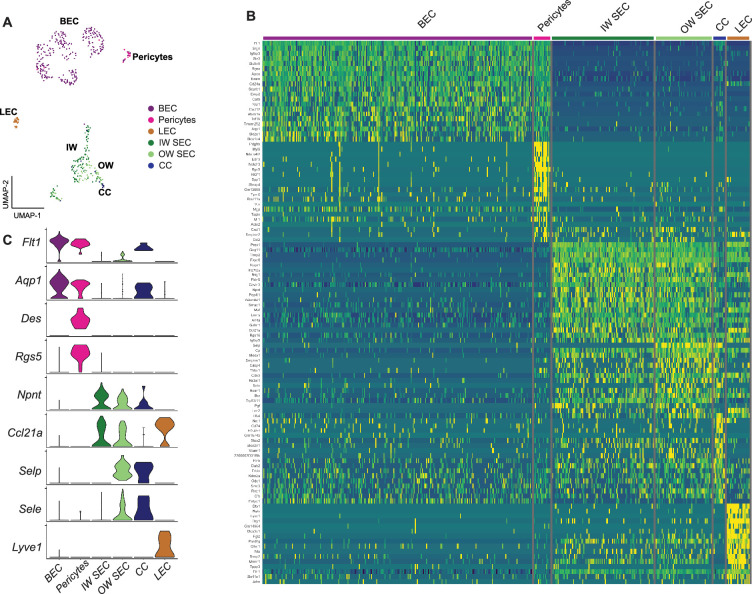
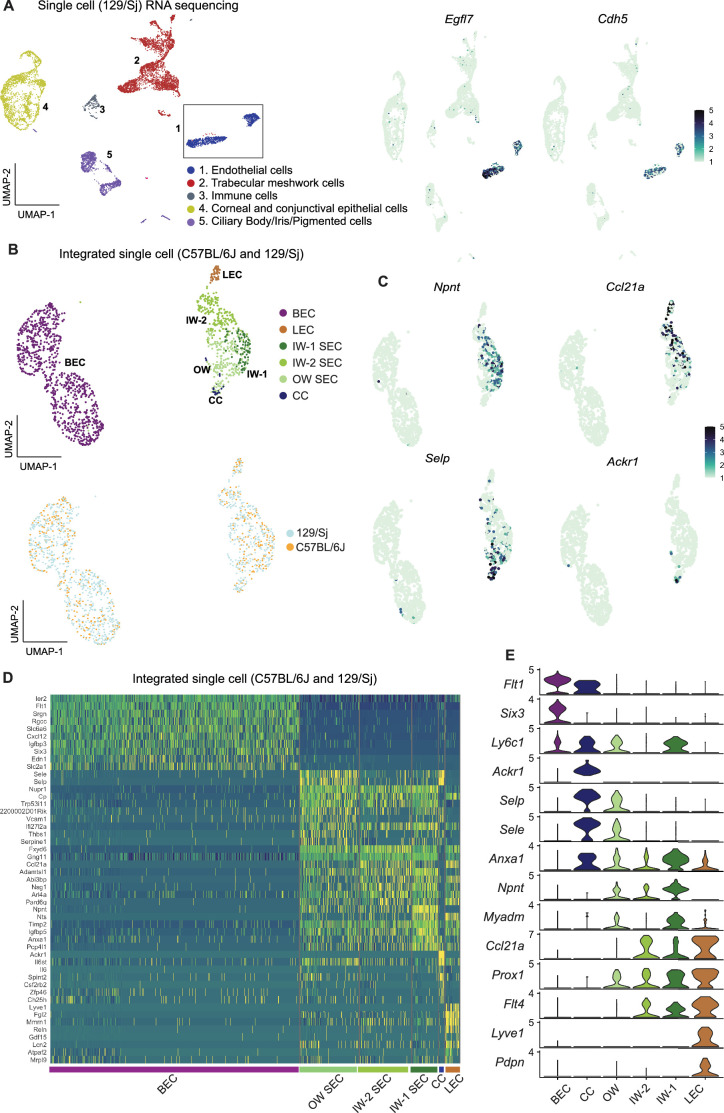
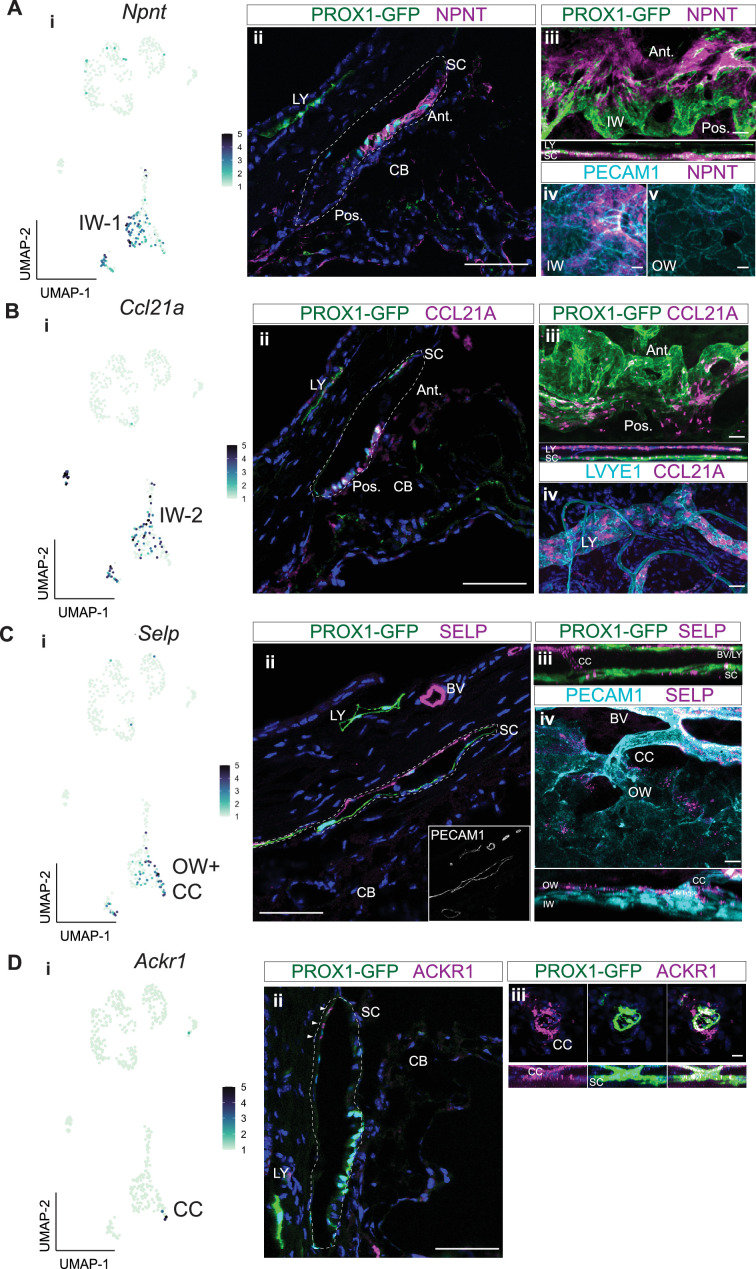
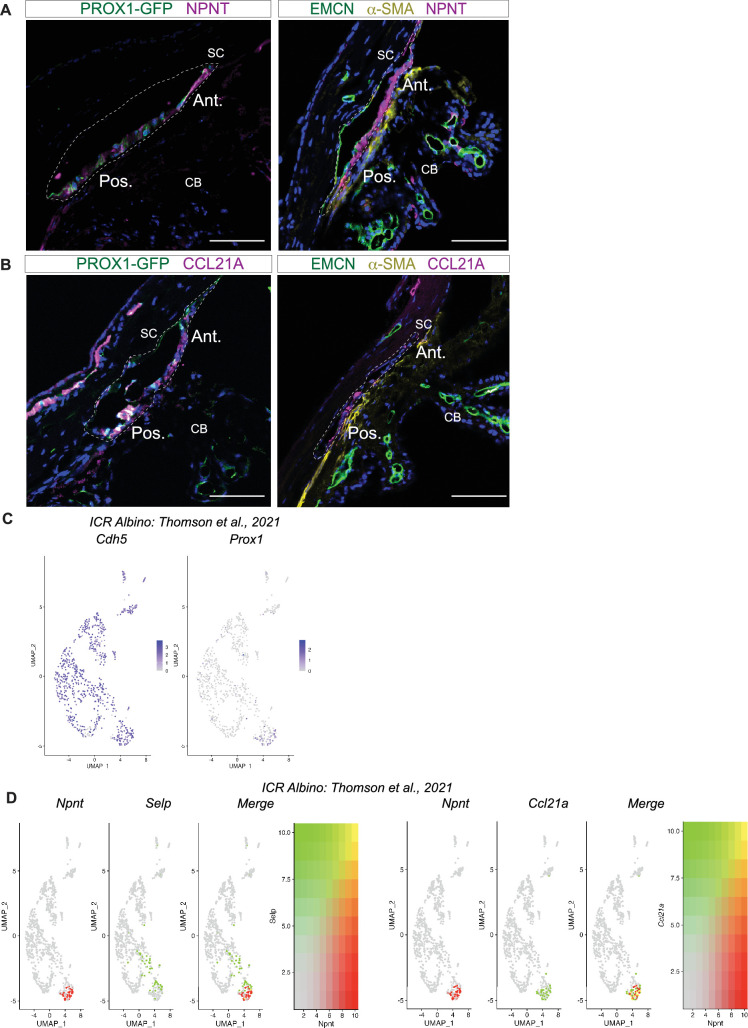
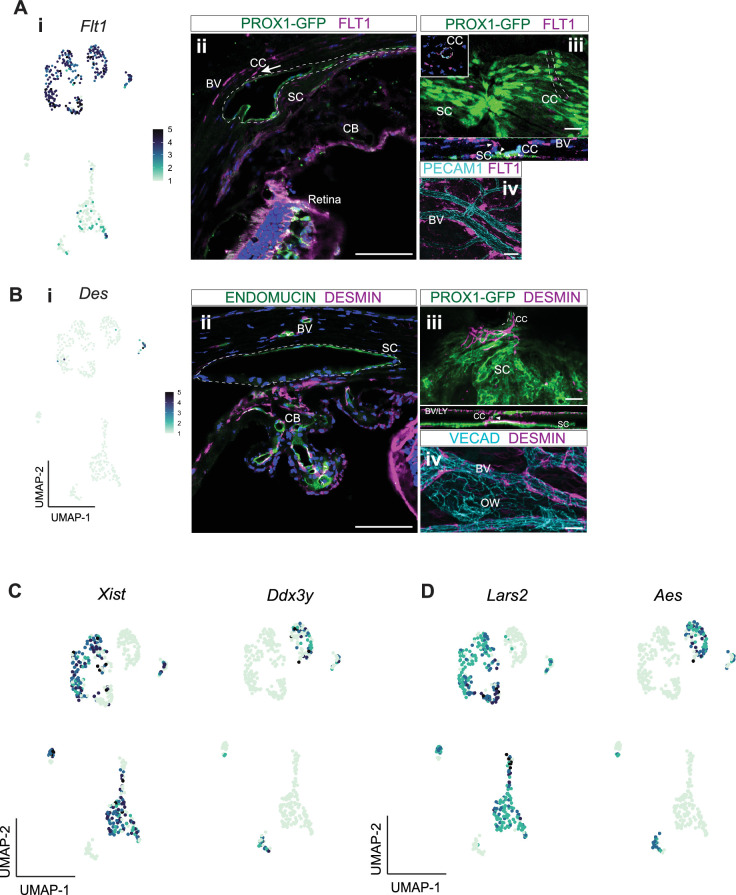
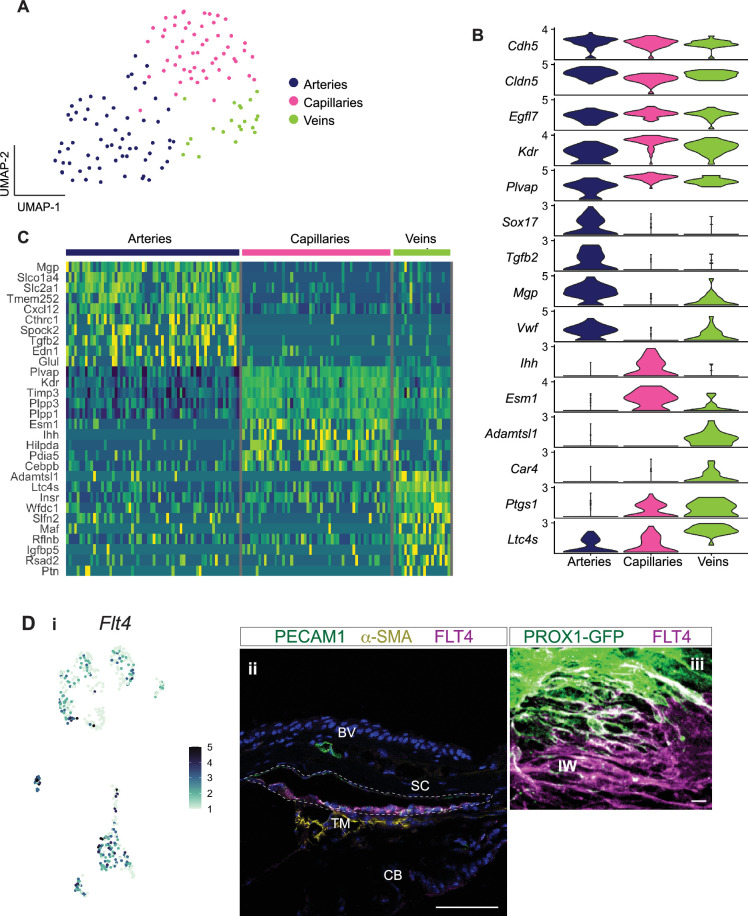
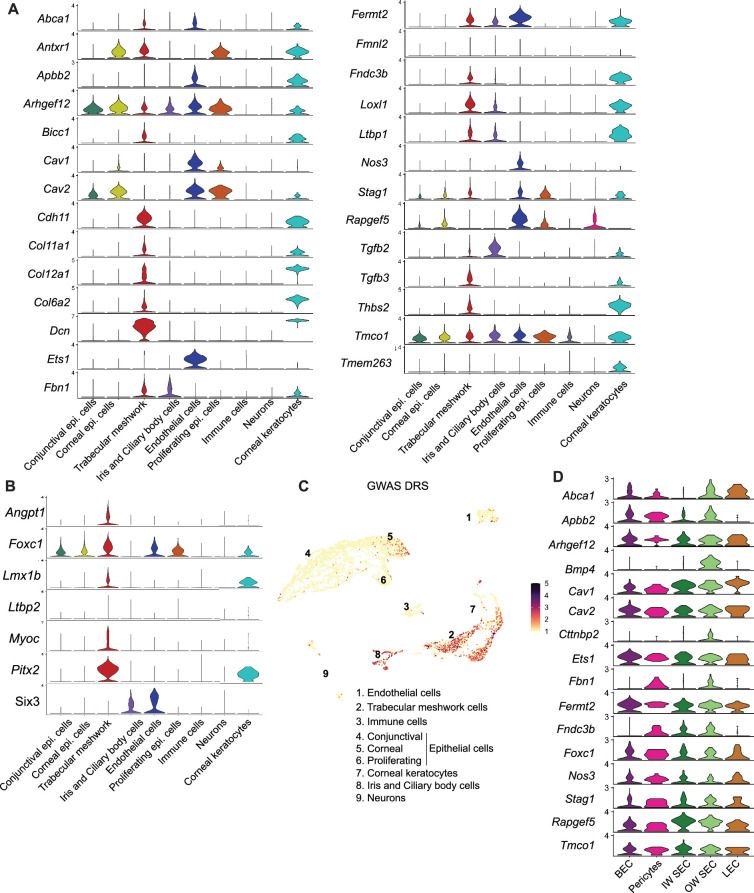
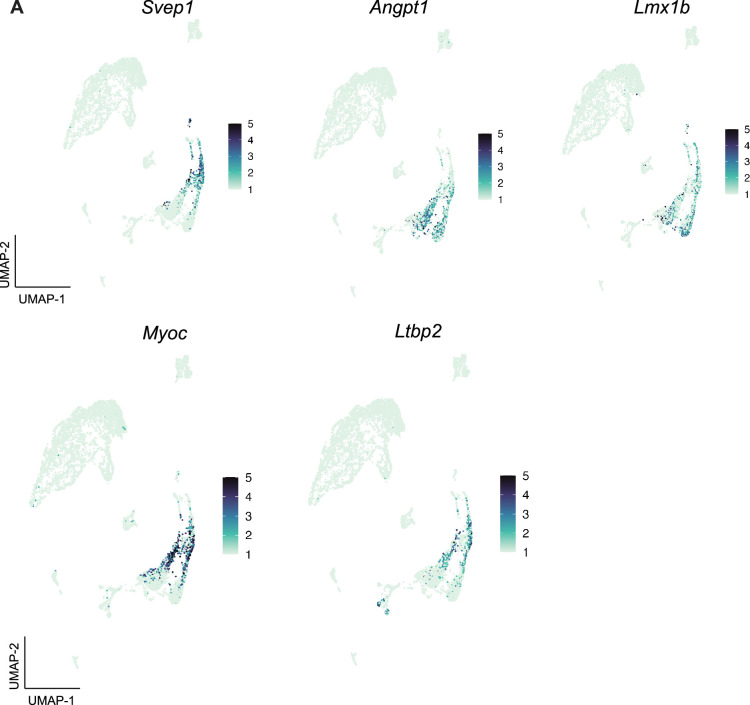
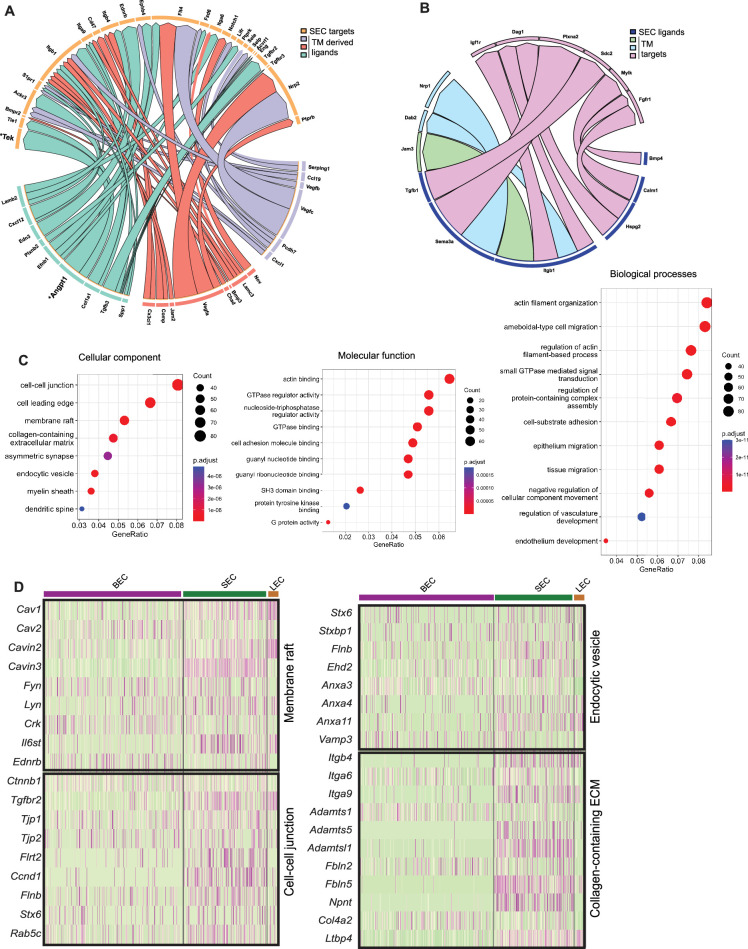
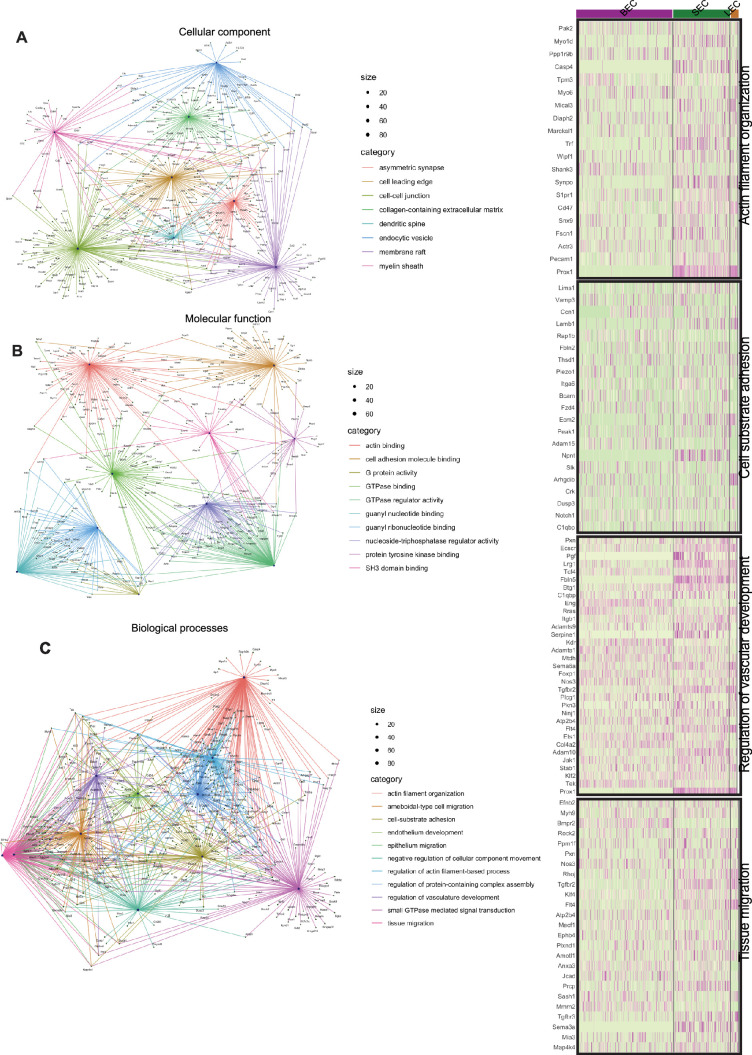
Schlemm's canal (SC) is central in intraocular pressure regulation but requires much characterization. It has distinct inner and outer walls, each composed of Schlemm's canal endothelial cells (SECs) with different morphologies and functions. Recent transcriptomic studies of the anterior segment added important knowledge, but were limited in power by SEC numbers or did not focus on SC. To gain a more comprehensive understanding of SC biology, we performed bulk RNA sequencing on C57BL/6 J SC, blood vessel, and lymphatic endothelial cells from limbal tissue (~4,500 SECs). We also analyzed mouse limbal tissues by single-cell and single-nucleus RNA sequencing (C57BL/6 J and 129/Sj strains), successfully sequencing 903 individual SECs. Together, these datasets confirm that SC has molecular characteristics of both blood and lymphatic endothelia with a lymphatic phenotype predominating. SECs are enriched in pathways that regulate cell-cell junction formation pointing to the importance of junctions in determining SC fluid permeability. Importantly, and for the first time, our analyses characterize three molecular classes of SECs, molecularly distinguishing inner wall from outer wall SECs and discovering two inner wall cell states that likely result from local environmental differences. Further, and based on ligand and receptor expression patterns, we document key interactions between SECs and cells of the adjacent trabecular meshwork (TM) drainage tissue. Also, we present cell type expression for a collection of human glaucoma genes. These data provide a new molecular foundation that will enable the functional dissection of key homeostatic processes mediated by SECs as well as the development of new glaucoma therapeutics.

Keywords: Schlemm's canal; cell biology; glaucoma anterior segment; mouse; single cell transcriptomics; trabecular meshwork.


Conflict of interest statement

RB, KK, TL, NT, AB, GC, VB, RK, SZ, JP, MS, CM, WS, JQ, SJ No competing interests declared

Figures

Figure 1.
Figure 1.. SEC bulk transcriptome is more similar to LEC than BEC transcriptomes.
(A) Pairwise comparison of bulk RNA sequencing data showing differentially expressed genes (DEGs) between cell groups, note larger number of non-DEGs in gray in plot of LEC vs. SEC compared to others. (B) Hierarchical clustering of BECs, SECs, and LECs. (C) Pathways enriched in SECs vs BECs (top panel), LECs vs. SECs (bottom panel) by GSEA analysis. BEC: Blood endothelial cell, LEC: Lymphatic endothelial cell, SEC: Schlemm’s canal endothelial cell.
Figure 1—figure supplement 1.
Figure 1—figure supplement 1.. RNA sequencing of anterior segment limbal tissue.
Schematic showing tissue processing for bulk, single cell, and single nucleus RNA sequencing methods. LEC: Lymphatic endothelial cells, SEC: Schlemm’s canal endothelial cells, BEC: Blood endothelial cells. Created with BioRender.com.
Figure 2.
Figure 2.. scRNA-seq data reveals robust SEC signature genes.
(A) Clusters of cells from the limbal tissue represented on a UMAP space (B) Expression of Egfl7 in endothelial cells. (C) Endothelial cell cluster is sub-clustered into BEC, LEC, and SEC. (D) Expression of Flt1 enriched in BEC, Prox1 in LEC and SEC, and Lvye1 in LEC identifying the three cell clusters. (E) Violin plot of genes expressed BEC, SEC, and LEC from scRNA-seq data. (F) Heatmap of signature genes from BEC, SEC, and LEC from scRNA-seq data. BEC: Blood endothelial cell, LEC: Lymphatic endothelial cell, SEC: Schlemm’s canal endothelial cell.
Figure 2—figure supplement 1.
Figure 2—figure supplement 1.. Cell types in mouse limbal tissue.
(A) Expression levels of various genes previously identified to be specific to individual cell types on a UMAP rendering of single cell clusters. Epithelial cells comprised of conjunctival (Krt13), corneal (Krt14), and proliferating corneal epithelial cells (Mki67); neural crest or periocular mesenchyme derived cells (Pitx2) comprised of trabecular meshwork cells (Tfap2b); corneal keratocytes (Kera); ciliary body (CB) and iris cells (Ptgds); immune cells (Cd74); and neurons (Vsx2, Rho) were identified. (B). Heatmap of differentially expressed genes across various cell clusters identified in the limbal tissue.
Figure 2—figure supplement 2.
Figure 2—figure supplement 2.. Correlation between sequencing modalities.
(A) Correlation between bulk and scRNA-seq comparing log of gene expression ratio between endothelial cell types. (B) Hierarchical clustering of signature genes obtained from scRNA-seq in 2 F using bulk RNA sequencing data. (C) Correlation between sc and snRNA-seq comparing average gene expression across endothelial cell types. BEC: Blood endothelial cell, LEC: Lymphatic endothelial cell, SEC: Schlemm’s canal endothelial cell.
Figure 3.
Figure 3.. Integrating scRNA and snRNA-seq enables detection of outer and inner wall transcriptomes.
(A) snRNA-seq of C57BL/6 J limbal tissue identifies similar cell types as the sc RNA-seq but captures more endothelial cells (left panel). Expression of Egfl7 and Cdh5 in snRNA-seq endothelial cells (right panel). (B) Integration of sc and snRNA-seq endothelial cells followed by sub-clustering identifies BECs, LECs, IW SECs, OW SECs, and CC. Integration of sc- and sn- RNA sequencing shows distribution across clusters (bottom panel). (C) Heatmap of differentially expressed genes of the identified sub-clusters. (D) SECs and LEC sub-clusters identified in B, expressing Prox1. In the SEC cluster, IW cells express Npnt and OW cells Selp, CCs express Ackr1 and BECs robustly express Flt1. IW: Inner wall, OW: Outer wall, CC: Collector channels, BEC: Blood endothelial cell, LEC: Lymphatic endothelial cell, SEC: Schlemm’s canal endothelial cell.
Figure 3—figure supplement 1.
Figure 3—figure supplement 1.. EC and pericyte transcriptomes in scRNA-seq data guided by integrated multimodal data.
(A) Manually re-clustered UMAP showing BECs, pericytes, LECs, IW SECs, OW SECs, and CCs. (B, C) Differences in levels of gene expression among BEC, pericytes, LEC, IW SEC, OW SEC, and CC expressed in a heatmap (B) and a violin plot (C). OW: Outer wall, IW: Inner wall, CC: Collector channels, BEC: Blood endothelial cell, LEC: Lymphatic endothelial cell, SEC: Schlemm’s canal endothelial cell.
Figure 4.
Figure 4.. Integration of C57BL/6 J and 129/Sj endothelial cells identifies IW states.
(A) scRNA-seq of 129/Sj anterior segment tissue identifies various cell types similar to that in C57BL/6 J single-cell RNA sequencing (left panel). Expression of Egfl7 and Cdh5 in snRNA-seq endothelial cells (right panel). (B) Integration of B6 and 129/Sj endothelial cells followed by sub-clustering identifies BECs, LECs, IW1 SECs, IW2 SECs, OW SECs, and CCs (top panel). Integration of B6 and 129/Sj endothelial cells distributed across clusters (bottom panel). (C) Sub-clustering identifies complementary expression patterns of Npnt and Ccl21a in IW1 and IW2 SECs, Ackr1 in CCs, and Selp in OW SECs. (D) Heatmap of differentially expressed genes of the identified sub-clusters. (E) Violin plot showing differences in expression levels of various genes which as a combination defines individual sub-clusters. IW: Inner wall, OW: Outer wall, CC: Collector channels, BEC: Blood endothelial cell, LEC: Lymphatic endothelial cell, SEC: Schlemm’s Canal endothelial cell.
Figure 5.
Figure 5.. Immunofluorescence validates cell types and discovers bias for discrete localization of IW1 and IW2 cells.
(A) Npnt expression in a subgroup of SEC in scRNA-seq data (i) and corresponding immunofluorescence (IF) reveals high level of expression of NPNT in anterior portion of IW of SC in a frozen section (ii) and whole mount (iii and iv). (B) Ccl21a is expressed in SECs and LECs (i) and corresponding IF reveals high expression in posterior portion of IW of SC in a frozen section (ii) and whole mount (iii and iv). (C) Selp is expressed in OW SECs and CCs, a subgroup of SECs in single-cell (i) and corresponding IF (ii frozen section, iii-iv whole mount). (D) Ackr1 expression in a subset of CC cells (i) and corresponding IF (ii frozen section, iii whole mount). DAPI in blue labels nuclei in all panels. IW: Inner wall, OW: Outer wall, CC: Collector channels, CB: Ciliary body, LY: Lymphatic vessels, BV: Blood vessels SC: Schlemm’s canal. Ant.: Anterior SC, Post.: Posterior SC. Scale bar = 100μm.
Figure 5—figure supplement 1.
Figure 5—figure supplement 1.. Biased but variable localization of NPNT and CCL21A in IW of SC.
(A) Immunofluorescence (IF) of NPNT shows variability in expression with a gradient of high expression in the anterior portion of SC (left panel) and uniform expression throughout IW of SC (middle panel) in flash-frozen sections. In situ hybridization using RNAscope shows the expression of Npnt in IW with an anterior expression bias (left panel) (B) IF of CCL21A shows variability in expression with a gradient of high expression in the posterior portion of SC (right panel) and uniform expression throughout IW of SC (left panel) in flash-frozen sections. DAPI in blue labels nuclei in all panels. (C, D) Gene expression analysis of endothelial cell subset in published dataset (Thomson et al., 2021) shows similar segregation of Npnt, Selp, and Ccl21a expression in SECs as seen in our dataset. CB: ciliary body, SC: Schlemm’s canal. Ant.: Anterior Schlemm’s canal, Post.: Posterior Schlemm’s canal. Scale bar = 100μm.
Figure 5—figure supplement 2.
Figure 5—figure supplement 2.. Collector channels, pericytes, and sex-dependent differences within the major EC cluster.
(A) Flt1 is expressed primarily in BECs and in a small subset of SECs in scRNA-seq analysis (i) and corresponding immunofluorescence (IF) of FLT1 in frozen section (ii) and whole-mount (iii-iv). (B) Des is expressed in pericytes, a subgroup of BECs in scRNA-seq analysis (i). Corresponding IF analysis shows its expression in pericytes along collector channels (ii, frozen section, iii-iv whole mount). DAPI in blue labels nuclei in all panels. (C) Sub-clustering of SECs and sex-specificity of endothelial cells. Sex-specific gene expression of Xist, Ddx3y, Lars2, Aes in ‘male’ and ‘female’ clusters of endothelial cells. CC: Collector channel, CB: Ciliary body, OW: Outer wall, BV: Blood vessel, SC: Schlemm’s canal. Scale bar = 100μm.
Figure 5—figure supplement 3.
Figure 5—figure supplement 3.. Main BEC types within major EC cluster and immunofluorescence confirmation of greater lymphatic polarization of IW.
(A) UMAP rendering of BECs subclustered into arteries, capillaries, and veins. (B, C) Violin plot and heatmap showing differential gene expression between arteries, capillaries, and veins in limbal BECs. (D) Flt4 is expressed at mid or low levels in SECs and BECs in scRNA-seq analysis (i) and corresponding IF of FLT4 (ii frozen section, iii-iv whole mount). DAPI in blue labels nuclei. BV: Blood vessel, SC: Schlemm’s canal, CB: Ciliary body, TM: Trabecular meshwork, IW: Inner wall. Scale bar = 100μm.
Figure 6.
Figure 6.. Cell-type assignment of high IOP and glaucoma genes.
(A) Expression levels of gene list obtained from GWAS and genetic analyses associated with glaucoma and elevated IOP. (B) Expression levels of genes involved in developmental forms of glaucoma. (C) Disease relevance score (DRS) of genes from GWAS studies associated with glaucoma and elevated IOP. (D) Expression levels of specific genes in subtypes of endothelial cells.
Figure 6—figure supplement 1.
Figure 6—figure supplement 1.. Cell type assignment of high IOP and glaucoma genes.
Expression patterns of Svep1, Angpt1, Lmx1b, Myoc, and Ltbp2 in the TM cluster.
Figure 7.
Figure 7.. Predicted ligand-target analysis reveals signaling pairs between TM and SC.
(A) (B) Circos plots depicting predicted ligand-target interaction between genes expressed in SECs and those in surrounding trabecular meshwork cells. (C) Gene ontology analysis of genes enriched in SC. (D) Heatmap of genes in individual enriched pathways showing their expression in endothelial cell subsets.
Figure 7—figure supplement 1.
Figure 7—figure supplement 1.. Gene ontology enrichment analysis highlights key cellular component/ pathways in SECs.
(A-C) C-Net plot showing network between individual genes in enriched pathways identified by gene ontology analysis.
Figure 7—figure supplement 2.
Figure 7—figure supplement 2.. Gene ontology enrichment analysis highlights key pathways in IW and OW SECs.
(A–B) Molecular function pathway genes enriched in IW and OW SECs and corresponding c-net plot showing network between individual genes in the pathways.
Author response image 1.
Author response image 1.. Flow sorted SEC and LEC.
We obtained two distinct populations; 1. SEC cells (GPF+LYVE1--blue) 2. LEC (GPF+LYVE1+- red). Note eFluor 660 emission was collected using the Alexa647 (A647) setting of the flow cytometer. Additionally, SEC marker expression from bulk RNA-seq aligns with signature gene expression from SECs in single cell RNA-seq (Figure S3).

Update of

References

    1. Aspelund A, Tammela T, Antila S, Nurmi H, Leppänen VM, Zarkada G, Stanczuk L, Francois M, Mäkinen T, Saharinen P, Immonen I, Alitalo K. The Schlemm’s canal is a VEGF-C/VEGFR-3-responsive lymphatic-like vessel. The Journal of Clinical Investigation. 2014;124:3975–3986. doi: 10.1172/JCI75395. - DOI - PMC - PubMed
    1. Barry DM, McMillan EA, Kunar B, Lis R, Zhang T, Lu T, Daniel E, Yokoyama M, Gomez-Salinero JM, Sureshbabu A, Cleaver O, Di Lorenzo A, Choi ME, Xiang J, Redmond D, Rabbany SY, Muthukumar T, Rafii S. Molecular determinants of nephron vascular specialization in the kidney. Nature Communications. 2019;10:5705. doi: 10.1038/s41467-019-12872-5. - DOI - PMC - PubMed
    1. Braakman ST, Read AT, Chan DWH, Ethier CR, Overby DR. Colocalization of outflow segmentation and pores along the inner wall of Schlemm’s canal. Experimental Eye Research. 2015;130:87–96. doi: 10.1016/j.exer.2014.11.008. - DOI - PMC - PubMed
    1. Braakman ST, Moore JE, Jr, Ethier CR, Overby DR. Transport across Schlemm’s canal endothelium and the blood-aqueous barrier. Experimental Eye Research. 2016;146:17–21. doi: 10.1016/j.exer.2015.11.026. - DOI - PMC - PubMed
    1. Browaeys R, Saelens W, Saeys Y. NicheNet: modeling intercellular communication by linking ligands to target genes. Nature Methods. 2020;17:159–162. doi: 10.1038/s41592-019-0667-5. - DOI - PubMed

Associated data