. 2024 Sep;23(9):e14240.
doi: 10.1111/acel.14240. Epub 2024 Jun 21.

A new gene signature for endothelial senescence identifies self-RNA sensing by retinoic acid-inducible gene I as a molecular facilitator of vascular aging

Affiliations

A new gene signature for endothelial senescence identifies self-RNA sensing by retinoic acid-inducible gene I as a molecular facilitator of vascular aging

Jasenka Guduric-Fuchs et al. Aging Cell. 2024 Sep.

Abstract

The number of senescent vascular endothelial cells increases during aging and their dysfunctional phenotype contributes to age-related cardiovascular disease. Identification of senescent cells is challenging as molecular changes are often tissue specific and occur amongst clusters of normal cells. Here, we established, benchmarked, and validated a new gene signature called EndoSEN that pinpoints senescent endothelial cells. The EndoSEN signature was enriched for interferon-stimulated genes (ISG) and correlated with the senescence-associated secretory phenotype (SASP). SASP establishment is classically attributed to DNA damage and cyclic GMP-AMP synthase activation, but our results revealed a pivotal role for RNA accumulation and sensing in senescent endothelial cells. Mechanistically, we showed that endothelial cell senescence hallmarks include self-RNA accumulation, RNA sensor RIG-I upregulation, and an ISG signature. Moreover, a virtual model of RIG-I knockout in endothelial cells underscored senescence as a key pathway regulated by this sensor. We tested and confirmed that RIG-I knockdown was sufficient to extend the lifespan and decrease the SASP in endothelial cells. Taken together, our evidence suggests that targeting RNA sensing is a potential strategy to delay vascular aging.

Keywords: RNA sensing; cardiovascular diseases; cellular senescence; endothelial cells; senescence‐associated secretory phenotype.


Conflict of interest statement

The authors declare that they have no conflicts of interest.

Figures

FIGURE 1
FIGURE 1
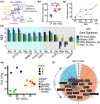
Establishing and benchmarking a senescence gene signature for endothelial cells. (a) Images of early passage (EP) and senescent (Sen) ECFCs stained for senescence‐ associated β‐Galactosidase activity (SA‐β‐Gal). Scale bar: 50 μm. Representative cell culture wells stained with crystal violet to assess for clonogenic capacity. Scale bar: 5 mm. 3D Matrigel angiogenesis assay. ECFCs were stained with calcein for fluorescent microscope imaging at Day 2. Scale bar: 100 μm. (b) Genome‐wide transcriptomics differential gene expression analysis shown in volcano plots. Significantly upregulated transcripts highlighted in purple, orange, and green. (c) Euler diagram for upregulated genes from the three cellular senescence models to identify a common senescence signature in endothelial cells. (d) Heatmap and unbiased clustering analysis for the top 20 upregulated genes based on log 2‐fold change. IFN‐related transcripts are highlighted in red. (e) The images of EP, replicative (Rep) Sen, and etoposide (Eto)‐induced Sen; human retinal microvascular endothelial cells (HRMECs) stained for SA‐β‐Gal. Scale bar: 100 μm. Heatmap and unbiased clustering analysis, using the EndoSEN_up gene signature, showing the top 10 upregulated genes in Sen HRMECs compared to EP HRMECs. (f) Normalized enrichment score (NES) for GSEA benchmarking our EndoSEN signatures to previously established senescence gene signatures. Signatures were assessed across datasets for endothelial cells (yellow background) and fibroblasts (pink background). ECFCs, endothelial colony forming cells; HAECs, human aortic endothelial cells; HRMECs, human retinal microvascular endothelial cells; HUVECs, human umbilical vein endothelial cells; WI‐38 and IMR‐90, human lung fibroblasts.
FIGURE 2
FIGURE 2
Senescent endothelial cells exhibit an interferon‐stimulated gene (ISG) signature. (a) Metascape pathway network analysis from EndoSEN_up signature. (b) Interferon Stimulated Response Element (ISRE) promoter luciferase reporter system used to assess IFN signaling bioactivity in EP and Sen ECFCs from the three models. ECFCs treated with 100 IU/mL IFNβ were used as positive controls and shown in orange. N = 4, ns: not significant, *p < 0.05. (c) Comparison of IFN signature metric (ISM) across experimental groups in three biological replicates. (d) Normalized enrichment score (NES) for interferon gene signatures from MSigDB in our and other publicly available datasets. Signatures were assessed across endothelial cells (light blue background) and fibroblasts (grey background). (e) Principal component analysis of transcriptomes obtained from five experimental groups (EP, IFN‐treated EP, and the three senescence models Replicative, Etoposide, and X‐rays), each from three biological replicates. (f) Circular volcano plot for IFN‐treated ECFCs depicting upregulated genes in orange and downregulated in light blue. The genes that are common to EndoSEN_up have been highlighted and named.
FIGURE 3
FIGURE 3
Endothelial cells in the aged mouse retina show an ISG and EndoSEN gene signatures. (a) Experimental design. Cell suspensions for scRNA‐seq were obtained from mouse retinas at 3 ages: 3, 12, and 23 months. Enrichment for CD31+ cells was performed using the autoMACS. Created with BioRender.com. (b) UMAP visualization of distinct retinal cell types isolated from mouse retinas. (c) Gene expression level depicted in UMAPs for Irf7 and Isg15 across the three age groups. (d) Average expression level for interferon related genes across endothelial cells, rods, Muller cells, and cones. (e) Heatmap depicting results from Single Cell Pathway Analysis to evaluate interferon and senescence gene signatures in each cell cluster.
FIGURE 4
FIGURE 4
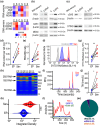
Expression of nucleic acid sensors and accumulation of self‐RNA in senescent endothelial cells. (a) Heatmap depicting z‐scores for qRT‐PCR results evaluating gene expression of RNA and DNA sensors when comparing control (C) and senescent (S) ECFCs in the replicative senescence model across three biological replicates. (b) Protein expression changes for RNA sensors RIG‐I, OAS1, and MDA5 with endothelial senescence. (c) Protein expression changes for DNA sensors cGAS and STING with endothelial senescence. (d) RNA content per cell, evaluated from total RNA extracted from 200,000 early passage (EP) or senescent (Sen) ECFCs using the Maxwell automated system in the replicative senescence model. (e) RNA/DNA ratio quantified in EP and Sen ECFCs using the replicative senescence model. (f) Representative flow cytometry histograms to depict RNA binding dye SYTO RNASelect fluorescence signal using the etoposide‐induced senescence model. (g) Quantification and statistical analysis of SYTO RNASelect results. MFI, median fluorescence intensity. (h) Density gel image from a Fragment Analyzer system assessment of total RNA separation highlighting ribosomal RNA bands, using the replicative senescence model. (i) Electropherogram overlay of a representative paired sample for EP versus replicative Sen ECFCs. (j) Dot plot comparison for the quantification of total integrated molarity (TIM) in EP and Sen ECFCs, from the Fragment Analyzer assessment. (k) Violin plots quantification of RNA synthesis evaluated using Click‐iT chemistry in the etoposide‐induced senescence model. (l) Electropherogram overlay for RIP RNA samples precipitated using RIG‐I or SNRNP70 antibodies in replicative senescence model. Mouse IgG was used as a negative control. (m) Pie chart showing the frequency of RNA species found to bind RIG‐I protein. *p < 0.05, **p < 0.01, ***p < 0.001, ns: non‐significant, n ≥ 4 independent experiments.
FIGURE 5
FIGURE 5
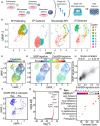
scRNA‐seq data and scTenifoldKnK computational tool predicted that the RIG‐I knockout in endothelial cells affects expression of senescence genes. (a) Experimental design. Human endothelial cells at early passage (EP) proliferating, EP quiescent, mid‐passage, and senescent were analyzed by scRNA‐seq. Created with Canva.com. (b) UMAPs to visualize the cell cluster changes across the in vitro lifespan on human endothelial cells. (c) Pseudotime analysis showing gene trajectories. (d) GSEA scores for SASP and Endosen_up gene signatures. (e) Correlation analysis for SASP and EndoSen_up gene signatures. (f) Expression level of RIG‐I positive cells in the scRNAseq dataset. (g) scTenifold virtual RIG‐I knockout. Genes that are significantly affected by the RIG‐I virtual knockout are highlighted in red. (h) KEGG pathway enrichment analysis for genes predicted to be dysregulated by the RIG‐I virtual knockout.
FIGURE 6
FIGURE 6
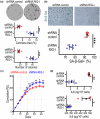
Knockdown of RIG‐I delays senescence establishment in endothelial cells. Stable RIG‐I knock down cells were produced at an early passage using RIG‐I shRNA lentiviral vector. Control cells were transduced with a same vector containing nontargeting control shRNA. After confirming RIG‐I knockdown, senescence was induced by serial passaging or Etoposide exposure. (a) Representative images from clonogenic assays performed in shRNA control and shRNA RIG‐I transfected endothelial cells in the replicative senescence model, and the quantification of colony area and number of colonies. (b) Micrographs of cells stained for SA‐β‐Gal in cells in the Etoposide‐induced senescence model, and the quantification comparing RIG‐I deficient with control cells. (c) Growth curves for human endothelial cells cultured in vitro until they reached their Hayflick limit. (d) Quantification of secreted IL8 and IL6 in conditioned media by ELISA in the Etoposide‐induced senescence model. N ≥ 3, *p < 0.05; **p < 0.01, ***p < 0.001.

References

    1. Andersen, J. B. , Li, X. L. , Judge, C. S. , Zhou, A. , Jha, B. K. , Shelby, S. , Zhou, L. , Silverman, R. H. , & Hassel, B. A. (2007). Role of 2‐5A‐dependent RNase‐L in senescence and longevity. Oncogene, 26, 3081–3088. - PubMed
    1. Baris, A. , Fraile‐Bethencourt, E. , Eubanks, J. , Khou, S. , & Anand, S. (2023). Thymidine phosphorylase facilitates retinoic acid inducible gene‐I induced endothelial dysfunction. Cell Death & Disease, 14, 294. - PMC - PubMed
    1. Bochenek, M. L. , Schütz, E. , & Schäfer, K. (2016). Endothelial cell senescence and thrombosis: ageing clots. Thrombosis Research, 147, 36–45. - PubMed
    1. Buchwalter, A. , & Hetzer, M. W. (2017). Nucleolar expansion and elevated protein translation in premature aging. Nature Communications, 8, 1–13. - PMC - PubMed
    1. Chan, M. , Yuan, H. , Soifer, I. , Maile, T. M. , Wang, R. Y. , Ireland, A. , O'Brien, J. , Goudeau, J. , Chan, L. , Vijay, T. , Freund, A. , Kenyon, C. , Bennett, B. , McAllister, F. , Kelley, D. R. , Roy, M. , Cohen, R. L. , Levinson, A. D. , Botstein, D. , & Hendrickson, D. G. (2022). Novel insights from a multiomics dissection of the Hayflick limit. eLife, 11, e70283. - PMC - PubMed

LinkOut - more resources