. 2024 Oct 1;13(10):28.
doi: 10.1167/tvst.13.10.28.

A Child-Friendly Wearable Device for Quantifying Environmental Risk Factors for Myopia

Affiliations

A Child-Friendly Wearable Device for Quantifying Environmental Risk Factors for Myopia

Agostino Gibaldi et al. Transl Vis Sci Technol. .

Abstract

Purpose: In the past few decades, the prevalence of myopia, where the eye grows too long, has increased dramatically. The visual environment appears to be critical to regulating the eye growth. Thus, it is very important to determine the properties of the environment that put children at risk for myopia. Researchers have suggested that the intensity of illumination and range of distances to which a child's eyes are exposed are important, but this has not been confirmed.

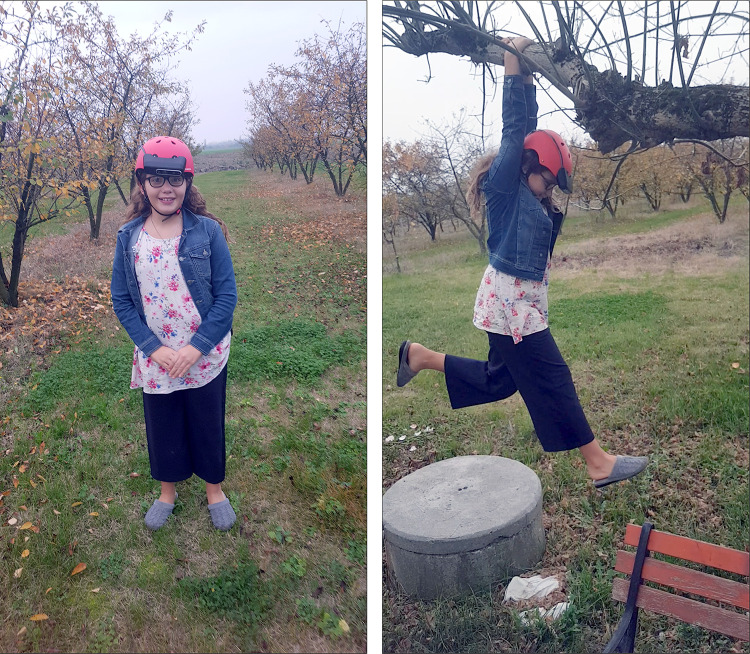
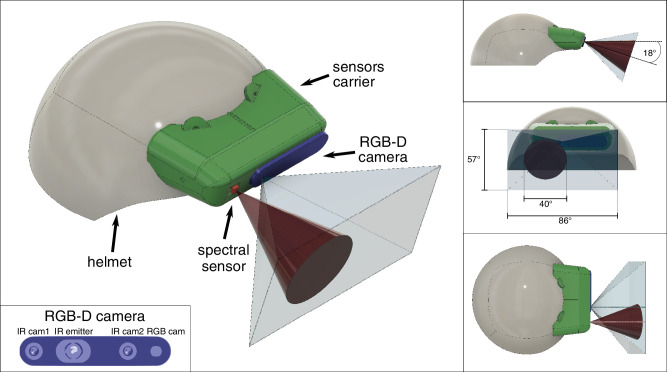
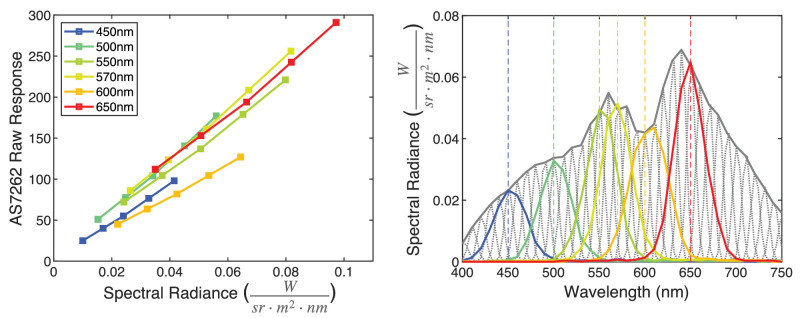
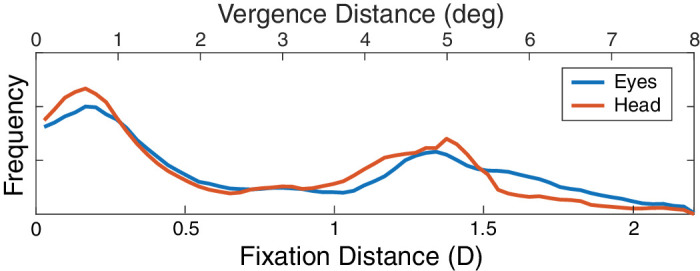
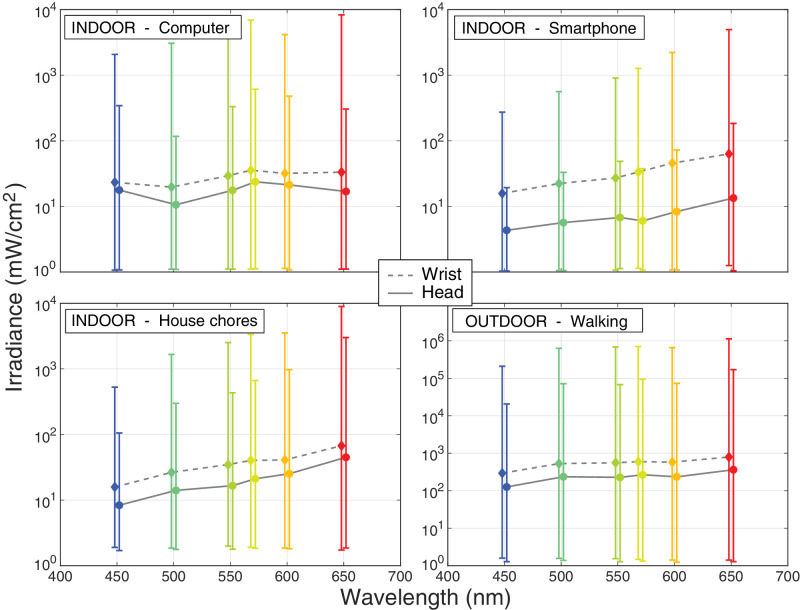
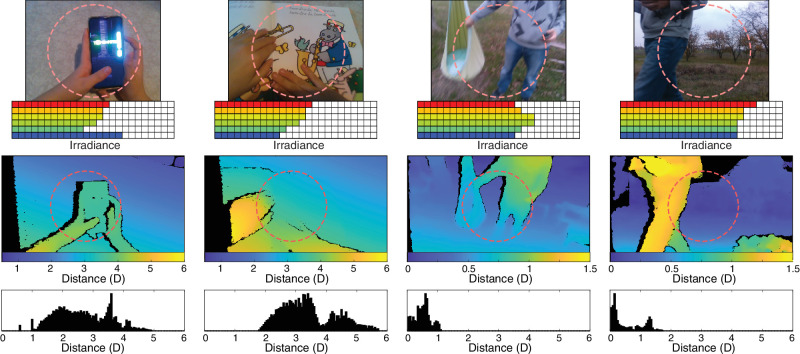
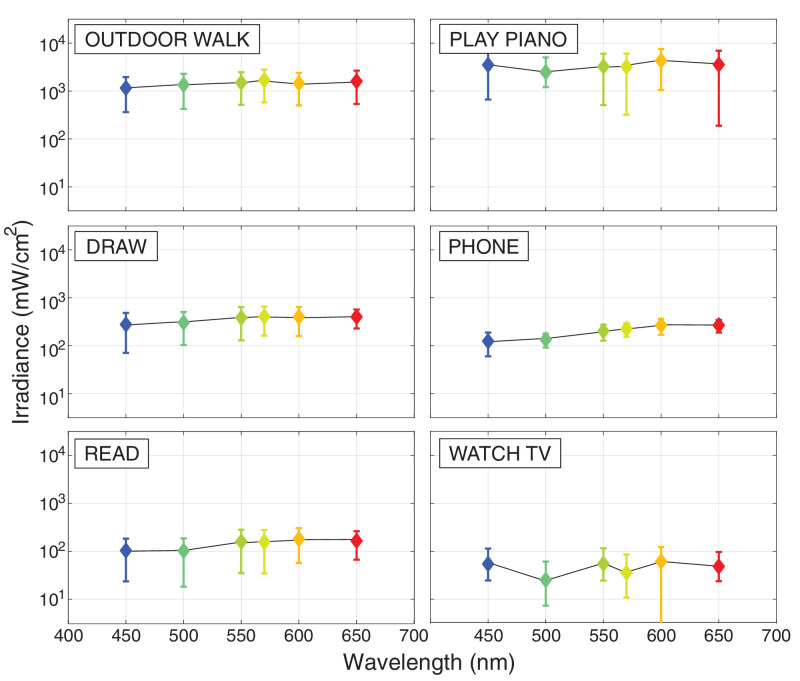
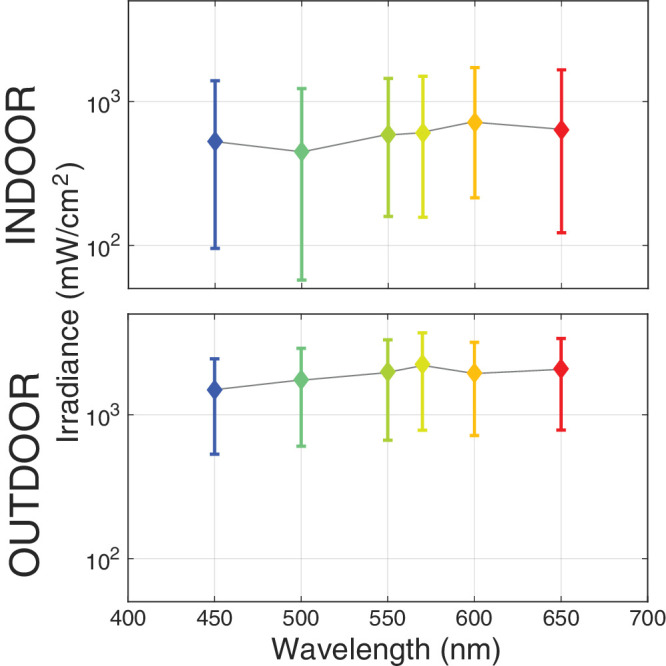
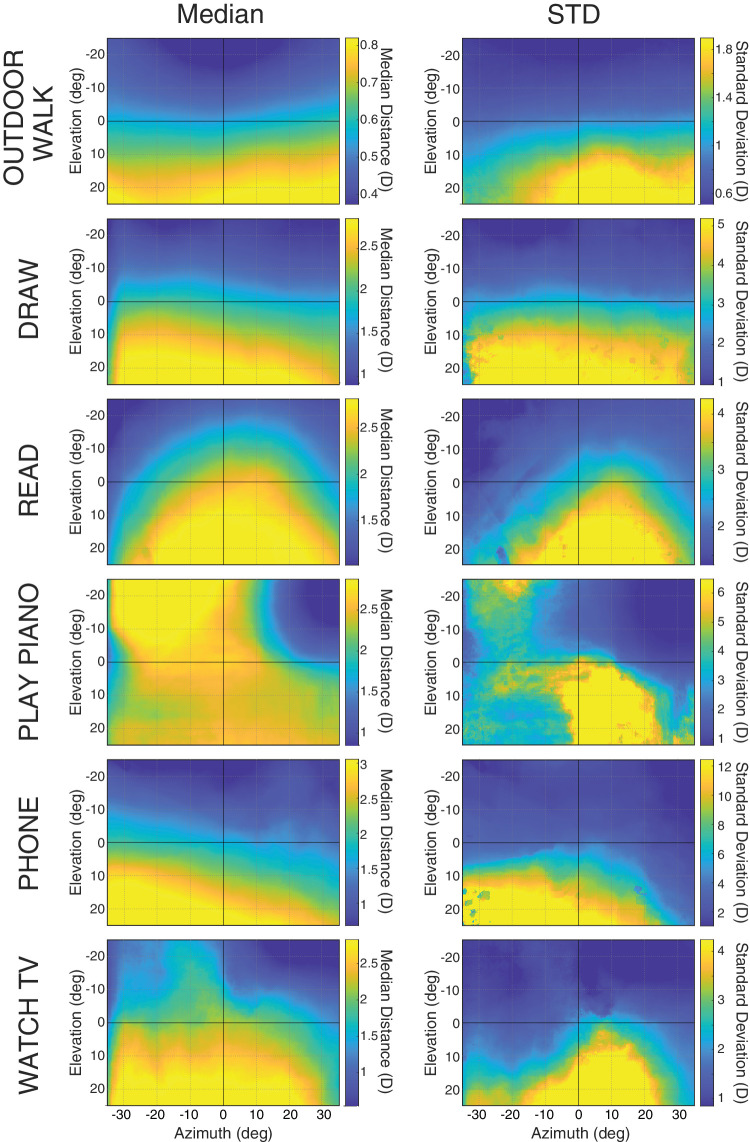
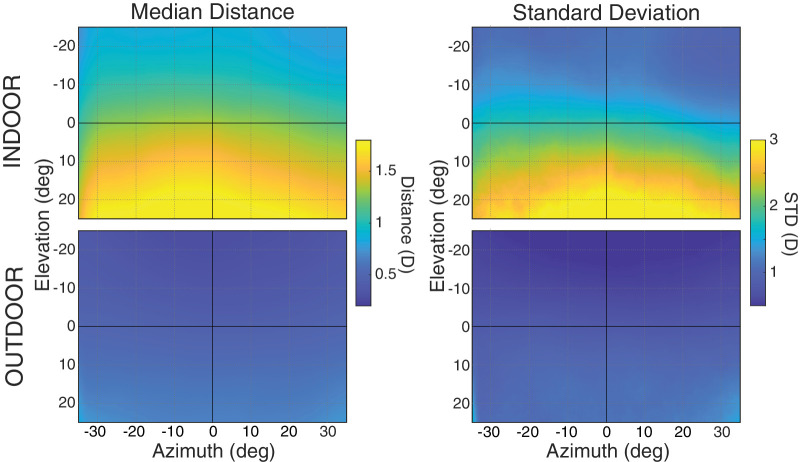
Methods: We designed, built, and tested an inexpensive, child-friendly, head-mounted device that can measure the intensity and spectral content of illumination approaching the eyes and can also measure the distances to which the central visual field of the eyes are exposed. The device is mounted on a child's bicycle helmet. It includes a camera that measures distances over a substantial range and a six-channel spectral sensor. The sensors are hosted by a light-weight, battery-powered microcomputer. We acquired pilot data from children while they were engaged in various indoor and outdoor activities.

Results: The device proved to be comfortable, easy, and safe to wear, and able to collect very useful data on the statistics of illumination and distances.

Conclusions: The designed device is an ideal tool to be used in a population of young children, some of whom will later develop myopia and some of whom will not.

Translational relevance: Such data would be critical for determining the properties of the visual environment that put children at risk for becoming myopic.


Conflict of interest statement

Disclosure: A. Gibaldi, None; E.N. Harb, None; C.F. Wildsoet, None; M.D. Banks, None

Figures

Figure 1.
Figure 1.
Our device being used by a child. The left panel shows the fit of the device on the head. The right panel shows how it allows freedom of movement.
Figure 2.
Figure 2.
Schematic of the device. The left panel shows the helmet (gray) with the sensor mount (green), the spectral sensor (red) and its field of view (brown cone), and the RealSense camera (blue) and its field of view (light gray frustum). The inset shows the layout of one RGB and two infrared cameras and infrared emitter on the RealSense device. The right panels show the device from different perspectives: the side view in the upper panel, the front view in the middle panel, and the top view in the bottom panel. The panels show the downward pitch of the device and the fields of view of the sensors. Note that the fields of view of the two sensors overlap substantially at longer distances.
Figure 3.
Figure 3.
Calibration of the AS7262 Spectral Sensor. The left panel shows the raw data from the AS7262 plotted against the radiance presented at each of 6 wavelengths that correspond to the peak sensitivities of the 6 spectral channels. Five intensities were presented at each wavelength. The right panel shows the spectral radiance of the emitted light from the light source (gray dotted curves) for presentation in 10 nm steps from 380 to 780 nm. The gray solid line is the envelope of those source intensities. The colored lines represent the responses of each channel.
Figure 4.
Figure 4.
Estimates of fixation distance. The frequency of occurrence is plotted as a function of fixation distance estimated in two ways: (1) by measuring distance to points in the scene ahead and binocular eye fixation to determine the distance of the fixated point, and (2) by assuming that the fixated point was in the head's sagittal plane and 18 degrees downward. The former is represented by the blue curve and the latter by the red curve. The lower abscissa represents fixation distance in diopters. The upper abscissa represents the corresponding convergence angle in degrees.
Figure 5.
Figure 5.
Irradiance measured at wrist and head in indoor and outdoor environments. Log of median irradiance is plotted for each of the six sampled parts of the spectrum. Three panels plot the data from indoor activities and one plots data from an outdoor activity. Diamonds and dashed lines represent the data from the AS7262 on the wrist. Circles and solid lines represent the data from the AS7262 on the head. Error bars represent the interquartile ranges.
Figure 6.
Figure 6.
Example data from our device. The two left columns are data from indoor activities and the two right columns data from outdoor activities. The top row shows images from the RGB camera, which has a field of view of 69 degrees × 42 degrees. The dashed circles represent the field of view of the spectral sensor. We do not store RGB images from actual experimental sessions to avoid privacy issues; they are shown here only as examples. The second row shows irradiances from the above scenes from the six channels of the spectral sensor. The third row shows distances in diopters from the scenes above measured by the depth camera. Blue represents farther points and yellow nearer ones. Note the change in scale between the indoor activities on the left and outdoor activities on the right. Black regions in these panels represent areas where distance computation was not reliable due to occlusions or reflections. The field of view of the depth camera was 87 degrees × 58 degrees, which is somewhat larger than that of the RGB camera. The dashed circles again represent the field of view of the spectral sensor. The bottom row provides distance histograms for the scenes above, where distance is again expressed in diopters.
Figure 7.
Figure 7.
Illumination statistics for six activities. Each panel shows the median irradiance for six wavelengths for one activity. Subject 1 provided data for an outdoor walk, drawing, reading, and using a phone. Subject 2 provided data for an outdoor walk, reading, playing the piano, and watching the TV. Error bars represent 25% and 75% quartiles.
Figure 8.
Figure 8.
Spectral composition of indoor (top panel) and outdoor (bottom panel) light environments. Log median irradiance values are plotted for the six sampled parts of the spectrum. Error bars are standard deviations. Data were collected from two children as they engaged in indoor and outdoor activities. The indoor data come from 14 tasks and the outdoor data from 4.
Figure 9.
Figure 9.
Distance statistics for six tasks. The left panels show the median distances across the central field. Elevation and azimuth are in head-centric coordinates, so the center of each panel represents a point in the head's sagittal plane and downward by 18 degrees relative to the head's transverse plane. The color bars on the side of each panel show the range of distances for that panel. Note the change in scale for the outdoor data compared to the indoor. The right panels show the standard deviations of those distances. Again, the color bars show the range of standard deviations for the corresponding panel. Note the change in scale for the outdoor data compared to the indoor. From top to bottom, the data in this figure are from the outdoor walk activity, drawing, reading, playing the piano, using the phone, and watching television.
Figure 10.
Figure 10.
Distance statistics from indoor and outdoor environments. The left panels plot median distance in diopters. The right panels plot standard deviations of those distances. The plots are in head-centric coordinates, so the middle of each panel represents a point in the head's mid-sagittal plane and 18 degrees downward relative to the head's transverse plane. The data were collected from two children as they engaged in various indoor and outdoor activities. The upper panels are the data from 14 indoor activities and the lower panels the data from 2 outdoor activities.

References

    1. Rabin J, Van Sluyters R, Malach R. Emmetropization: a vision-dependent phenomenon. Invest Ophthalmol Vis Sci . 1981; 20: 561–564. - PubMed
    1. Troilo D, Smith EL 3rd, Nickla DL, et al. .. IMI–report on experimental models of emmetropization and myopia. Invest Ophthalmol Vis Sci . 2019; 60: M31–M88. - PMC - PubMed
    1. Fan DS, Lam DSC, Lam RF, et al. .. Prevalence, incidence, and progression of myopia of school children in Hong Kong. Invest Ophthalmol Vis Sci . 2004; 45: 1071–1075. - PubMed
    1. Williams KM, Bertelsen G, Cumberland P, et al. .. Increasing prevalence of myopia in Europe and the impact of education. Ophthalmology . 2015; 122: 1489–1497. - PMC - PubMed
    1. Morgan IG, Wu PC, Ostrin LA, et al. .. IMI risk factors for myopia. Invest Ophthalmol Vis Sci . 2021; 62: 3. - PMC - PubMed

Publication types