. 2024 Oct 18;10(42):eadp7872.
doi: 10.1126/sciadv.adp7872. Epub 2024 Oct 18.

Bioenergetic-active exosomes for cartilage regeneration and homeostasis maintenance

Affiliations

Bioenergetic-active exosomes for cartilage regeneration and homeostasis maintenance

Xulong Liu et al. Sci Adv. .

Abstract

Cartilage regeneration relies on adequate and continuous bioenergy supply to facilitate cellular differentiation and extracellular matrix synthesis. Chondrocytes frequently undergo energy stress under pathological conditions, characterized by disrupted cellular metabolism and reduced adenosine triphosphate (ATP) levels. However, there has limited progress in modulating energy metabolism for cartilage regeneration thus far. Here, we developed bioenergetic-active exosomes (Suc-EXO) to promote cartilage regeneration and homeostasis maintenance. Suc-EXO exhibited a 5.42-fold increase in ATP content, enabling the manipulation of cellular energy metabolism by fueling the TCA cycle. With continuous energy supply, Suc-EXO promoted BMSC chondrogenic differentiation via the P2X7-mediated PI3K-AKT pathway. Moreover, Suc-EXO improved chondrocyte anabolism and mitochondrial homeostasis via the P2X7-mediated SIRT3 pathway. In a rabbit cartilage defect model, the Suc-EXO-encapsulated hydrogel notably promoted cartilage regeneration and maintained neocartilage homeostasis, leading to 2.26 and 1.53 times increase in Col2 and ACAN abundance, respectively. These findings make a remarkable breakthrough in modulating energy metabolism for cartilage regeneration, offering immense potential for clinical translation.


Figures

Fig. 1.
Fig. 1.. Preparation and characterization of bioenergetic-active exosomes (Suc-EXO).
(A) Schematic illustration of the preparation of Suc-EXO–and Suc-EXO–loaded hydrogel. (B) Schematic illustration of the underlying mechanism of Suc-EXO promotes cartilage regeneration and homeostasis maintenance. (C) Relative ATP activity of exosomes after stimulated by succinate at different concentrations. (D) Representative TEM imaging of N-EXO (left), Suc500-EXO (middle), and Suc1000-EXO (right). (E) Surface markers of N-EXO and Suc500-EXO measured by Western blot. (F) The effect of N-EXO and Suc-EXO on BMSC proliferation by CCK8 assay for 12 hours, 1 day, 2 days, and 3 days. (G) The effect of N-EXO and Suc-EXO on chondrocyte proliferation by CCK8 assay for 1 day and 3 days. Results in (C), (F), and (G), represent the means ± SD (n ≥ 3 biological repeats). Statistical analysis: *P < 0.05, **P < 0.01, and ***P < 0.001, analyzed using analysis of variance (ANOVA) with Tukey’s multiple comparisons test.
Fig. 2.
Fig. 2.. Exosomes metabolomic profiling of Suc-EXO versus N-EXO.
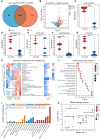
(A and B) Venn plot (A) and volcano plots (B) of Suc-EXO versus N-EXO. (C to G) Relative metabolome abundance of Suc-EXO versus N-EXO. (H) Heatmap of differential metabolites expression profile and VIP of metabolite analysis of Suc-EXO versus N-EXO. (I to K) KEGG pathway classification (I), KEGG enrichment analysis (J), and KEGG topology analysis (K) of Suc-EXO versus N-EXO. Results in (C), (D), (E), (F), and (G) represent the mean ± SD (n = 4 biological repeats). Statistical analysis: *P < 0.05, **P < 0.01, and ***P < 0.001 analyzed using ANOVA with Tukey’s multiple comparisons test. FC, fold change; cAMP, cyclic adenosine 3′,5′-monophosphate.
Fig. 3.
Fig. 3.. The effect of bioenergetic-active exosomes on reprogramming cell metabolism.
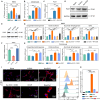
(A and B) Relative ATP activity of BMSCs (A) and chondrocytes (B) after treatment by N-EXO and Suc-EXO for 3 days. (C and D) Relative P2X7 mRNA (C) and protein (D) levels in BMSCs after stimulation by N-EXO and Suc-EXO. (E and F) Knockdown of P2X7 measured by Western blot (E) and RT-PCR (F). (G and H) Relative BMSC (G) and chondrocyte (H) mRNA levels of key metabolic enzymes in the TCA cycle after being stimulated by N-EXO and Suc-EXO. (I) TMRE fluorescent staining of BMSCs incubated with N-EXO and Suc-EXO with or without KN62, 1 μM. The respiratory chain inhibitor (CCCP, 20 μM) was used as a negative control. (J) TMRE fluorescence intensity of BMSCs by flow cytometry. (K) Mean TMRE fluorescence intensity of flow cytometry results. Results in (A) to (C), (F), (G), (H), (J) and (K) represent the mean ± SD (n = 3 biological repeats). Statistical analysis: *P < 0.05, **P < 0.01, and ***P < 0.001 (n.s., not significant), analyzed using ANOVA with Tukey’s multiple comparisons test.
Fig. 4.
Fig. 4.. Bioenergetic-active exosomes promotes BMSC chondrogenic differentiation and chondrocyte’s homeostasis maintenance through the P2X7-mediated pathway.
(A) Hematoxylin and eosin (H&E) (top)–, Toluidine blue (middle)–, Alcian blue (bottom)–stained sections of BMSC microspheres cocultured with N-EXO and Suc-EXO for 28 days. (B) Relative mRNA level of chondrogenic differentiation gene after stimulated by N-EXO and Suc-EXO for 7 days (bottom), 14 days (middle), and 21 days (top) in chondrogenic differentiation medium. (C) Relative mRNA level of Col2, ACAN, MMP9, and MMP13 of BMSCs in common medium. (D) The protein levels of MMP13, MMP9, and Col2 in BMSCs quantified by Western blot. (E) Relative mRNA level of PI3K (top), AKT (middle), and mTOR (down) after incubation with N-EXO, N-EXO, and KN62, Suc-EXO or Suc-EXO and KN62. (F) The protein levels of P2X7, P-mTOR, mTOR, P-S6K, S6K, P-AKT, and AKT in BMSCs quantified by Western blot. (G to I) Relative mRNA level of Col2 (G), ACAN (H), and MMP13 (I) in chondrocytes. (J) The protein levels of MMP13 and Col2 in chondrocytes quantified by Western blot. (K and L) Relative mRNA level of SIRT3 (K) and AMPK (L) in chondrocytes. (M) The protein levels of P2X7, SIRT3, p-AMPK, and AMPK in chondrocytes quantified by Western blot. Results in (B), (C), (E), (G) to (I), and (K) and (L) represent the mean ± SD (n = 3 biological repeats). Statistical analysis: *P < 0.05, **P < 0.01, and ***P < 0.001, analyzed using ANOVA with Tukey’s multiple comparisons test.
Fig. 5.
Fig. 5.. Fabrication and characterization of hHA/oALG hydrogel and its effect on cartilage regeneration.
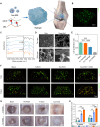
(A) Schematic of fabricating hHA/oALG hydrogels for cartilage regeneration. (B) Exosomes distribution in hHA/oALG hydrogels showed by confocal microscopy. (C) FTIR spectroscopy of the freeze-dried samples of hydrogels. (D) Representative SEM image of hHA/oALG hydrogels. (E) BMSC viability in 1 and 2% hHA/oALG hydrogels detected by the CCK8 assay. A total of 10% dimethyl sulfoxide (DMSO) was used as negative control. (F) BMSC viability in hHA/oALG hydrogels showed by the Live/Dead assay. Green fluorescence represents live cells, and red fluorescence represents dead cells. (G) Gross observation of cartilage at 6 and 12 weeks after hydrogel injection. (H) ICRS macroscopic evaluation of the cartilage defect. Data in (E) and (H) represent the means ± SD (n ≥ 3 biological repeats). Statistical analysis: ***P < 0.001, analyzed using ANOVA with Tukey’s multiple comparisons test.
Fig. 6.
Fig. 6.. Bioenergetic-active exosomes promote cartilage regeneration and subchondral bone reconstruction.
(A) Safranin-O staining of repaired cartilage at 6 and 12 weeks. (B) ICRS histological evaluation of the cartilage defect at 6 and 12 weeks. (C) 3D reconstruction imaging of repaired knees at 6 weeks after surgery in various groups. (D and E) Relative bone volume per total volume (BV/TV) and trabecular thickness in various groups at 6 weeks. (F) 3D reconstruction imaging of repaired knees at 12 weeks after surgery in various groups. (G and H) Relative BV/TV and trabecular thickness in various groups at 12 weeks. Results in (B), (D), (E), (G), and (H) represent the mean ± SD (n ≥ 3 biological repeats). Statistical analysis: *P < 0.05, **P < 0.01, and ***P < 0.001, analyzed using ANOVA with Tukey’s multiple comparisons test.
Fig. 7.
Fig. 7.. Immunohistochemical and immunofluorescence assessment of cartilage regeneration.
(A) Immunohistochemical staining for Col2, ACAN, MMP9, and MMP13. Relative staining intensity of ACAN (B), Col2 (C), MMP9 (D), and MMP13 (E) in cartilage samples at 6 and 12 weeks. (F) Immunofluorescence staining for SIRT3 and Col2 at 12 weeks. Results in (B) to (E) represent the mean ± SD (n = 3 technical repeats). Statistical analysis: **P < 0.01 and ***P < 0.001, analyzed using ANOVA with Tukey’s multiple comparisons test.

References

    1. Marshall M., Watt F. E., Vincent T. L., Dziedzic K., Hand osteoarthritis: Clinical phenotypes, molecular mechanisms and disease management. Nat. Rev. Rheumatol. 14, 641–656 (2018). - PubMed
    1. Huey D. J., Hu J. C., Athanasiou K. A., Unlike bone, cartilage regeneration remains elusive. Science 338, 917–921 (2012). - PMC - PubMed
    1. Hunter D. J., Bierma-Zeinstra S., Osteoarthritis. Lancet 393, 1745–1759 (2019). - PubMed
    1. Sharma L., Osteoarthritis of the knee. N. Engl. J. Med. 384, 51–59 (2021). - PubMed
    1. Bijlsma J. W., Berenbaum F., Lafeber F. P., Osteoarthritis: An update with relevance for clinical practice. Lancet 377, 2115–2126 (2011). - PubMed

Substances

LinkOut - more resources